Clinical Trial
. 2015 Sep;3(9):1008-16.
doi: 10.1158/2326-6066.CIR-14-0227. Epub 2015 May 12.

Preexisting Levels of CD4 T Cells Expressing PD-1 Are Related to Overall Survival in Prostate Cancer Patients Treated with Ipilimumab

Affiliations
Clinical Trial

Preexisting Levels of CD4 T Cells Expressing PD-1 Are Related to Overall Survival in Prostate Cancer Patients Treated with Ipilimumab

Serena S Kwek et al. Cancer Immunol Res. 2015 Sep.

Abstract

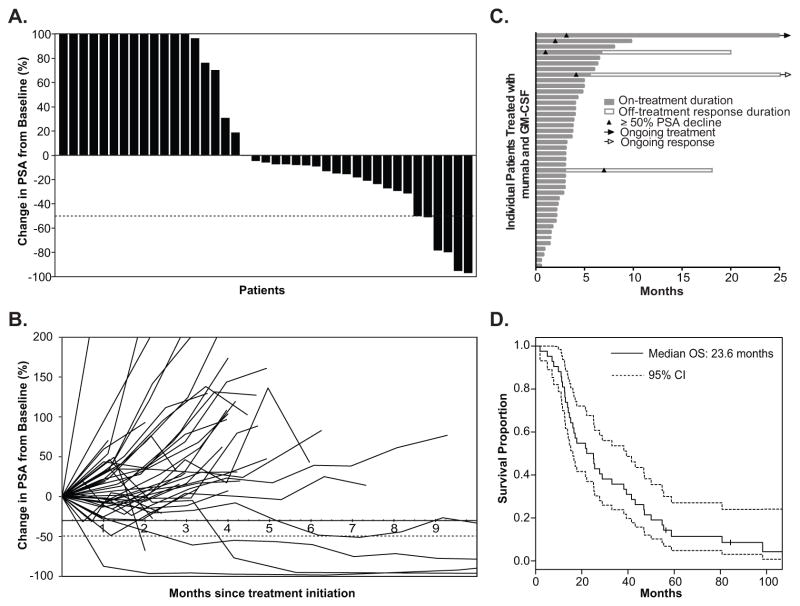
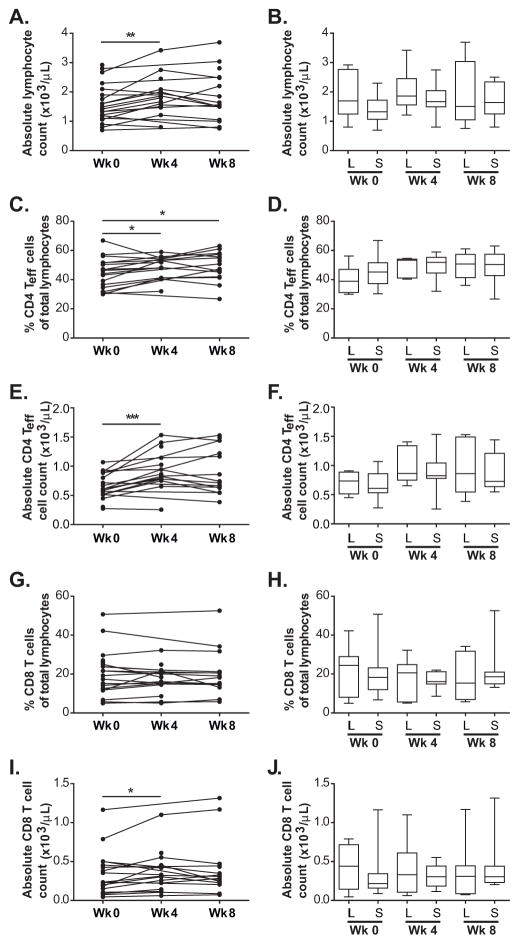
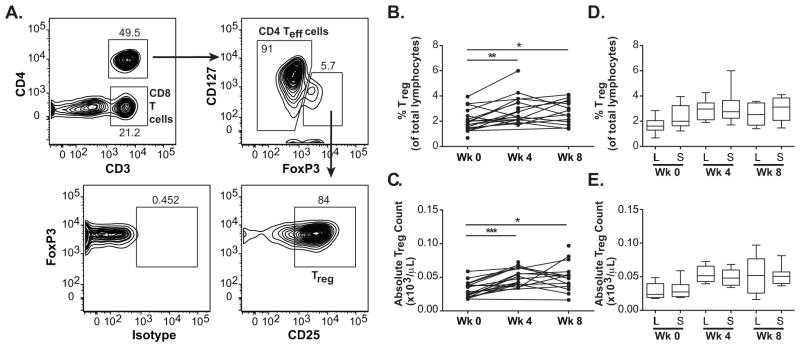
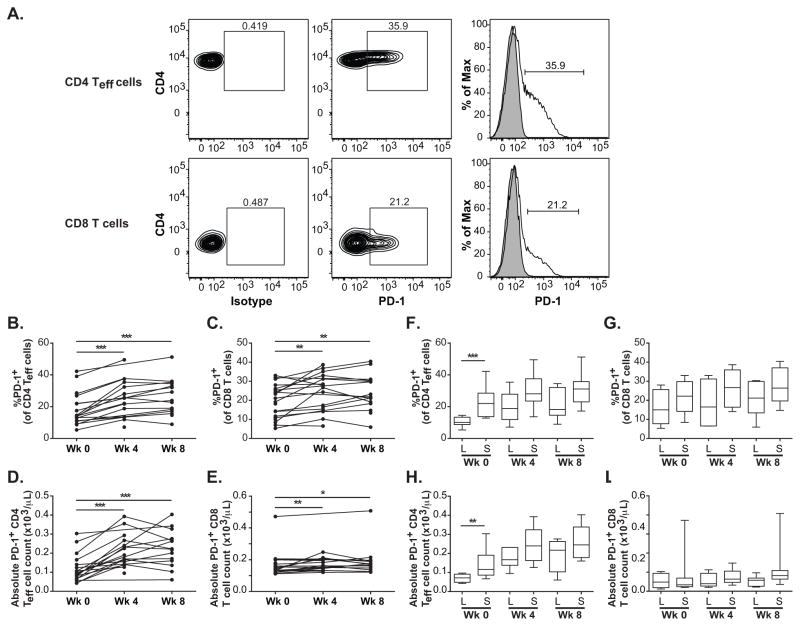
Cytotoxic T-lymphocyte-associated antigen-4 (CTLA-4) blockade can induce tumor regression and improved survival in cancer patients. This treatment can enhance adaptive immune responses without an exogenous vaccine, but the immunologic biomarkers associated with improved clinical outcome in cancer patients are not fully established. A phase Ib trial in patients with metastatic, castration-resistant prostate cancer was performed combining ipilimumab with sargramostim (GM-CSF). In addition to evaluating ipilimumab dose, patients were followed clinically for response and overall survival, and for immunomodulation of circulating T cells. PSA declines of ≥50% and radiographic responses were observed at doses of ≥3 mg/kg/dose. Timing of clinical responses could be either immediate or delayed. Durable responses were also observed off treatment. A subset of patients experienced long-term survival with or without objective clinical responses. The relationship between T-cell phenotype in peripheral blood and overall survival was examined retrospectively. We found that the treatment induced an increase in the levels of CD4(+) effector T (Teff) cells, regulatory T cells, PD-1(+) CD4 Teff cells, and PD-1(+) CD8 T cells. However, these increased levels were not associated with overall survival. Instead, low pretreatment baseline levels of PD-1(+) CD4 Teff cells were found to correlate with longer overall survival. Furthermore, baseline levels of PD-1(+) CD4 Teff cells from patients with shorter overall survival were higher than from cancer-free male control subjects. These results suggest that preexisting expression of immunologic checkpoint marker PD-1 on CD4 Teff cells may help identify patients that may benefit from ipilimumab treatment.


Conflict of interest statement

Disclosure of Potential Conflicts of Interest: LF has received research support from Bristol-Myers Squibb.

Figures

Figure 1
Figure 1
Clinical outcomes of 42 mCRPC patients in a Phase Ib ipilimumab (anti-CTLA-4) and sargramostim (GM-CSF) clinical trial. A, Waterfall plot of the maximum percentage change in PSA from baseline of each patient until nadir or off study. Dashed line shows 50% decline in PSA. B, Spider plot shows change in PSA with time from baseline of each patient until nadir or off study. Dashed line shows 50% decline in PSA. C, Graph showing the duration of study treatment, duration of response, time to disease progression, and time to ≥50% decline in PSA for each patient. D, Overall survival curves for all patients based on the analysis on the censor date. Dotted lines below and above the survival curve (solid line) show lower and upper 95% confidence intervals, respectively. Vertical tick marks indicate OS of patients who were still alive as of the censor date.
Figure 2
Figure 2
Levels of circulating lymphocytes, CD4 Teff cells and CD8 T cells with treatment. A, Time course of absolute lymphocyte counts for assessed patients at week 0 (pre-treatment), week 4 (cycle 1), and week 8 (cycle 2) of treatment. Connected dots show time course of the same patient. B, Box plots of absolute lymphocyte counts for long-term (L) and short-term (S) survivors at each time point. C and G, Time course of percentages of CD4 Teff cells and CD8 T cells in total lymphocytes, respectively. Connected dots show time course of the same patient. E and I, Time course of absolute counts of CD4 Teff cells and CD8 T cells, respectively. D and H, Box plots of percentage of CD4 Teff cells and CD8 T cells in total lymphocytes, respectively, for long-term (L) and short-term (S) survivors at each time point. F and J, Box plots of absolute counts of CD4 Teff cells and CD8 T cells, respectively, for long-term (L) and short-term (S) survivors at each time point. Whiskers show minimum and maximum levels. * p-value < 0.05, *** p-value < 0.001.
Figure 3
Figure 3
Levels of circulating Treg cells with treatment. A, Gating strategy for Treg cells, CD4 Teff cells and CD8 T cells. B and C, Time course of percentage of Treg cells of total lymphocytes and absolute counts of Treg cells, respectively, for accessed patients at week 0 (pre-treatment), week 4 (cycle 1) and week 8 (cycle 2). Connected dots show time course of the same patient. D and E, Box plots of percentage of Treg cells of total lymphocytes and absolute counts of Treg cells, respectively, for long-term (L) and short-term (S) survivors at each time point. Whiskers show minimum and maximum levels. * p-value < 0.05, ** p-value < 0.01, *** p-valye < 0.001.
Figure 4
Figure 4
PD-1 expression of CD4 Teff cells and CD8 T cells. A, Flow cytometry was used to assess PD-1 expression by CD4 Teff cells and CD8 T cells. Percentage of PD-1+ cells in antibody-stained sample was gated based on isotype-matched controls. Shaded histograms denote isotype controls; open histograms denote stained samples. B and C, Time course of percentages of CD4 Teff and CD8 T cells that express PD-1 respectively. Connected dots show time course of the same patient. D and E, Time course of absolute counts of CD4 Teff and CD8 T cells that express PD-1 respectively. F and G, Box plots of percentage of CD4 Teff and CD8 T cells that express PD-1, respectively, for long-term (L) and short-term (S) survivors at each time point. H and I, Box plots of absolute counts of CD4 Teff and CD8 T cells that express PD-1, respectively, for long-term (L) and short-term (S) survivors at each time point. Whiskers show minimum and maximum levels. * p-value < 0.05, ** p-value < 0.01, *** p-value < 0.001.

References

    1. Walunas TL, Lenschow DJ, Bakker CY, Linsley PS, Freeman GJ, Green JM, et al. CTLA-4 can function as a negative regulator of T cell activation. Immunity. 1994;1:405–13. - PubMed
    1. Krummel MF, Allison JP. CD28 and CTLA-4 have opposing effects on the response of T cells to stimulation. J Exp Med. 1995;182:459–65. - PMC - PubMed
    1. Leach DR, Krummel MF, Allison JP. Enhancement of antitumor immunity by CTLA-4 blockade. Science. 1996;271:1734–6. - PubMed
    1. Kwon ED, Hurwitz AA, Foster BA, Madias C, Feldhaus AL, Greenberg NM, et al. Manipulation of T cell costimulatory and inhibitory signals for immunotherapy of prostate cancer. Proc Natl Acad Sci U S A. 1997;94:8099–103. - PMC - PubMed
    1. http://www.accessdata.fda.gov/drugsatfda_docs/label/2011/125377s0000lbl.pdf.

Publication types

MeSH terms