. 2015 May 13:13:157.
doi: 10.1186/s12967-015-0513-1.

Development of a novel IGRA assay to test T cell responsiveness to HBV antigens in whole blood of chronic Hepatitis B patients

Affiliations

Development of a novel IGRA assay to test T cell responsiveness to HBV antigens in whole blood of chronic Hepatitis B patients

Werner Dammermann et al. J Transl Med. .

Abstract

Background: Interferon gamma release assays (IGRA) have been developed to support easy and fast diagnosis of diseases like tuberculosis, and CMV in transplant patients. IGRAs focus on cellular immunity especially memory T cells and thus also allow rapid screening prior to complex flow cytometric testing. Here, we describe a novel, sensitive whole blood based cytokine release assay capable of assessing T cell responsiveness to HBV antigens in Hepatitis B patients and assessing hepatitis B vaccination status in healthy individuals.

Methods: Seventy two chronic Hepatitis B patients (CHB), 8 acute hepatitis B patients (AHB) and 80 healthy controls (HC) were tested by ELISA for IFNγ- and IL2-secretion in whole blood after challenge with synthetic peptide libraries of hepatitis B core antigen (HBcAg) or hepatitis B surface antigen (HBsAg).

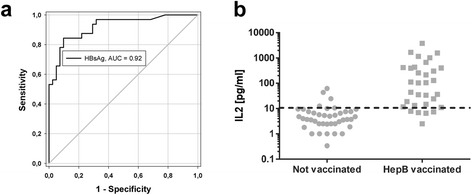
Results: The developed IGRA test reliably differentiated between Hepatitis B patients, vaccinees and unvaccinated healthy controls. Treatment naïve and treated CHB patients showed a weaker IFNγ response to HBcAg (16 ± 5 and 35 ± 28 pg/ml, respectively) compared to the AHB group (82 ± 39 pg/ml), whereas HC remained unresponsive (6 ± 1 pg/ml). IL2 levels after HBcAg challenge were also higher in the AHB group compared to naive and treated CHB as well as HC (47 ± 21 vs. 12 ± 3, 15 ± 10 and 12 ± 9 pg/ml, respectively). HBsAg stimulation led to increased IFNγ and IL2 levels in the AHB group (33 ± 12 and 22 ± 12 pg/ml) and even higher levels in HC due to a high hepatitis B vaccination rate (41 ± 10 and 167 ± 58 pg/ml). Naive and treated CHB patients developed no or only weaker IFNγ or IL2 responses to HBsAg (5 ± 2 and 12 ± 7 pg/ml, for naive CHB, 12 ± 10 and 18 ± 15 pg/ml, for treated CHB). For HC, IL2 release after HBsAg stimulation depicted hepatitis B vaccination status with a diagnostic sensitivity and specificity of 85 % and 90 %.

Conclusion: Our novel whole blood based cytokine release assay constitutes an easy and robust tool for screening HBV specific cellular immunity as alternative to flow cytometry or ELISPOT assays.


Figures

Fig. 1
Fig. 1
HC and hepatitis B patients show comparable and distinct IFNγ and IL2 responses in whole blood towards control stimulations with SEB and CEFT. n = 80 HC, n = 8 AHB patients, n = 40 NUC treatment naive CHB patients and n = 32 NUC treated patients, for each tested control antigen. Every HC or patient was tested against buffer control, SEB and CEFT. (a) IFNγ, (b) IL2. Negative control values were deducted from the antigen induced responses. Lower limit of detection (Background + 3x S.D.) was at 2 – 5 pg/ml for IFNγ and IL2. All values are given as mean concentration pg/ml ± S.E.M. ANOVA and Tamhane T2 post hoc tests, following symbol pinpoints significant differences: *. One symbol equals 0.05, two symbols 0.01, three symbols 0.001
Fig. 2
Fig. 2
Synthetic HBcAg peptides elicit weak IFNγ and IL2 responses during HBV-specific T cell stimulation in whole blood of CHB patients. n = 80 HC, n = 8 AHB patients, n = 40 NUC treatment naive CHB patients and n = 32 NUC treated patients, for each tested HBV antigen. Every HC or patient was tested against HBV peptide pools specific for HBcAg and HBsAg. (a) IFNγ, (b) IL2. Negative control values were deducted from the peptide induced responses. Lower limit of detection (Background + 3x S.D.) was at 2 – 5 pg/ml for IFNγ and IL2. All values are given as mean concentration pg/ml ± S.E.M. ANOVA and Tamhane T2 post hoc tests, following symbol pinpoints significant differences: *. One symbol equals 0.05, two symbols 0.01, three symbols 0.001
Fig. 3
Fig. 3
HBeAg + CHB patients show weaker cytokine responses against HBcAg and HBsAg than HBeAg- CHB patients. (a) – (d) n = 40 NUC treatment naïve CHB patients with n = 6 HBeAg + and n = 34 HBeAg-. n = 32 NUC treated CHB patients, with n = 6 HBeAg + and n = 26 HBeAg-. (e) – (h) n = 40 NUC treatment naïve CHB patients with n = 10 HBV-DNA ≤50 IU/ml and n = 30 HBV-DNA >50 IU/ml. n = 32 NUC treated CHB patients, with n = 22 HBV-DNA ≤50 IU/ml and n = 10 HBV-DNA >50 IU/ml. Every patient was tested against HBV antigens HBcAg and HBsAg. (a), (b), (e) and (f) IFNγ, (c), (d), (g) and (h) IL2, respectively. Negative control values were deducted from the antigen induced responses. Lower limit of detection (background + 3x S.D.) was at 2 – 5 pg/ml for IFNγ and IL2. All values are given as mean concentration pg/ml ± S.E.M. Unpaired t-test, following symbol pinpoints significant differences: *. One symbol equals 0.05, two symbols 0.01, three symbols 0.001, n.s. not significant
Fig. 4
Fig. 4
NUC treated CHB patients show comparable cytokine responses to HBcAg and HBsAg compared to treatment naïve CHB patients in whole blood. Lower limit of detection (Background + 3x S.D.) was at 2 – 5 pg/ml for IFNγ and IL2. n = 72 CHB patients, whereas n = 40 NUC treatment naive and n = 32 NUC treated. Every patient was tested against HBV antigens HBcAg and HBsAg. (a) IFNγ, (b) IL2. Negative control values were deducted from the antigen induced responses. All values are given as mean concentration pg/ml ± S.E.M. Unpaired t-test, following symbol pinpoints significant differences: *. One symbol equals 0.05, two symbols 0.01, three symbols 0.001, n.s. not significant
Fig. 5
Fig. 5
IL2 responses to HBsAg in HC correlate with hepatitis B vaccination status. (a) Receiver-operating-characteristic (ROC) curve. AUC, area under the curve. (b) Scatter plot of IL2 release of HepB vaccinated and not vaccinated HC after HBsAg stimulation of whole blood. Negative control values were deducted from the antigen induced responses. Dotted line indicates IL2 cut-off at 11 pg/ml. n = 74 HC, whereas n = 33 were anti-HBs positive and n = 41 anti-HBs negative
Fig. 6
Fig. 6
Anti-HBs titers and strength of IL2 response do not correlate in hepatitis B vaccinated HC. Scatter plot of IL2 release of HepB vaccinated HC after HBsAg stimulation vs. anti-HBs titers. Negative control values were deducted from the antigen induced responses. Continuous line indicates linear regression and Pearson correlation. R2: coefficient of determination

References

    1. Ott JJ, Stevens GA, Groeger J, Wiersma ST. Global epidemiology of hepatitis B virus infection: new estimates of age-specific HBsAg seroprevalence and endemicity. Vaccine. 2012;30(12):2212–9. doi: 10.1016/j.vaccine.2011.12.116. - DOI - PubMed
    1. Huang LM, Lu CY, Chen DS. Hepatitis B virus infection, its sequelae, and prevention by vaccination. Curr Opin Immunol. 2011;23(2):237–43. doi: 10.1016/j.coi.2010.12.013. - DOI - PubMed
    1. Liu J, Kosinska A, Lu M, Roggendorf M. New therapeutic vaccination strategies for the treatment of chronic hepatitis B. Virol Sin. 2014;29(1):10–6. doi: 10.1007/s12250-014-3410-5. - DOI - PMC - PubMed
    1. Boni C, Penna A, Bertoletti A, Lamonaca V, Rapti I, Missale G, et al. Transient restoration of anti-viral T cell responses induced by lamivudine therapy in chronic hepatitis B. J Hepatol. 2003;39(4):595–605. doi: 10.1016/S0168-8278(03)00292-7. - DOI - PubMed
    1. Boni C, Laccabue D, Lampertico P, Giuberti T, Vigano M, Schivazappa S, et al. Restored function of HBV-Specific T Cells after Long-term effective therapy with Nucleos(t)ide Analogues. Gastroenterology. 2012;143(4):963–73. doi: 10.1053/j.gastro.2012.07.014. - DOI - PubMed

MeSH terms