. 2015 May 12;6(3):e00306-15.
doi: 10.1128/mBio.00306-15.

Rapid quantification of mutant fitness in diverse bacteria by sequencing randomly bar-coded transposons

Affiliations

Rapid quantification of mutant fitness in diverse bacteria by sequencing randomly bar-coded transposons

Kelly M Wetmore et al. mBio. .

Abstract

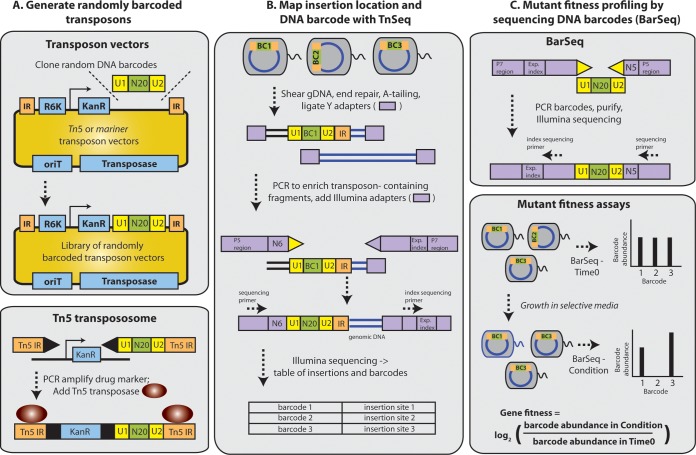
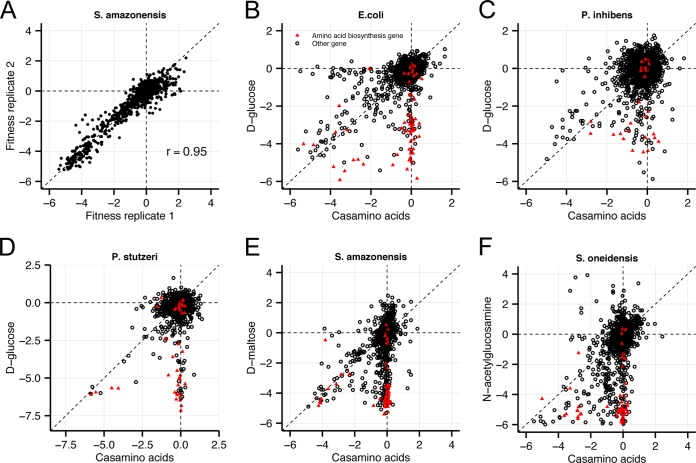
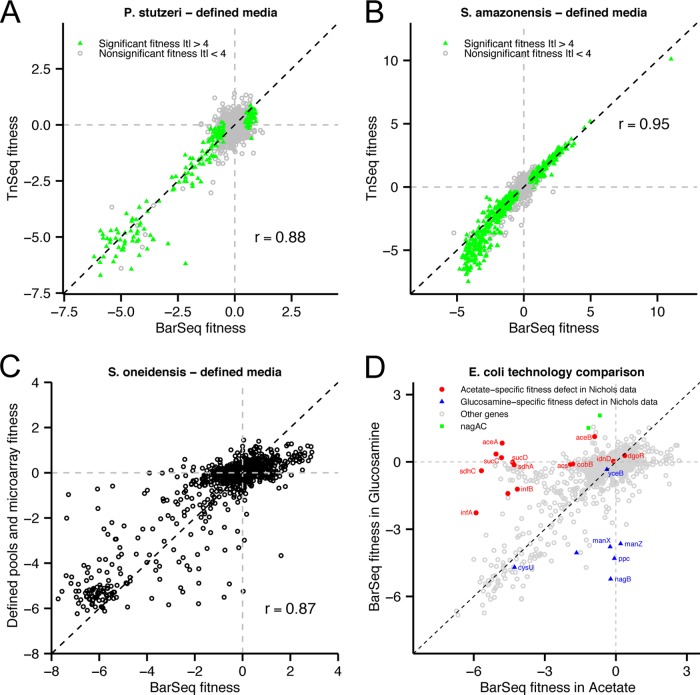
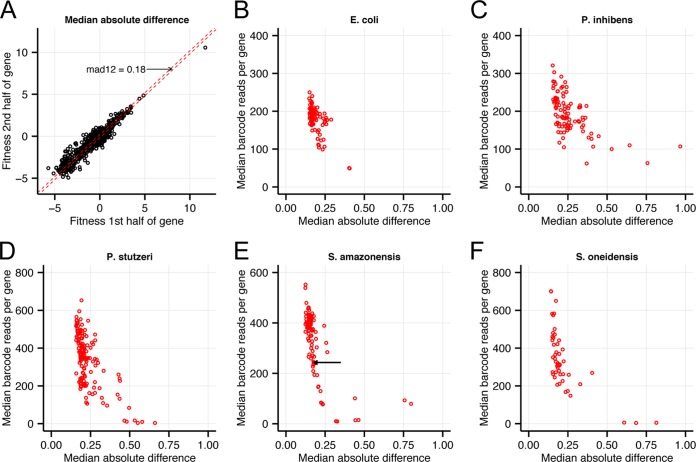
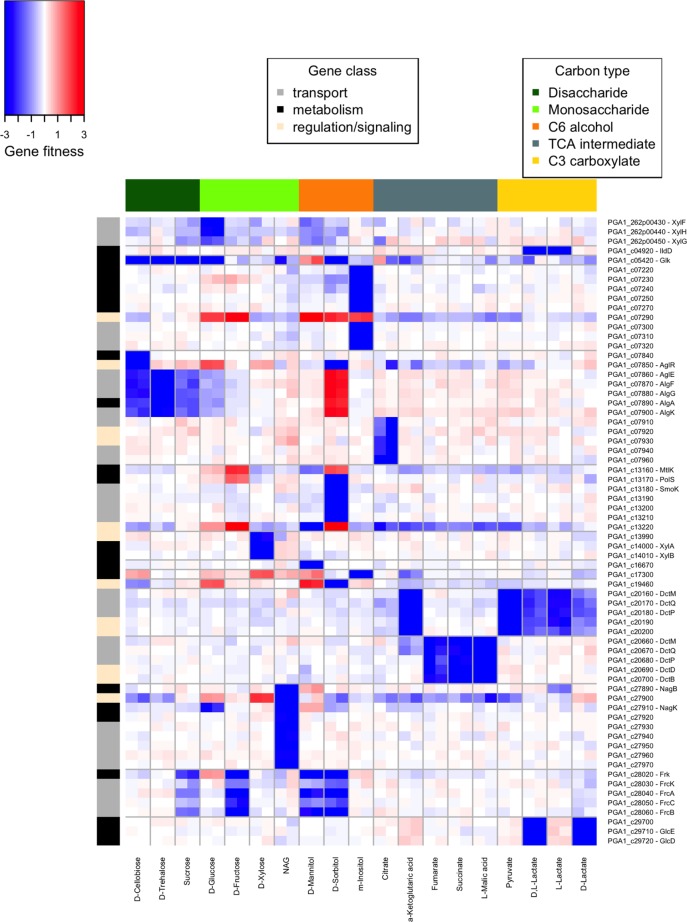
Transposon mutagenesis with next-generation sequencing (TnSeq) is a powerful approach to annotate gene function in bacteria, but existing protocols for TnSeq require laborious preparation of every sample before sequencing. Thus, the existing protocols are not amenable to the throughput necessary to identify phenotypes and functions for the majority of genes in diverse bacteria. Here, we present a method, random bar code transposon-site sequencing (RB-TnSeq), which increases the throughput of mutant fitness profiling by incorporating random DNA bar codes into Tn5 and mariner transposons and by using bar code sequencing (BarSeq) to assay mutant fitness. RB-TnSeq can be used with any transposon, and TnSeq is performed once per organism instead of once per sample. Each BarSeq assay requires only a simple PCR, and 48 to 96 samples can be sequenced on one lane of an Illumina HiSeq system. We demonstrate the reproducibility and biological significance of RB-TnSeq with Escherichia coli, Phaeobacter inhibens, Pseudomonas stutzeri, Shewanella amazonensis, and Shewanella oneidensis. To demonstrate the increased throughput of RB-TnSeq, we performed 387 successful genome-wide mutant fitness assays representing 130 different bacterium-carbon source combinations and identified 5,196 genes with significant phenotypes across the five bacteria. In P. inhibens, we used our mutant fitness data to identify genes important for the utilization of diverse carbon substrates, including a putative d-mannose isomerase that is required for mannitol catabolism. RB-TnSeq will enable the cost-effective functional annotation of diverse bacteria using mutant fitness profiling.

Importance: A large challenge in microbiology is the functional assessment of the millions of uncharacterized genes identified by genome sequencing. Transposon mutagenesis coupled to next-generation sequencing (TnSeq) is a powerful approach to assign phenotypes and functions to genes. However, the current strategies for TnSeq are too laborious to be applied to hundreds of experimental conditions across multiple bacteria. Here, we describe an approach, random bar code transposon-site sequencing (RB-TnSeq), which greatly simplifies the measurement of gene fitness by using bar code sequencing (BarSeq) to monitor the abundance of mutants. We performed 387 genome-wide fitness assays across five bacteria and identified phenotypes for over 5,000 genes. RB-TnSeq can be applied to diverse bacteria and is a powerful tool to annotate uncharacterized genes using phenotype data.


Figures

FIG 1
FIG 1
Overview of RB-TnSeq. (A) (Top) We converted both Tn5 and mariner transposon delivery vectors into RB-TnSeq vectors by cloning millions of unique DNA bar codes (N20) flanked by common PCR priming sites (U1 and U2) near the edge of the transposon’s inverted repeat (IR). (Bottom) We generated a randomly bar-coded transpososome by first PCR amplifying the kanamycin resistance gene with oligonucleotides containing Tn5 IRs and the random DNA bar code region and then adding Tn5 transposase. All three systems can be used to mutagenize bacteria by electroporation or (for Tn5 and mariner vectors) conjugation. Regardless of system or delivery method, the goal is to generate a large transposon mutant population such that each strain contains a unique DNA bar code. (B) A randomly bar-coded transposon mutant library is characterized using a protocol similar to HITS (8) or TraDIS (7). Here, we refer to this protocol generically as “TnSeq.” In TnSeq, genomic DNA is sheared, end repaired, and ligated with Illumina Y adapters. Transposon-containing DNA fragments are enriched by PCR with one primer specific to the Y adapter and a second primer specific to the transposon. Both the DNA bar code and the transposon insertion site are identified in a single 150-nucleotide Illumina sequencing read. The TnSeq results are a table of bar codes and associated transposon insertion locations. (C) (Top) In BarSeq, the DNA bar codes are PCR amplified using oligonucleotides that bind the common U1 and U2 regions. Both oligonucleotides contain adapter sequences for Illumina sequencing. One of the oligonucleotides contains an experiment index and enables multiplexing of multiple BarSeq experiments on a single lane of Illumina sequencing. (Bottom) Competitive mutant fitness assays are performed by comparing the abundance of the DNA bar codes with BarSeq before (time zero) and after (condition) selective growth. In this simple example, the gene associated with bar code 2 has reduced fitness; the gene associated with bar code 3 has enhanced fitness.
FIG 2
FIG 2
Validation of BarSeq fitness data. (A) Comparison of gene fitness for two biological replicates of S. amazonensis SB2B grown in defined medium with d-maltose as a carbon source. (B to F) Comparison of gene fitness in a defined medium with Casamino Acids (x axis) or a single carbon source (y axis) for E. coli (B), P. inhibens (C), P. stutzeri (D), S. amazonensis (E), and S. oneidensis (F). Genes annotated with the functional role “amino acid biosynthesis” by TIGRFAMs (38) are marked as red triangles.
FIG 3
FIG 3
Comparison of RB-TnSeq to other technologies. (A) Comparison of gene fitness for P. stutzeri grown in a defined medium with glucose as determined with BarSeq (x axis) or sequencing the transposon-genome insertion junctions (TnSeq; y axis), starting from the same samples of genomic DNA. Genes marked in green have statistically significant phenotypes as determined by BarSeq. The dashed black line marks x = y. (B) Same as panel A for S. amazonensis grown in a defined medium with d,l-lactate. (C) Comparison of S. oneidensis gene fitness in defined medium with l-lactate calculated from BarSeq (x axis) and previously described data that used mutant libraries with defined DNA bar codes and microarrays to assay strain abundance (y axis) (2). The dashed black line marks x = y. (D) BarSeq fitness data for E. coli genes grown in acetate (x axis) or glucosamine (y axis) as the sole source of carbon. Genes marked in red have an acetate-specific fitness defect while those marked in blue have a glucosamine-specific fitness defect in the Nichols et al. data set, with thresholds of S < −5 and S > −2 (4).
FIG 4
FIG 4
Consistency of fitness values versus number of reads. (A) Consistency of fitness data between the two halves of each gene (10 to 50% or 50 to 90%), for Shewanella amazonensis SB2B growing in a defined medium with d,l-lactate as the carbon source. To summarize this plot, we computed the median of the absolute difference (mad12) between the two values. Half of the genes are between the dashed lines, which show x = y − mad12 and x = y + mad12. (B to F) Consistency of fitness data as measured by mad12 (x axis) versus number of reads for median gene (y axis), with a separate panel for each organism and a point for each genome-wide fitness experiment. In panel E, the arrow highlights the experiment shown in panel A. Control experiments (time zero) are not included in the plots.
FIG 5
FIG 5
Carbon utilization genes of P. inhibens. Heat map of gene fitness values for select P. inhibens genes (y axis) with significant phenotypes during growth in defined medium with one or more carbon sources (x axis). For illustration purposes, genes with fitness values of less than −3 were set to −3. Similarly, genes with fitness values of greater than 3 were set to 3. Operons and other chromosomally clustered genes are split by horizontal gray lines.

References

    1. Deutschbauer A, Price MN, Wetmore KM, Tarjan DR, Xu Z, Shao W, Leon D, Arkin AP, Skerker JM. 2014. Towards an informative mutant phenotype for every bacterial gene. J Bacteriol 196:3643–3655. doi:10.1128/JB.01836-14. - DOI - PMC - PubMed
    1. Deutschbauer A, Price MN, Wetmore KM, Shao W, Baumohl JK, Xu Z, Nguyen M, Tamse R, Davis RW, Arkin AP. 2011. Evidence-based annotation of gene function in Shewanella oneidensis MR-1 using genome-wide fitness profiling across 121 conditions. PLoS Genet 7:e1002385. doi:10.1371/journal.pgen.1002385. - DOI - PMC - PubMed
    1. Kuehl JV, Price MN, Ray J, Wetmore KM, Esquivel Z, Kazakov AE, Nguyen M, Kuehn R, Davis RW, Hazen TC, Arkin AP, Deutschbauer A. 2014. Functional genomics with a comprehensive library of transposon mutants for the sulfate-reducing bacterium Desulfovibrio alaskensis G20. mBio 5(3):e01041-14. doi:10.1128/mBio.01041-14. - DOI - PMC - PubMed
    1. Nichols RJ, Sen S, Choo YJ, Beltrao P, Zietek M, Chaba R, Lee S, Kazmierczak KM, Lee KJ, Wong A, Shales M, Lovett S, Winkler ME, Krogan NJ, Typas A, Gross CA. 2011. Phenotypic landscape of a bacterial cell. Cell 144:143–156. doi:10.1016/j.cell.2010.11.052. - DOI - PMC - PubMed
    1. Van Opijnen T, Camilli A. 2013. Transposon insertion sequencing: a new tool for systems-level analysis of microorganisms. Nat Rev Microbiol 11:435–442. doi:10.1038/nrmicro3033. - DOI - PMC - PubMed

Publication types

Substances