. 2015 Jul;36(7):800-10.
doi: 10.1093/carcin/bgv064. Epub 2015 May 12.

Survival of skin cancer stem cells requires the Ezh2 polycomb group protein

Affiliations

Survival of skin cancer stem cells requires the Ezh2 polycomb group protein

Gautam Adhikary et al. Carcinogenesis. 2015 Jul.

Abstract

Polycomb group proteins, including Ezh2, are important candidate stem cell maintenance proteins in epidermal squamous cell carcinoma. We previously showed that epidermal cancer stem cells (ECS cells) represent a minority of cells in tumors, are highly enriched in Ezh2 and drive aggressive tumor formation. We now show that Ezh2 is required for ECS cell survival, migration, invasion and tumor formation and that this is associated with increased histone H3 trimethylation on lysine 27, a mark of Ezh2 action. We also show that Ezh2 knockdown or treatment with Ezh2 inhibitors, GSK126 or EPZ-6438, reduces Ezh2 level and activity, leading to reduced ECS cell spheroid formation, migration, invasion and tumor growth. These studies indicate that epidermal squamous cell carcinoma cells contain a subpopulation of cancer stem (tumor-initiating) cells that are enriched in Ezh2, that Ezh2 is required for optimal ECS cell survival and tumor formation and that treatment with Ezh2 inhibitors may be a strategy for reducing ECS cell survival and suppressing tumor formation.


Figures

Figure 1.
Figure 1.
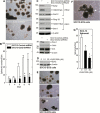
Ezh2 expression is required for spheroid formation. (A) Ezh2 knockdown and control cell lines were plated at 40 000 cells per 9.5cm2 dish in non-attachment plates and grown in spheroid medium. After 10 days, the spheroids were photographed. (B) Ezh2 knockdown cells fail to efficiently form spheroids. Cells were plated as above and spheroid number was monitored at 0–10 days. The values are mean ± SEM, n = 3. The asterisks indicate a significant difference between Ezh2-shRNA and control-shRNA cell spheroid formation (P < 0.01). (C) Level of Ezh2 in control and Ezh2 knockdown cells. Control and Ezh2 knockdown cells were grown for 10 days in spheroid-selection medium and total cell extracts were prepared for immunoblot detection of the indicated proteins. Similar results were observed in each of three independent experiments. (D) Treatment with Ezh2 inhibitor reduces spheroid survival. SCC-13 cells were seeded at 40 000 cells in 9.5cm2 non-attachment plates and grown as spheroids for 8 days before addition of the indicated concentration of JQ-EZ-005. After treatment with JQ-EZ-005 for 48h, the extracts were prepared for immunoblot detection of the indicated proteins. (E) The spheroids were photographed after 48h of treatment with JQ-EZ-005. Bars = 125 μm. The arrow indicates spheroids that are fragmenting and panel (F) presents an enlarged image of this spheroid. (G) Spheroid number was determined after treatment with JQ-EZ-005 for 48h as outlined above. The values are mean ± SEM, n = 3 and the asterisks indicate a significant difference, P < 0.005.
Figure 2.
Figure 2.
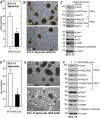
GSK126 and EPZ-6438 reduce spheroid formation. SCC-13 cells were seeded at 40 000 cells in 9.5cm2 non-attachment plates and grown as spheroids for 8 days before treatment for 3 days with the indicated concentration of GSK126 or EPZ-6438. (A and D) Spheroid number was determined at 3 days after initiation of inhibitor treatment. The values are mean ± SEM, n = 3 and the asterisks indicate a significant difference, P < 0.005. (B and E) Images were collected at 3 days after initiation of inhibitor treatment. The arrows indicated fragmented spheroids. Increasing the time of treatment with EPZ-6438 increases the number of fragmented spheroids (Supplementary Figure 3S, available at Carcinogenesis Online). (C and F) Extracts were prepared for immunoblot detection of the indicated proteins at 3 days after initiation of inhibitor treatment.
Figure 3.
Figure 3.
Impact of Ezh2 knockdown on ECS cell migration and invasion. (A) Ezh2 knockdown reduces ability of spheroid-selected SCC-13 cells to migrate through matrigel. SCC13-Ezh2-shRNA3 and SCC13-Control-shRNA cells were plated into Millicell chambers (0.8 μm pores) coated with matrigel and after 18h, the cells that had migrated to the destination chamber were DAPI stained and counted. The values are mean ± SEM, n = 3 and the asterisk indicates a significant difference, P < 0.005. (B) Ezh2 is required for Matrigel invasion. Image shows the number of cells that had migrated through the Matrigel at 18h. Cells were stained with DAPI and visualized by confocal microscopy. Bars = 40 μm. The wound width values at 6h are as follows: control = 20±5 and Ezh2-shRNA = 101±8 μm (mean ± SD, n = 10). (C) Ezh2 knockdown impairs the ability of ECS cells to repair a scratch wound. The indicated cell lines were grown in spheroid-selection conditions and then permitted to attach and form a confluent monolayer on conventional culture dishes before equal sized ‘wounds’ were created by scraping cells from the dish. The cells were photographed at 0, 3, 6 and 18h as the cells migrated to fill the wound. Similar results were observed in each of three separate experiments. (D and E) Ezh2 inhibitors reduce cell invasion. ECS cells, derived from spheroid cultures, were plated into Millicell chambers (0.8 μm pores) coated with matrigel in the presence of 0 or 2 µM of the indicated Ezh2 inhibitor. At 18h, the cells that had migrated to the destination chamber were DAPI stained and counted. The values are mean ± SEM, n = 3 and the asterisks indicate a significant difference from control, P < 0.001. (F) ECS cells, derived from spheroid cultures, were plated at confluent density on conventional culture dishes and scratch wounds were created using a pipette tip. After attachment, the cells were then treated with the indicated inhibitor, which was initiated 30min before wounding and wound closure was assessed at 0h (time of wounding) and at 6 and 18h. The wound width values are at 6h are as follows: control = 6±2, EPZ-6438 = 90±6 and GSK-126 = 105±7 μm (mean ± SD, n = 10).
Figure 4.
Figure 4.
Ezh2 is required for tumor formation. (A) Monolayer-derived SCC-13 cells were injected into the two front flanks in NSG mice and at 4 weeks tumor size was measured. The values are mean ± SEM, n = 3. The asterisks indicate a significant reduction in tumor formation for Ezh2 knockdown cells compared with control (p < 0.001). (B) Monolayer-derived SCC-13 cells (1 million) were injected into NSG mice, and tumor growth was monitored at 2, 3 and 4 weeks postinjection. The values are mean ± SEM, n = 3. The asterisks indicate significant reduction in tumor formation for Ezh2 knockdown cells compared with control (P < 0.001). (C) Extracts were prepared from 4 week tumors derived following injection of 1 million tumor cells and the indicated proteins were detected by immunoblot. The findings are representative of three separate experiments. (D) GSK126 treatment suppresses tumor formation. ECS cells (0.1 million) were injected into each front flank in NSG mice and after 24h, GSK126 treatment was initiated by intraperitoneal injection of 0.2ml of solution to deliver 0–50mg GSK126 per kg body weight (42). Treatment was administered on alternate days (42). At 4 weeks, the tumors were measured using calipers (6). The values are mean ± SEM, n = 6 and the asterisks indicate a significant reduction in tumor formation for GSK126-treated cells compared with control, P < 0.001. (E) Tumor morphology. ECS cells (0.1 million) were injected into each front flank in NSG mice and after 24h, GSK126 treatment was initiated at 50mg/kg body weight on alternate days. The tumors were harvested and photographed at 4 weeks. (F) Ezh2 level and activity in tumors treated with GSK126. Extracts were prepared from 4 week tumors for immunoblot detection of the indicated proteins.
Figure 5.
Figure 5.
Ezh2 is required for HaCaT-derived ECS cell spheroid formation and invasion. Ezh2 knockdown and control cell lines were plated at 40 000 cells per 9.5cm2 dish in non-attachment plates and grown in spheroid medium. (A) Ezh2 knockdown cells fail to efficiently form spheroids. ECS cells were plated as above and spheroid number was monitored at 10 days. The values are mean ± SEM, n = 3. The asterisk indicates a significant difference between control-shRNA and Ezh2-shRNA cell spheroid formation (P < 0.001). (B) Photographs of spheroids. (C) Level of Ezh2 in control and Ezh2 knockdown cells. Control and Ezh2 knockdown cells were grown for 10 days in spheroid-selection medium and total cell extracts were prepared for immunoblot detection of the indicated proteins. Similar results were observed in each of three independent experiments. (D) Ezh2 knockdown reduces ability of HaCaT-derived ECS cells to migrate through matrigel. HaCaT-control-shRNA and HaCaT-Ezh2-shRNA3 cells were plated into Millicell chambers (0.8 μm pores) coated with matrigel and after 18h, the cells that had migrated to the destination chamber were DAPI stained and counted. The values are mean ± SEM, n = 3 and the asterisk indicates a significant difference, P < 0.001. (E) Ezh2 knockdown impairs the ability of spheroid-selected cells to repair a scratch wound. The indicated cell lines were grown in spheroid-selection conditions and then permitted to attach and form a confluent monolayer on conventional culture dishes before equal sized ‘wounds’ were created by scraping cells from the dish. The cells were photographed at 0, 3, 6 and 18h as the cells migrated to fill the wound. Bar = 25 μm. The wound width values at 6h are as follows: control-shRNA = 51±8 and Ezh2-shRNA = 122±8 μm (mean ± SD, n = 10).
Figure 6.
Figure 6.
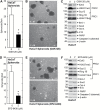
GSK126 and EPZ-6438 reduce HaCaT cell spheroid formation. HaCaT cells were seeded at 40 000 cells in 9.5cm2 non-attachment plates and grown as spheroids for 8 days before 3 day treatment with the indicated concentration of GSK126 or EPZ-6438. (A and D) Spheroid number was determined at day 3 after initiation of inhibitor treatment. The values are mean ± SEM, n = 3 and the asterisks indicate a significant difference, P < 0.01. (B and E) Spheroid images were collected at 3 days after initiation of inhibitor treatment. (C and F) Extracts were prepared for immunoblot detection of the indicated proteins at 3 days after initiation of inhibitor treatment.

References

    1. Gupta S., et al. (2002) Chemoprevention of skin cancer: current status and future prospects. Cancer Metastasis Rev., 21, 363–380. - PubMed
    1. Alam M., et al. (2001) Cutaneous squamous-cell carcinoma. N. Engl. J. Med., 344, 975–983. - PubMed
    1. Cranmer L.D., et al. (2010) Treatment of unresectable and metastatic cutaneous squamous cell carcinoma. Oncologist, 15, 1320–1328. - PMC - PubMed
    1. Pincelli C., et al. (2010) Keratinocyte stem cells: friends and foes. J. Cell. Physiol., 225, 310–315. - PubMed
    1. Eckert R.L., et al. (2014) Transglutaminase regulation of cell function. Physiol. Rev., 94, 383–417. - PMC - PubMed

Publication types

MeSH terms