. 2015 Jun 23;43(11):5647-63.
doi: 10.1093/nar/gkv410. Epub 2015 May 12.

Structural and sequencing analysis of local target DNA recognition by MLV integrase

Affiliations

Structural and sequencing analysis of local target DNA recognition by MLV integrase

Sriram Aiyer et al. Nucleic Acids Res. .

Abstract

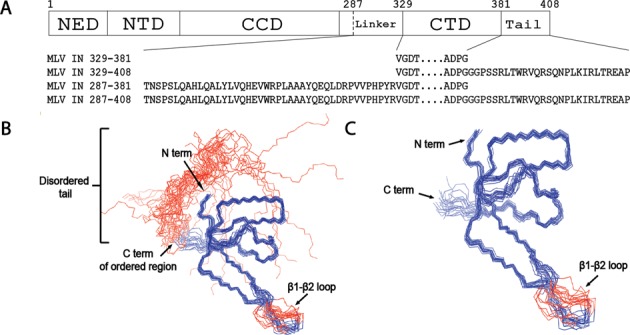
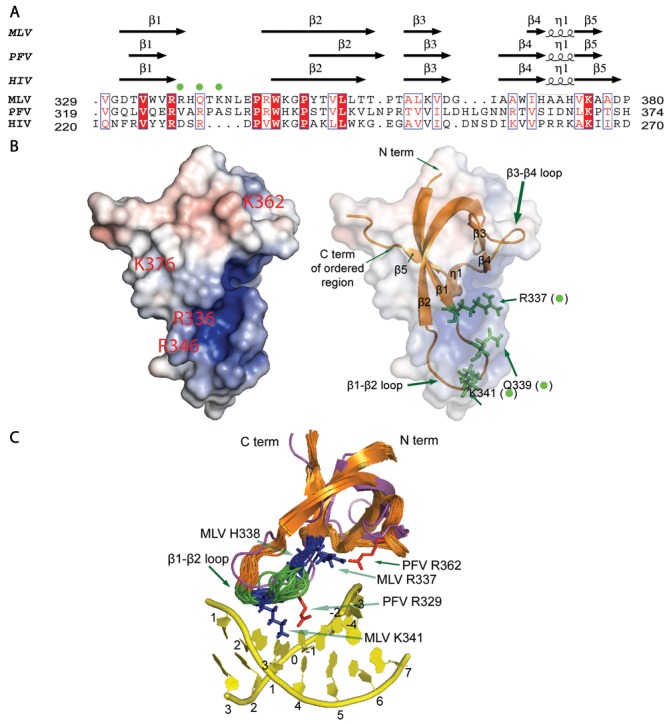
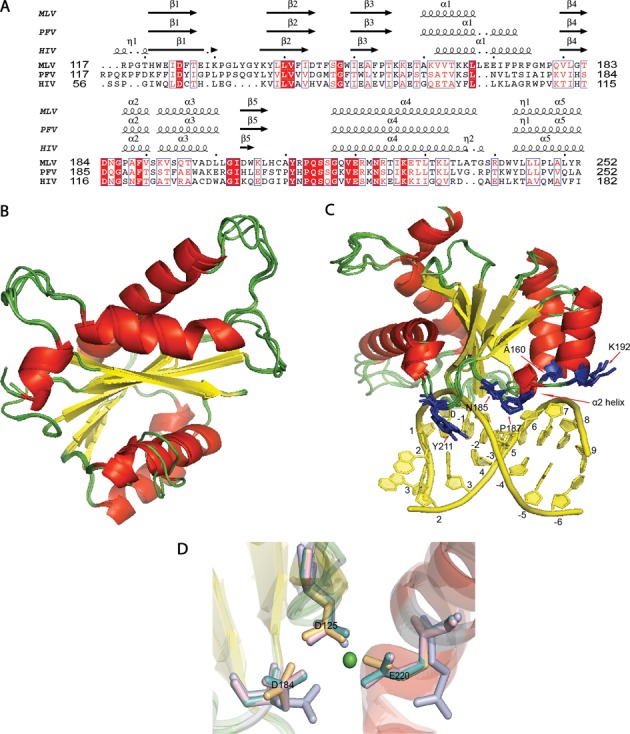
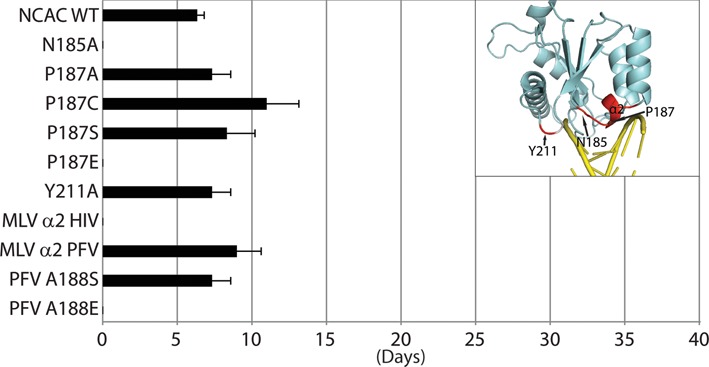
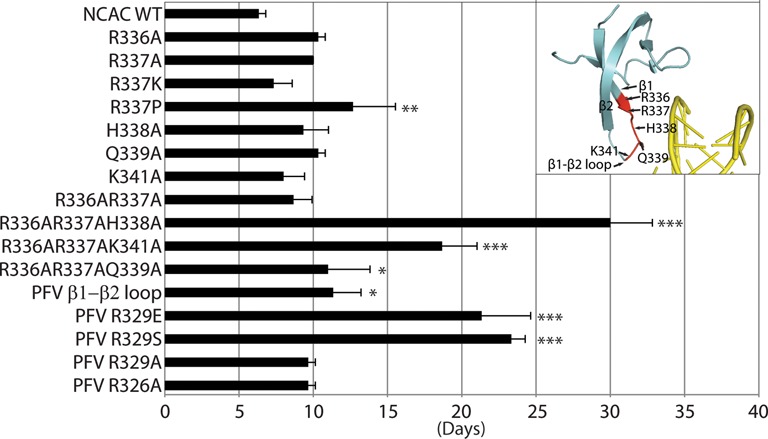
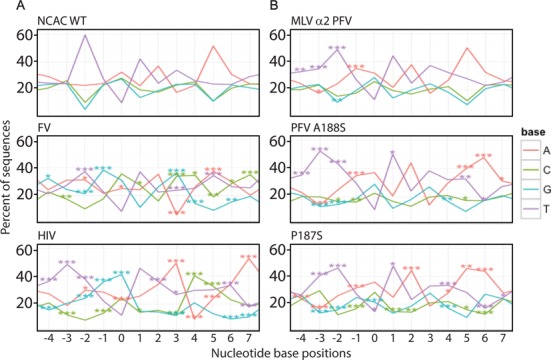
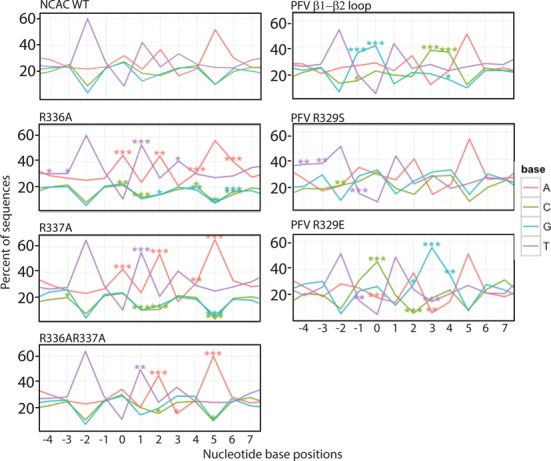
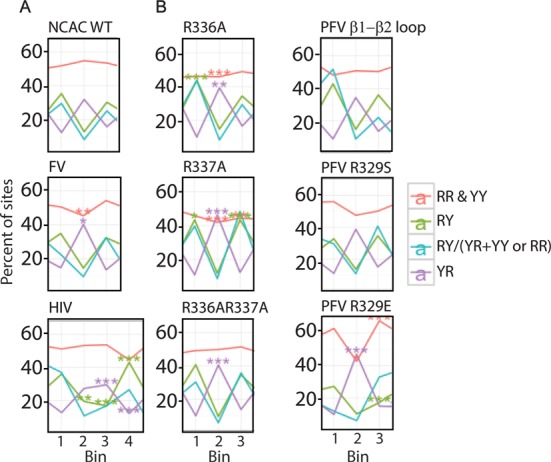
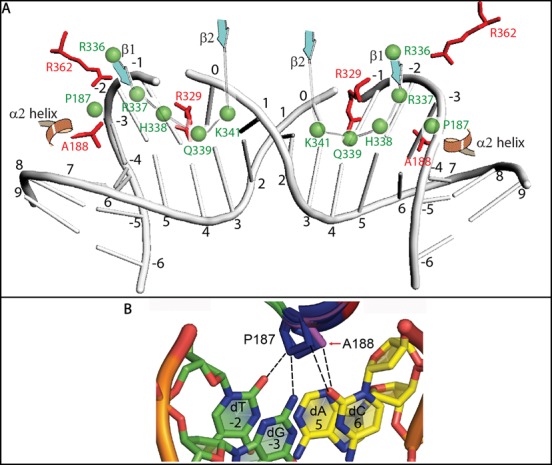
Target-site selection by retroviral integrase (IN) proteins profoundly affects viral pathogenesis. We describe the solution nuclear magnetic resonance structure of the Moloney murine leukemia virus IN (M-MLV) C-terminal domain (CTD) and a structural homology model of the catalytic core domain (CCD). In solution, the isolated MLV IN CTD adopts an SH3 domain fold flanked by a C-terminal unstructured tail. We generated a concordant MLV IN CCD structural model using SWISS-MODEL, MMM-tree and I-TASSER. Using the X-ray crystal structure of the prototype foamy virus IN target capture complex together with our MLV domain structures, residues within the CCD α2 helical region and the CTD β1-β2 loop were predicted to bind target DNA. The role of these residues was analyzed in vivo through point mutants and motif interchanges. Viable viruses with substitutions at the IN CCD α2 helical region and the CTD β1-β2 loop were tested for effects on integration target site selection. Next-generation sequencing and analysis of integration target sequences indicate that the CCD α2 helical region, in particular P187, interacts with the sequences distal to the scissile bonds whereas the CTD β1-β2 loop binds to residues proximal to it. These findings validate our structural model and disclose IN-DNA interactions relevant to target site selection.


Figures

Figure 1.
Figure 1.
MLV IN CTD. (A) Schematic of MLV IN. The domain boundaries NED, NTD, CCD and CTD are indicated with solid vertical lines. Residue 287, previously defined as the CCD/CTD boundary (51), is indicated with a dashed line. Residues 382–408 constitute the C-terminal tail. The sequences of the four MLV IN CTD constructs tested are indicated. (B) The Cα backbone trace of IN 329–408. The backbone (N, Cα and C′) atomic coordinates for the 20 lowest energy conformers, which represent the solution NMR structure, are shown with blue lines. The N- and the C-termini, along with the β1-β2 loop, are labeled. The apparently flexible disordered C-terminal tail region (residues 382–408) is represented with red lines. A stretch of three amino-acid residues within the β1-β2 loop (residues 339–341) is not well defined in the atomic coordinates and appears to be disordered. The structure of the hexahistidine tag is also not well defined and has not been displayed. (C) The ordered Cα backbone trace of 20 NMR ensemble structures of IN 329–381 (blue) without the apparently flexible disordered C-terminal tail region (residues 382–408).
Figure 2.
Figure 2.
CTD structure and modeling of tDNA binding sites. (A) PROMALS3D structure-based sequence alignment for the MLV CTD, PFV CTD (PDB ID: 3OS1) and HIV CTD (PDB ID: 1IHV) is displayed using the ESPRIPT server output (35). All default parameters were used for the alignment. The given alignment is constrained to a prior PROMALS3D alignment of the MLV and PFV CTDs alone. Residues 329–380 of the MLV CTD, 319–374 of the PFV CTD and 220–270 of the HIV CTD are displayed. The three predicted tDNA binding residues R337, Q339 and K341 are marked in the alignment with green dots. (B) Electrostatic surface map with two different transparent sphere illustrations to depict the organization of the SH3 fold and predicted tDNA binding residues. Green sticks indicate side chains of MLV IN residues R337, Q339 and K341 (also marked with green dots). Images were generated using the APBS plugin (47) in PyMOL (The PyMOL Molecular Graphics System, Version 1.2r3pre, Schrödinger, LLC.) with the representative model 1 structure from the ensemble of 20 structures. Fully saturated red and blue colors represent, respectively, negative and positive potentials of ±5 kT at an ionic strength of 0.15 M and at a temperature of 298 K. (C) Overlay of the CTD ensemble (orange) with the PFV CTD (magenta) and PFV tDNA (yellow) is shown. PFV CTD tDNA binding resides of R329 and R362 are displayed with their side chains as red sticks. Homologous MLV CTD residues of R337 and K341 have side chains that adopt similar positions and are displayed as blue sticks, while the β1-β2 loop region marked in green and blue represents the six amino acids that were exchanged with their PFV counterparts for generation of chimeric viruses. MLV H338 is also marked in blue and this residue along with MLV K341 was found to be important in combinatorial mutational analysis (See Figure 5).
Figure 3.
Figure 3.
MLV IN CCD. (A) Structure-based sequence alignment of PFV and MLV CCD shows the homologous tDNA binding residues of PFV in MLV. Residues 117–252 for MLV CCD IN, 117–252 for PFV CCD IN and 56–182 for HIV CCD IN are displayed. T163 in PFV corresponds to A160 in MLV, Q186 in PFV corresponds to N185 in MLV, A188 in PFV corresponds to P187 in MLV, S193 in PFV corresponds to K192 in MLV and Y212 in PFV corresponds to Y211 in MLV. PROMALS3D structure-based sequence alignment is displayed using the ESPRIPT server (35). (B) Residues 117–271 of MLV CCD IN were modeled using three different servers as mentioned in the ‘Materials and Methods’ section. An overlay of the three MLV CCD INs with PFV CCD IN (PDB ID: 3OS1) is presented. The alpha helices are represented in red, the beta sheets are represented in yellow and the loops are represented in green. (C) PFV CCD along with the three homology models of MLV CCD is displayed. The tDNA double helix is represented in yellow and was obtained from the PDB ID: 3OS1. tDNA binding residues (blue side chain) of PFV CCD overlaid with the MLV CCD residues predicted to bind tDNA. There is overall agreement in the orientation of the tDNA residue side chains among all the models. The five homologous tDNA binding residues in MLV CCD are A160, N185, P187, K192 and Y211. (D) View of the active site of IN is shown in this figure. The secondary structural elements are colored according to the scheme as in (A). The side chain of the active site residues of PFV CCD (light teal), SWISS-MODEL MLV CCD (light magenta), ITASSER MLV CCD (light blue) and MMM-tree MLV CCD (light orange) is aligned to show the conservation of their architecture. The catalytic triad of D125, D184 and E221 of each of the structures are shown aligned in the presence of a single Mg+2 ion (green sphere) of the PFV IN structure (PDB ID: 3OS1).
Figure 4.
Figure 4.
Replication kinetics of MLV IN CCD mutant viruses. The plot represents viral passage of the IN CCD mutant viruses in D17pJET cells measured by RT activity and scored for the day the culture was RT-positive. Standard error bars are indicated (n = 3). Chi-square test was performed to compare the kinetics of the various mutants with that of NCAC WT. Insert highlights the positions of interest on the structure of IN subdomain.
Figure 5.
Figure 5.
Replication kinetics of MLV IN CTD mutant viruses. The plot represents viral passage of the IN CTD mutant viruses in D17pJET cells measured by RT activity and scored for the day the culture was RT-positive. Standard error bars are indicated (n = 3). Chi-square test was performed to compare the kinetics of the various mutants with that of NCAC WT. Asterisks denote statistically significant differences from NCAC WT; *P < 0.05, **P < 0.01, ***P < 10−4. Insert highlights the positions of interest on the structure of IN subdomain.
Figure 6.
Figure 6.
Sequence LOGOs of MLV IN CCD. Sequence preferences at the site of integration were analyzed using an in-house LOGOs program. Datasets used in the study are listed in Supplementary Table S2. Insert box defines the color associated with each nucleotide. Percent of each nucleotide at each position is indicated relative to the scissile bond at position 0. Statistical significances were compared with the NCAC WT dataset using Fisher's exact test, and P-values were adjusted using Bonferroni correction at the sample level for multiple comparisons (*P < 0.05, **P < 0.01 and ***P < 0.001). Panel A includes MLV WT, FV and HIV datasets, while Panel B includes MLV IN CCD mutant datasets.
Figure 7.
Figure 7.
Sequence LOGOs of MLV IN CTD. Sequence preferences at the site of integration were analyzed using an in-house LOGOs program. Datasets used in the study are listed in Supplementary Table S2. Insert box defines the color associated with each nucleotide. Percent of each nucleotide at each position is indicated relative to the scissile bond at position 0. Statistical significances were compared with the NCAC WT dataset using Fisher's exact test, and P-values were adjusted using Bonferroni correction at the sample level for multiple comparisons (*P < 0.05, **P < 0.01 and ***P < 0.001).
Figure 8.
Figure 8.
Dinucleotide flexibility in the region of TSD. (A) MLV and FV have a 4-bp TSD and therefore three dinucleotide steps of 0–1, 1–2 and 2–3 marked as 1, 2 and 3 in the bottom. Since HIV has a 5-bp TSD, four stands for 3–4. (B) MLV IN CTD β1-β2 loop mutants are shown with respect to flexibility preferences at TSD. For both panels, red line denotes purine–purine (RR) and pyrimidine–pyrimidine (YY) (intermediate flexibility), green line denotes purine–pyrimidine (RY) (rigid), violet line denotes pyrimidine–purine (YR) (flexible) and turquoise line denotes ratio of rigid dinucleotide steps to flexible and intermediate flexible dinucleotide steps. Analysis was performed as described in (18) and in addition the P-values were subjected to Bonferroni correction for multiple comparisons.
Figure 9.
Figure 9.
Model for MLV IN tDNA binding. (A) This model represents the orientation of the MLV IN tDNA binding residues relative to the PFV IN counterparts. The positioning of bent DNA was extrapolated from the PFV IN strand transfer complex (3OS0). Numbers from -6 to 9 indicate the position of nucleotide bases relative to the scissile bond position at 0. Green spheres and green labeling indicates MLV IN amino acids. Red sticks and red labeling indicates PFV IN amino acids. CTD β1and β2 strands and CCD α2 helix are indicated. (B) Magnified view of panel C is shown in order to focus on the potential interactions mediated by P187. -3 (dG), -2 (dT), 5 (dA) and 6 (dC) positions of tDNA are shown. The DNA bases in yellow (5 and 6 positions) are from one strand, while the bases in green (-3 and -2 positions) are from the complementary strand.

References

    1. Engelman A., Mizuuchi K., Craigie R. HIV-1 DNA integration: mechanism of viral DNA cleavage and DNA strand transfer. Cell. 1991;67:1211–1221. - PubMed
    1. Wu X., Li Y., Crise B., Burgess S.M. Transcription start regions in the human genome are favored targets for MLV integration. Science. 2003;300:1749–1751. - PubMed
    1. De Ravin S.S., Su L., Theobald N., Choi U., Macpherson J.L., Poidinger M., Symonds G., Pond S.M., Ferris A.L., Hughes S.H., et al. Enhancers are major targets for murine leukemia virus vector integration. J. Virol. 2014;88:4504–4513. - PMC - PubMed
    1. LaFave M.C., Varshney G.K., Gildea D.E., Wolfsberg T.G., Baxevanis A.D., Burgess S.M. MLV integration site selection is driven by strong enhancers and active promoters. Nucleic Acids Res. 2014;42:4257–4269. - PMC - PubMed
    1. Dyda F., Hickman A.B., Jenkins T.M., Engelman A., Craigie R., Davies D.R. Crystal structure of the catalytic domain of HIV-1 integrase: similarity to other polynucleotidyl transferases. Science. 1994;266:1981–1986. - PubMed

Publication types

Associated data