. 2015 Jul;200(3):737-54.
doi: 10.1534/genetics.115.177303. Epub 2015 May 11.

MSH3 Promotes Dynamic Behavior of Trinucleotide Repeat Tracts In Vivo

Affiliations

MSH3 Promotes Dynamic Behavior of Trinucleotide Repeat Tracts In Vivo

Gregory M Williams et al. Genetics. 2015 Jul.

Abstract

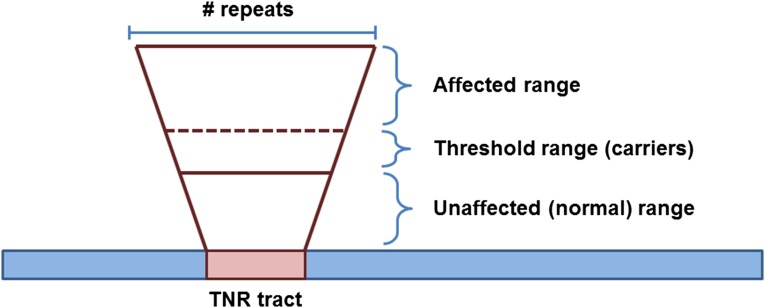
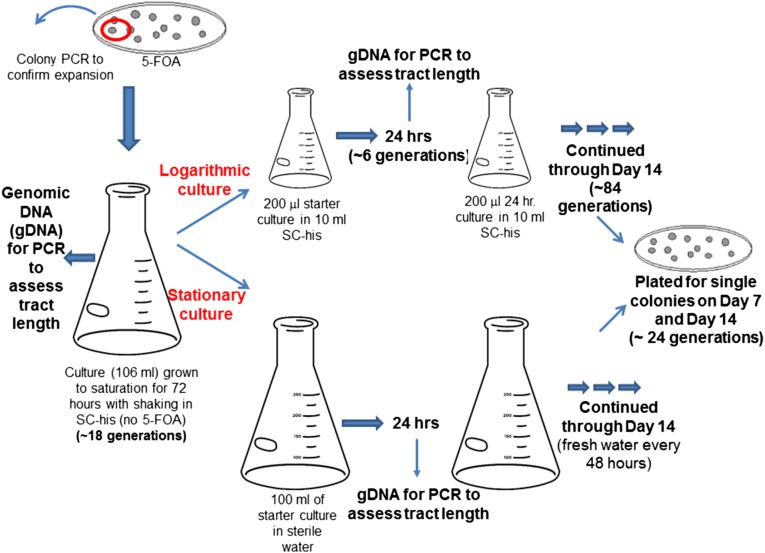
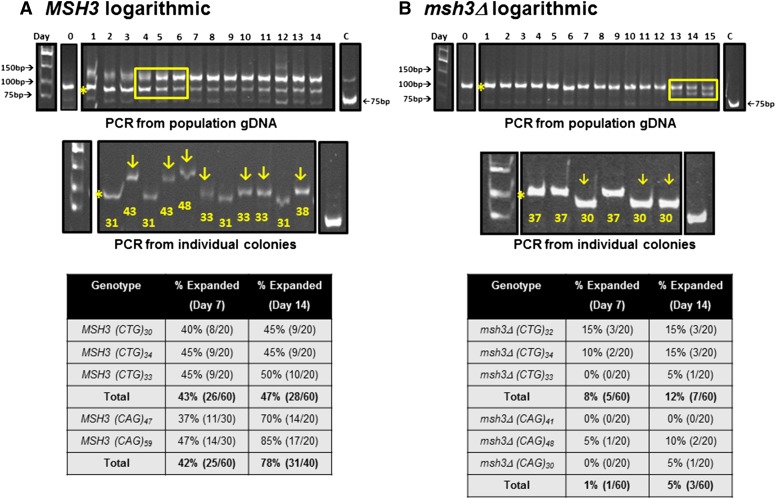
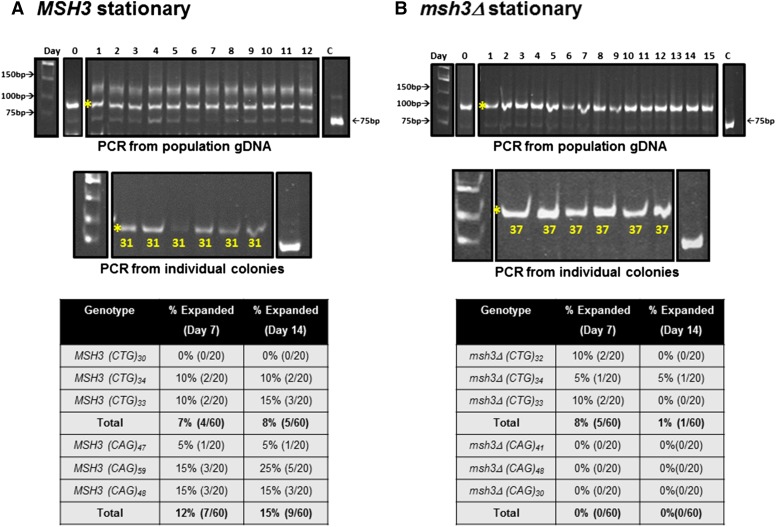
Trinucleotide repeat (TNR) expansions are the underlying cause of more than 40 neurodegenerative and neuromuscular diseases, including myotonic dystrophy and Huntington's disease, yet the pathway to expansion remains poorly understood. An important step in expansion is the shift from a stable TNR sequence to an unstable, expanding tract, which is thought to occur once a TNR attains a threshold length. Modeling of human data has indicated that TNR tracts are increasingly likely to expand as they increase in size and to do so in increments that are smaller than the repeat itself, but this has not been tested experimentally. Genetic work has implicated the mismatch repair factor MSH3 in promoting expansions. Using Saccharomyces cerevisiae as a model for CAG and CTG tract dynamics, we examined individual threshold-length TNR tracts in vivo over time in MSH3 and msh3Δ backgrounds. We demonstrate, for the first time, that these TNR tracts are highly dynamic. Furthermore, we establish that once such a tract has expanded by even a few repeat units, it is significantly more likely to expand again. Finally, we show that threshold- length TNR sequences readily accumulate net incremental expansions over time through a series of small expansion and contraction events. Importantly, the tracts were substantially stabilized in the msh3Δ background, with a bias toward contractions, indicating that Msh2-Msh3 plays an important role in shifting the expansion-contraction equilibrium toward expansion in the early stages of TNR tract expansion.

Keywords: Msh2-Msh3; Saccharomyces cerevisiae; mismatch repair; trinucleotide repeat tract.


Figures

Figure 1
Figure 1
Size of trinucleotide repeat (TNR) tract determines disease phenotype. The normal range of a TNR tract is present in unaffected individuals. This range varies depending on the TNR sequence and position with respect to the relevant gene. As the TNR tract gets larger, it enters the threshold or premutation range. These individuals are typically unaffected by disease but are carriers because these somewhat larger tracts are prone to further expansion. Once the TNR tract expands into the affected range, individuals are symptomatic and are affected by disease.
Figure 2
Figure 2
Distribution of tract size following initial expansion. Whisker plot of the median tract size following selection on 5-FOA plates in MSH3 and msh3Δ strains. The (CAG)25 and (CTG)25 tracts were examined. The plot was created using GraphPad Prism. Both the median and mean sizes of the CAG tracts are statistically different from the CTG tracts (Wilcox rank, t-test, P < 0.0001). The median and mean CAG tract lengths in the MSH3 background are statistically different from the CAG tract in the msh3Δ background, whereas the CTG tract size is similar in both strain backgrounds (Wilcox rank, t-test, P < 0.0001).
Figure 3
Figure 3
Schematic of the liquid time course experiment protocols. Individual colonies with TNR tract expansions were selected on plates containing 5-FOA; the tract increase was confirmed by colony PCR in each case. A single colony with an expanded tract was used to inoculate a large culture that was grown to saturation over 72 hr (∼18 generations). From this population, genomic DNA (gDNA) was isolated. Then parallel log- and stationary-phase cultures were established (see Materials and Methods) and propagated for 14 days. gDNA was prepared from each culture every 24 hr (∼6 generations) and then subjected to PCR to evaluate tract size. A sample from each log- and stationary-phase cultures was diluted and plated to isolate individual colonies (∼26 generations), which then were subjected to PCR to assess tract length. This experiment is akin to a mutation-accumulation experiment, although we limited the number of cell divisions (∼6 per time point) to mitigate any fitness effects of tract changes. This is an end point experiment that indicated that additional expansions are observable in a 2-week time span. Further, it allowed us to observe general trends in the population as well as looking at individual tract lengths from single colonies. See Materials and Methods for additional details.
Figure 4
Figure 4
Liquid time course experiments in MSH3 and msh3Δ logarithmic cultures to determine population tract dynamics. TNR expansion events in the MSH3 or msh3Δ background were selected and confirmed by PCR (see Materials and Methods) and log-phase cultures were established from individual isolates (see Figure 3 for cartoon). (A) MSH3(CTG). (B) msh3Δ(CTG). Top: The TNR tract from gDNA isolated from the MSH3 log-phase cultures was amplified, digested, and analyzed by electrophoresis. In these examples, the initial expansion (indicated by the asterisk) contained 31 repeats for MSH3 and 37 repeats for msh3Δ. The numbers across the top of the gel indicate the day of the time course. The boxed region in A (MSH3) indicates the progressive accumulation of a larger tract. The boxed region in B (msh3Δ) indicates contraction events that result in a smaller tract. The cultures went through approximately six generations in a 24-hr period (see Materials and Methods). Middle: Samples from day 14 cultures were plated on minimal medium lacking histidine to obtain individual colonies. Colony PCR was performed to amplify the TNR tract from colonies to determine individual tract lengths within the population. The arrows indicate tracts that have incurred an additional expansion. The number below each tract indicates the number of repeats within each tract. Control PCR reactions using the TNR plasmid (C) were performed alongside each set as a marker for the 75-base-pair tract (25 repeats). We occasionally observed higher-molecular-weight products with the control plasmid, but these represent a minor population of ≤15% of the total PCR product (Figure S2 and Figure S3). The asterisk indicates the predominant expansion product in the starting culture. Bottom: Summary of expansion frequency on days 7 and 14 in the different genetic backgrounds tested based on PCR amplification of tracts from individual colonies.
Figure 5
Figure 5
Liquid time course experiments in MSH3 and msh3Δ stationary-phase cultures to determine population tract dynamics. Stationary-phase cultures were maintained in parallel with log-phase cultures (see Figure 3 for cartoon). The examples shown here for (A) MSH3 and (B) msh3Δ match those shown in Figure 3. Top: The TNR tract was amplified from gDNA isolated from the stationary-phase culture, digested, and analyzed by electrophoresis. In both MSH3 and msh3Δ, the population remained unchanged over time. The numbers across the top of the gel indicate the day of the time course. Middle: Samples from day 14 cultures were plated on minimal medium lacking histidine to obtain individual colonies. Colony PCR was performed to amplify individual TNR tracts from the stationary-phase population to determine tract lengths. These tracts were quite stable. Control PCR reactions using the TNR plasmid (C) were performed alongside each set. The asterisk indicates the predominant expansion product in the starting culture. Bottom: Summary of expansion frequency on days 7 and 14 in the different genetic backgrounds tested based on PCR amplification of tracts from individual colonies. For more detail, see Table S4.
Figure 6
Figure 6
Schematic of the colony time course experiment protocol. Individual colonies with TNR tract expansions were selected on plates containing 5-FOA; the tract increase was confirmed by colony PCR in each case. A single colony with an expanded tract was transferred to nonselective medium and allowed to continue to grow. For each time course, the same colony was subjected to colony PCR every 24 hr (∼10 generations), sampling from the perimeter of the colony where the cells continued to grow. This approach allowed us to examine the dynamics of a single TNR tract as a function of time. Because the PCR is derived from a subsample of an actively dividing colony, we are necessarily examining a mixed population, albeit derived from the same original cell. See Materials and Methods for additional details.
Figure 7
Figure 7
Progressive expansion events in MSH3 but not in msh3Δ. A. MSH3. Expansion events were selected in the MSH3(CTG)25 background and confirmed by PCR. Individual colonies were followed over several days; colony PCR was performed on each colony every 24 hr for 14 days to amplify the TNR tract (see Figure 6 for cartoon). Left: The tracts from time course E4 were resolved on a 12% polyacrylamide gel and stained with EtBr. The numbers across the top of the gel indicate the day of the time course. Right: Southern blot of the gel in left panel to demonstrate that the expansion products contain TNR sequence. The lanes marked C in each panel indicate the 75-base-pair tract amplified from the TNR plasmid control. (B) msh3Δ. Expansion events were selected in the msh3Δ(CTG)25 background and confirmed by PCR. Individual colonies were followed over several days; colony PCR was performed on each colony every 24 hr for 10 days to amplify the TNR tract. Top: The tracts from time course V1 were resolved on a 12% polyacrylamide gel and strained with EtBr. The numbers across the top of the gel indicate the day of the time course. Bottom left: The tracts from time course C8 were resolved on a 12% polyacrylamide gel and stained with EtBr. The numbers across the top of the gel indicate the day of the time course. Bottom right: Southern blot of the gel in lower left panel to demonstrate that the expansion products indicated by the arrows contain TNR sequence. The lanes marked C in each panel indicate the 75-base-pair tract amplified from the TNR plasmid control.
Figure 8
Figure 8
Colony time courses in MSH3 and msh3Δ backgrounds. The TNR tract size was plotted as a function of time to demonstrate trends in the data. Each panel represents an independent (CTG)25 integrant in the different strain backgrounds. Each curve in a single panel represents the time course of an independent expansion event in that background. (A) MSH3. All MSH3 colony time courses were plotted. Each plot shows the tract size changes in independent colonies from a single MSH3(CTG)25 isolate. A total of 64 time courses were performed: 28 showed progressive expansion, 3 showed tract stability, 11 showed no amplification (loss of tract), and 22 showed high background with multiple PCR products. This last category was difficult to interpret but exhibited trends similar to those analyzed in Figure 8A; 9 tracts exhibited increasing trends, and 4 tracts appeared stable. (B) msh3Δ. All msh3Δ time courses were plotted, and linear regressions were calculated. A total of 64 time courses were performed: 0 showed progressive expansion, 23 showed tract stability, 7 tracts showed contractions, 26 showed no amplification (loss of tract), and 6 showed high background with multiple PCR products. Linear regressions were plotted for each time course to illustrate the general trends in tract length.
Figure 9
Figure 9
Sizes of each step (tract size change) in colony time course experiments. Each progressive tract length change, defined as the loss of one tract length and the concomitant appearance of a different tract length, was plotted as a function of size for MSH3 (A) and msh3Δ (B) using GraphPad Prism. The median and interquartile ranges for each step are indicated in black. (A) MSH3. The initial expansion size selected on 5-FOA is indicated (pink circles). The orange squares indicate the size of each individual tract upon the first tract length change or step. Similarly, the second, third, and fourth steps are shown (olive triangles, green inverted triangles, and blue diamonds, respectively). The median size of each step is essentially unchanged. (B) msh3Δ. The sizes of the initial expansion events are shown (pick circles); the median is comparable to that of the MSH3 time courses. Only one progressive step was observed (orange squares), and this was a step down to a short tract length.
Figure 10
Figure 10
Schematic of the microcolony time course experiment protocol. Individual colonies with TNR tract expansions were selected on plates containing 5-FOA; the tract increase was confirmed by colony PCR in each case. Instead of initiating the time course with a potentially mixed population, the microcolony time course was started with single cells from a colony with an expanded tract. These cells were restricted to between 8 and 10 cell divisions, with an eye to minimizing the heterogeneity within the population. See Materials and Methods for additional details.
Figure 11
Figure 11
Dynamic changes in TNR tracts starting from a single cell. Expansion events were selected in either the MSH3(CTG)25 (A) or msh3Δ(CTG)25 (B) background and confirmed by PCR. Individual cells from these colonies were isolated and allowed to undergo 8–10 rounds of replication, resulting in a microcolony approximately 250–1000 cells in size. A single cell was then taken from this microcolony to propagate another microcolony. The remainder was used to amplify the TNR tract by PCR to determine tract length (see Figure 10 for cartoon). (A) An example of TNR tract dynamics in an MSH3 microcolony (F from Table 2). There are multiple changes in the TNR tract over time. (B) Two examples of TNR tract dynamics in an msh3Δ microcolony (N and Q, respectively, from Table 3). The red asterisk indicates the position of the initial expansion tract size, as determined by Southern blot. The upper bands in the bottom panel do not contain TNR tract sequences, as determined by Southern blot (data not shown). The tract appears more stable than in the MSH3 background. Both gels are 12% polyacrylamide gels stained with EtBr; the images of been inverted for ease of viewing. The lanes marked C in each panel indicate the 75-base-pair tract amplified from the TNR plasmid control. The numbers across the top of the gels indicate the time point.

Similar articles

Cited by

References

    1. Alani E., Cao L., Kleckner N., 1987. A method for gene disruption that allows repeated use of URA3 selection in the construction of multiply disrupted yeast strains. Genetics 116: 541–545. - PMC - PubMed
    1. Bacolla A., Larson J. E., Collins J. R., Li J., Milosavljevic A., et al. , 2008. Abundance and length of simple repeats in vertebrate genomes are determined by their structural properties. Genome Res. 18: 1545–1553. - PMC - PubMed
    1. Barber L. J., Ward T. A., Hartley J. A., McHugh P. J., 2005. DNA interstrand cross-link repair in the Saccharomyces cerevisiae cell cycle: overlapping roles for PSO2 (SNM1) with MutS factors and EXO1 during S phase. Mol. Cell. Biol. 25: 2297–2309. - PMC - PubMed
    1. Castel A. L., Cleary J. D., Pearson C. E., 2010. Repeat instability as the basis for human diseases and as a potential target for therapy. Nat. Rev. Mol. Cell Biol. 11: 165–170. - PubMed
    1. Concannon C., Lahue R. S., 2014. Nucleotide excision repair and the 26S proteasome function together to promote trinucleotide repeat expansions. DNA Repair 13: 42–49. - PubMed

Publication types

MeSH terms

Substances

LinkOut - more resources