. 2015 May 11;3(5):e12400.
doi: 10.14814/phy2.12400.

High-frequency voltage oscillations in cultured astrocytes

Affiliations

High-frequency voltage oscillations in cultured astrocytes

Wiebke Fleischer et al. Physiol Rep. .

Abstract

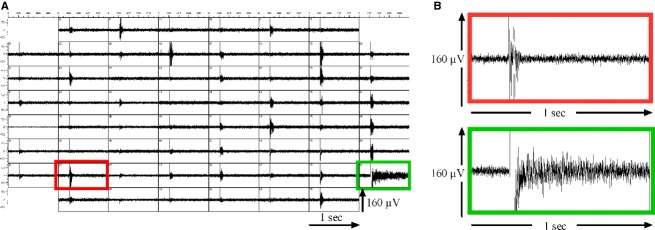
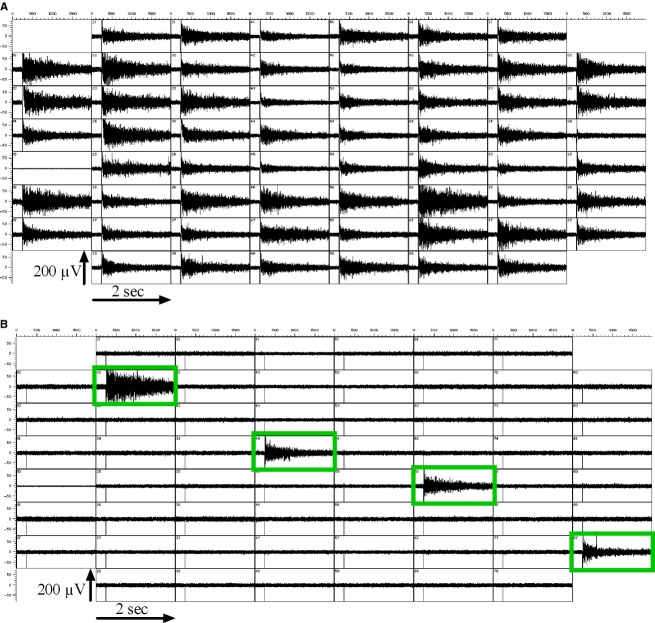
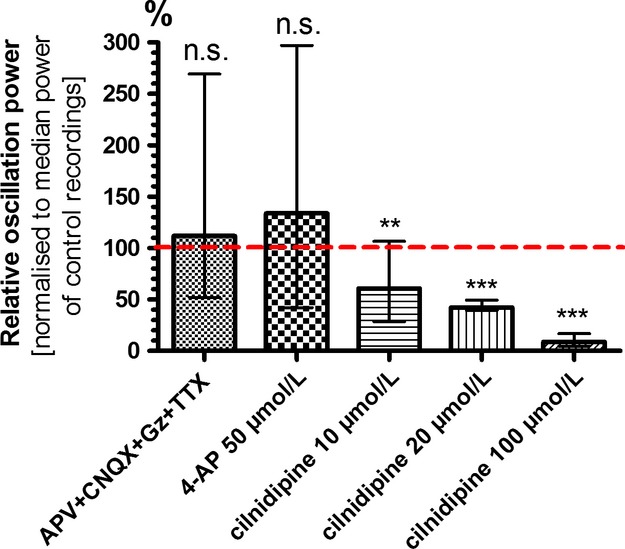
Because of their close interaction with neuronal physiology, astrocytes can modulate brain function in multiple ways. Here, we demonstrate a yet unknown astrocytic phenomenon: Astrocytes cultured on microelectrode arrays (MEAs) exhibited extracellular voltage fluctuations in a broad frequency spectrum (100-600 Hz) after electrical stimulation. These aperiodic high-frequency oscillations (HFOs) could last several seconds and did not spread across the MEA. The voltage-gated calcium channel antagonist cilnidipine dose-dependently decreased the power of the oscillations. While intracellular calcium was pivotal, incubation with bafilomycin A1 showed that vesicular release of transmitters played only a minor role in the emergence of HFOs. Gap junctions and volume-regulated anionic channels had just as little functional impact, which was demonstrated by the addition of carbenoxolone (100 μmol/L) and NPPB (100 μmol/L). Hyperpolarization with low potassium in the extracellular solution (2 mmol/L) dramatically raised oscillation power. A similar effect was seen when we added extra sodium (+50 mmol/L) or if we replaced it with NMDG(+) (50 mmol/L). The purinergic receptor antagonist PPADS suppressed the oscillation power, while the agonist ATP (100 μmol/L) had only an increasing effect when the bath solution pH was slightly lowered to pH 7.2. From these observations, we conclude that astrocytic voltage oscillations are triggered by activation of voltage-gated calcium channels and driven by a downstream influx of cations through channels that are permeable for large ions such as NMDG(+). Most likely candidates are subtypes of pore-forming P2X channels with a low affinity for ATP.

Keywords: Calcium channels; Glia; HFO; MEA; P2X channels; extracellular recording; multi‐electrode array; voltage oscillations.


Figures

Figure 1
Figure 1
Mixed cortical cell cultures with neurons and astrocytes on MEAs exhibit spike bursts and high-frequency voltage-oscillations (HFOs). (A) A single rectangular voltage stimulus (800 mV, 200 μs/phase) was applied to one MEA electrode (green frame) and triggered network bursts of action potentials detected on most other MEA electrodes. (B) An exemplary recording of one network burst (red frame) is shown at higher temporal resolution. The electrode that was used for stimulation showed long-lasting high-frequency oscillations (HFOs). These HFOs were considerably longer but less clearly defined in the time domain than spike bursts (B, green frame).
Figure 2
Figure 2
Only very few neurons in astrocyte cultures. Immunostainings of our astrocyte cultures showed a high ratio of GFAP+ cells and only a few interspersed neurons in red (β-III-tubulin). Cell nuclei were stained with DAPI (blue).
Figure 3
Figure 3
Astrocytic HFOs are locally restricted to the source of the stimulus. (A) When a stimulus was applied to the astrocyte culture via every MEA electrode (except ground), virtually all electrodes showed HFOs with varying amplitudes and durations in response. (B) When the stimulus was applied to a subset of electrodes (green frames), only cells in close proximity of the stimulated electrodes responded with HFOs. This indicates that (1) the stimulus was not passively conducted through the recording solution, and that – unlike in neuronal cultures – (2) there was no active transfer of the signal over longer distances within the cellular layer. The MEAs we used in this study featured 200 μm distance between neighboring electrodes.
Figure 4
Figure 4
High-frequency voltage oscillations (HFOs) in cultured astrocytes after electrical stimulation. (A) shows two color-coded plots of spectral power averaged over 42 electrodes and ten stimulus trials each, obtained from one experiment on a single MEA. The left panel shows the HFO spectrum under control conditions, while the corresponding spectrum under the inhibiting effect of 1 mmol/L BaCl2 is presented in the right panel. Time is plotted on the horizontal axis (range 0–10 sec) and frequency on the vertical axis (0–600 Hz). The logarithm (base 10) of the time- and frequency-dependent power over baseline is color-coded in the range 10−15 to 10−13. The average HFO in the control recording was 9.2 sec long, while the 1 mmol/L BaCl-recording lasted for 3.1 sec, until its total power over baseline had dropped to 1.8 %. (B) shows the distribution of HFO duration, median oscillation frequency and power for all 905 electrodes analyzed in 53 control recordings with standard bath solution. The bimodal structure of the median oscillation frequency distribution indicates the presence of higher oscillation frequencies (~200 Hz) on a subset of electrodes. Frequencies below 100 Hz were cut off due to the imposed hardware high pass filter.
Figure 5
Figure 5
High-frequency oscillations are not electrical artifacts but generated by vital astrocytes. (A) Ten single rectangular voltage stimuli (800 mV, 200 μs/phase) were applied to all 59 recording electrodes of the MEA. Signal power was summed over a time window of 9 sec after the stimulus and averaged over all 10 stimuli. The left-hand graph depicts median power and interquartile range of the voltage oscillations elicited on all stimulated electrodes. The combined physicochemical and electronic noise of the ionic solution, Ti/TiN electrodes and amplifier was determined with MEAs that were covered with nutrition medium but without any attached cells. Only very slight oscillations were observed when we stimulated mouse embryonic fibroblasts cultured on MEAs. Stimulation of astrocytes at 3 div caused strong voltage oscillations on many electrodes that exceeded the noise level (“no cells”) nearly 5000 times. Average power spectra of the respective measurements are given on the right hand side. The logarithm (base 10) of the time- and frequency-dependent power over baseline is color-coded in the range 10−14 to 10−12 V2. The horizontal time axis covers 9 sec after the stimulus. Frequency (0–600 Hz) is plotted on the vertical axis. (B) Astrocyte cultures were recorded before and 2 h after the addition of 10% DMSO – a concentration that is supposed to kill cells. The median power of the stimulus-induced oscillations decreased dramatically, presumably to noise level. The respective power spectra in a 9 sec window after the stimulus are depicted on the right hand side of the panel (0–600 Hz; 10−14 to 10−12 V2). (C) Astrocytes were exposed to hyperosmotic shock by transferring them from recording solution with 100 mmol/L NaCl to 300 mmol/L NaCl. Recordings were performed before and 2 h after the presumably deadly osmotic shock. No HFOs could be elicited after the treatment. Power spectra on the right hand side clearly demonstrate the collapse in oscillation power after the death of the astrocytes (0–600 Hz; 10−14 to 10−12 V2).
Figure 6
Figure 6
High-frequency oscillations depend on activation of voltage-gated calcium channels. Combined application of TTX (1 μmol/L) with antagonists of ionotropic glutamate receptors (D-APV 20 μmol/L, CNQX 10 μmol/L) and GABAA receptors (gabazine, 10 μmol/L) showed that HFO power was insensitive to blockers of voltage-gated sodium channels and synaptic blockers. Blockade of voltage-gated potassium channels with 4-AP (50 μmol/L) had just as little effect. The voltage-gated calcium channel antagonist cilnidipine inhibited astrocytic HFO power in a dose-dependent manner. These properties point to L- and/or N-type calcium channels as cellular transducers of the electrical stimulus. Data are depicted as normalized medians with inner and outer quartils (**P < 0.01; ***P < 0.001; n.s., not significant).
Figure 7
Figure 7
High-frequency oscillations are strongly dependent on calcium. (A) HFOs completely vanished when astrocytes were pre-incubated with the membrane-permeable Ca2+-chelator BAPTA-AM (50 μmol/L). Substitution of extracellular Ca2+ with Ba2+ (1 mmol/L) strongly reduced HFO power. Apparently, influx of Ca2+ is mandatory to elicit HFOs. HFOs were as strongly suppressed when equimolar amounts of Ca2+ and Ba2+ were present in the extracellular solution. Ba2+ seems to be more preferably transferred across the membrane when both ions compete for it. Glutamate (100 μmol/L) intensified HFO power more strongly than DHPG, an agonist of group I metabotropic glutamate receptors. Histamine (50 μmol/L) and the muscarinic agonist carbachol (10 μmol/L) only slightly increased HFO power (**P < 0.01; ***P < 0.001). (B) Lowering the extracellular calcium concentration resulted in a dramatic increase in HFO power: 500 μmol/L tripled the power and 200 μmol/L actually increased power 17-fold compared to standard conditions with 1 mmol/L CaCl2. The opposite effect was seen with higher calcium concentrations. Data in A and B is depicted as normalized medians with inner and outer quartils. (C) The left hand side depicts signals of four selected MEA electrodes over a time period of 20 sec after electrical stimulation (red arrow) under control conditions (1 mmol/L CaCl2, upper panel) and under extracellular calcium deficiency (200 μmol/L CaCl2, lower panel). The right hand side shows the power spectra of the same MEA electrodes averaged over ten stimuli applied at 20 sec intervals. HFOs under control conditions were small in amplitude and lasted approximately 2 sec. With only 200 μmol/L Ca2+, the HFOs elicited by the voltage pulse on the same electrodes persisted even after the inter-stimulus interval of 20 sec. Note that HFOs on most electrodes showed no gradual decrease in amplitude but rather spontaneous rekindling. Power was maximal at frequencies below 200 Hz.
Figure 8
Figure 8
High-frequency oscillations are partially driven by vesicular release of transmitters and are augmented by membrane hyperpolarization. (A) Bafilomycin A1 is an inhibitor of vesicular release. Incubation with 1 μmol/L for 1 h did not completely block but significantly reduced HFO power to 75 % of control recording. A similar effect was seen after application of the gap-junction blocker carbenoxolone (100 μmol/L; 63 %). No inhibition was induced by NPPB (100 μmol/L; 110 %), a blocker of volume-regulated anionic channels. (B) We used various concentrations of KCl in the bath solution to induce changes in the astrocytic membrane potential. Hyperpolarization with 2 mmol/L KCl dramatically raised HFO power to the ninefold of control conditions with 5 mmol/L KCl (870 %). Depolarization with 10 mmol/L KCl on the other hand inhibited HFOs (49 %).The blocker CsCl (1 mmol/L) was applied to standard recording solution to examine whether this effect was due to an involvement of hyperpolarization -activated currents. CsCl had only a slight and not significant effect on HFOs (78 %), suggesting hyperpolarization -activated currents as irrelevant factors in the context of HFOs (***P < 0.001; n.s., not significant).
Figure 9
Figure 9
High-frequency oscillations are driven by the movement of – even large – cations into the cells through purinergic receptors. (A) To test our hypotheses that hyperpolarization raised HFO power due to an increased driving force for cations into the cell, we used a bath solution with 150 mmol/L instead of 100 mmol/L NaCl. HFO power dramatically rose to the 14-fold (1377 %) of control conditions. Interestingly, when we added 50 mmol/L NMDG+ to the standard bath solution, we saw a comparable rise in HFO power (1106 %). The molecule NMDG+ is too big to pass through “normal” ion channels but can enter cells via diluted pore-forming channels. (B) PPADS is a nonselective antagonist of purinergic P2X and P2Y receptors. P2X receptors are ion channels permeable for cations. Here, PPADS dose-dependently decreased HFO power. The natural agonist of these receptors, ATP, increased HFO power only in a rather high concentration of 100 μmol/L (135 % of control recording). We conclude that HFO generation involves P2X receptors with a low affinity for ATP (***P < 0.001; n.s., not significant).
Figure 10
Figure 10
Acidic pH boosts HFOs and sensitizes the cells for ATP. (A) Lowering extracellular pH caused a gradual increase in pH power. Even slight changes in pH (from 7.7 to 7.2) enhanced HFO power threefold. At pH 6.6, HFO power increased threefold compared to 7.2 (279 %) and HFO duration lasted nearly as long as under the calcium deficiency paradigm illustrated in Figure7 B (200 μmol/L calcium). (B) Addition of 100 μmol/L ATP to a recording solution with a pH of 7.7 increased HFO power to 148 %. Incubation with an acidic bath solution of pH 7.2 already tripled HFO power compared to a pH 7.7 control (321 %), but application of ATP further increased power to 536 % (**P < 0.01; ***P < 0.001).

Similar articles

Cited by

References

    1. Adermark L. Lovinger DM. Electrophysiological properties and gap junction coupling of striatal astrocytes. Neurochem. Int. 2008;52:1365–1372. - PMC - PubMed
    1. Aivar P, Valero M, Bellistri E. Menendez de la Prida L. Extracellular calcium controls the expression of two different forms of ripple-like hippocampal oscillations. J. Neurosci. 2014;34:2989–3004. - PMC - PubMed
    1. Akita T, Fedorovich SV. Okada Y. Ca2+ nanodomain-mediated component of swelling-induced volume-sensitive outwardly rectifying anion current triggered by autocrine action of ATP in mouse astrocytes. Cell. Physiol. Biochem. 2011;28:1181–1190. - PubMed
    1. Anderson CM, Bergher JP. Swanson RA. ATP-induced ATP release from astrocytes. J. Neurochem. 2004;88:246–256. - PubMed
    1. Anderson S, Brismar T. Hansson E. Effect of external K+, Ca2+, and Ba2+ on membrane potential and ionic conductance in rat astrocytes. Cell. Mol. Neurobiol. 1995;15:439–450. - PMC - PubMed

LinkOut - more resources