

HIV-1 Infection Accelerates Age According to the Epigenetic Clock
- PMID: 25969563
- PMCID: PMC4621253
- DOI: 10.1093/infdis/jiv277
HIV-1 Infection Accelerates Age According to the Epigenetic Clock
Abstract
Background: Infection with human immunodeficiency virus type 1 (HIV) is associated with clinical symptoms of accelerated aging, as evidenced by the increased incidence and diversity of age-related illnesses at relatively young ages and supporting findings of organ and cellular pathologic analyses. But it has been difficult to detect an accelerated aging effect at a molecular level.
Methods: Here, we used an epigenetic biomarker of aging based on host DNA methylation levels to study accelerated aging effects due to HIV infection. DNA from brain and blood tissue was assayed via the Illumina Infinium Methylation 450 K platform.
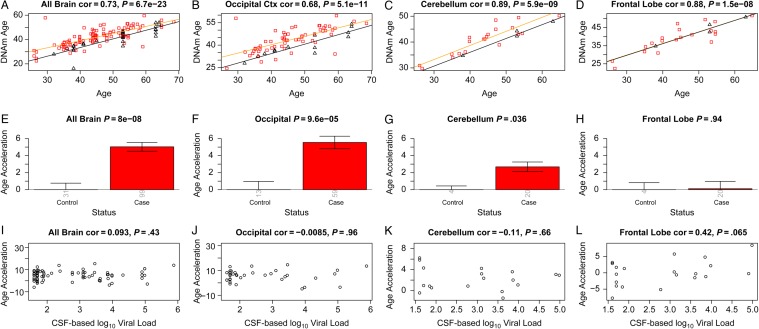
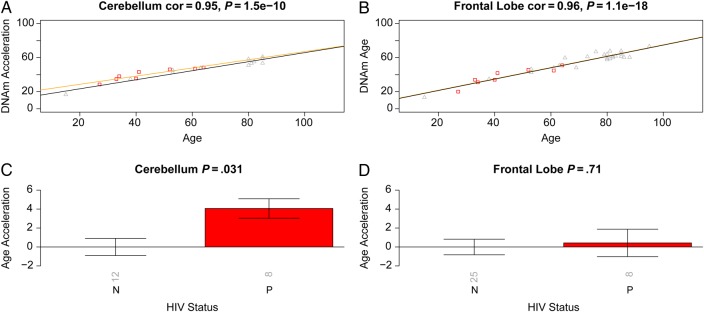
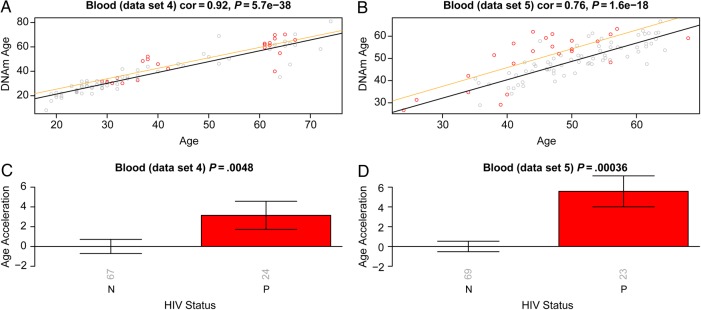
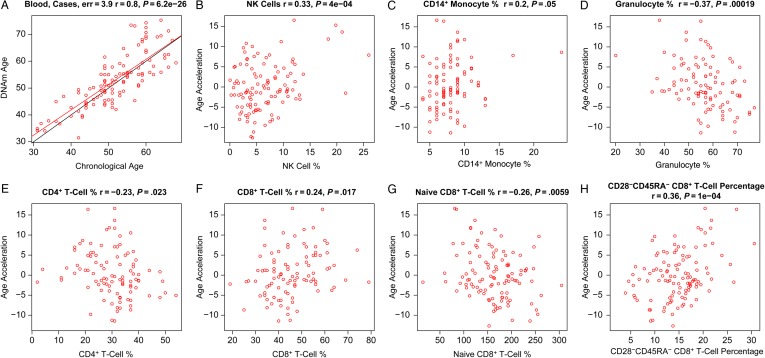
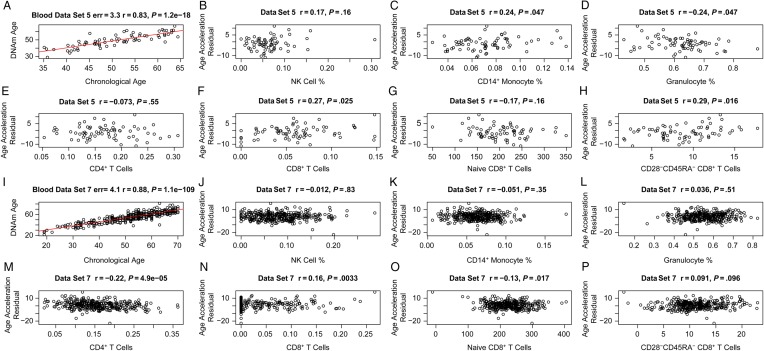
Results: Using 6 novel DNA methylation data sets, we show that HIV infection leads to an increase in epigenetic age both in brain tissue (7.4 years) and blood (5.2 years). While the observed accelerated aging effects in blood may reflect changes in blood cell composition (notably exhausted cytotoxic T cells), it is less clear what explains the observed accelerated aging effects in brain tissue.
Conclusions: Overall, our results demonstrate that the epigenetic clock is a useful biomarker for detecting accelerated aging effects due to HIV infection. This tool can be used to accurately determine the extent of age acceleration in individual tissues and cells.
Keywords: DNA methylation; HIV-1; aging; biomarker; epigenetics.
© The Author 2015. Published by Oxford University Press on behalf of the Infectious Diseases Society of America.
Figures
References
-
- Fausto A, Bongiovanni M, Cicconi P et al. . Potential predictive factors of osteoporosis in HIV-positive subjects. Bone 2006; 38:893–7. - PubMed
-
- Lucas GM, Mehta SH, Atta MG et al. . End-stage renal disease and chronic kidney disease in a cohort of African-American HIV-infected and at-risk HIV-seronegative participants followed between 1988 and 2004. AIDS 2007; 21:2435–43. - PubMed
-
- Martin J, Volberding P. HIV and premature aging: a field still in its infancy. Ann Intern Med 2010; 153:477–9. - PubMed
Publication types
MeSH terms
Substances
Grants and funding
- R24-NS38841/NS/NINDS NIH HHS/United States
- U24 MH100929/MH/NIMH NIH HHS/United States
- U01 MH083507/MH/NIMH NIH HHS/United States
- R24 MH059724/MH/NIMH NIH HHS/United States
- UL1TR000124/TR/NCATS NIH HHS/United States
- U01-MH083501/MH/NIMH NIH HHS/United States
- R21 AG046954/AG/NIA NIH HHS/United States
- U01 MH083500/MH/NIMH NIH HHS/United States
- AI28697/AI/NIAID NIH HHS/United States
- R24 NS045491/NS/NINDS NIH HHS/United States
- U24 MH100928/MH/NIMH NIH HHS/United States
- R24-NS45491/NS/NINDS NIH HHS/United States
- R24 MH059745/MH/NIMH NIH HHS/United States
- UL1 TR000124/TR/NCATS NIH HHS/United States
- R24 NS038841/NS/NINDS NIH HHS/United States
- R01 DA030913/DA/NIDA NIH HHS/United States
- R24-MH59745/MH/NIMH NIH HHS/United States
- R24-MH59724/MH/NIMH NIH HHS/United States
- UM1 AI035043/AI/NIAID NIH HHS/United States
- P30 AI028697/AI/NIAID NIH HHS/United States
- U01 MH083501/MH/NIMH NIH HHS/United States
- U01-AI-35040/AI/NIAID NIH HHS/United States
- U01 MH083506/MH/NIMH NIH HHS/United States
- 5R01AG042511-02/AG/NIA NIH HHS/United States
- U01-MH08021/MH/NIMH NIH HHS/United States
- U01-MH083506/MH/NIMH NIH HHS/United States
- U01 AI035040/AI/NIAID NIH HHS/United States
- U01-MH083507/MH/NIMH NIH HHS/United States
- R01 AG042511/AG/NIA NIH HHS/United States
- R01DA030913/DA/NIDA NIH HHS/United States
LinkOut - more resources
Full Text Sources
Other Literature Sources
Medical
Molecular Biology Databases
