. 2015 Apr-Jun;25(2):109-20.
doi: 10.4103/0971-3026.155831.

Imaging of lung cancer: Implications on staging and management

Affiliations

Imaging of lung cancer: Implications on staging and management

Nilendu C Purandare et al. Indian J Radiol Imaging. 2015 Apr-Jun.

Abstract

Lung cancer is one of the leading causes of cancer-related deaths. Accurate assessment of disease extent is important in deciding the optimal treatment approach. To play an important role in the multidisciplinary management of lung cancer patients, it is necessary that the radiologist understands the principles of staging and the implications of radiological findings on the various staging descriptors and eventual treatment decisions.

Keywords: Computed Tomography scan; Positron emission tomography-computed tomography; imaging; lung cancer; staging.


Conflict of interest statement

Conflict of Interest: None declared.

Figures

Figure 1 (A-D)
Figure 1 (A-D)
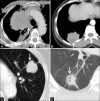
Common radiological appearances of lung cancer. Centrally located mass with mediastinal invasion (arrow, A), peripherally situated mass abutting the pleura (arrow, B), mass with smooth, lobulated margins (arrow, C) and with spiculated, irregular margins (arrow, D)
Figure 2 (A-D)
Figure 2 (A-D)
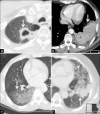
Lung cancers with atypical radiological pattern. Squamous cell cancer presenting as a cavitating mass (arrow, A). Adenocarcinoma presenting as dense consolidation (arrow, B). Bronchoalveolar carcinoma (adenocarcinoma in situ) presenting as ground-glass opacity (arrow, C) and mixed density, solid (arrow), and ground-glass nodules (arrowhead) in D
Figure 3 (A-D)
Figure 3 (A-D)
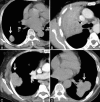
Stage T1 and T2 tumors. Stage T1 tumor due to size <3 cm (arrow, A). Stage T2 endobronchial tumor (arrowhead) causing pneumonitis restricted to the upper lobe (arrow) in B. T2a tumor >3 cm but <5 cm (arrow, C). T2b tumor >5 cm but <7 cm (arrow in D)
Figure 4 (A-D)
Figure 4 (A-D)
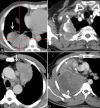
Stage T3 tumors. T3 tumor due to size >7 cm in size (arrow, A), eroding the ribs (arrow, B), infiltrating the mediastinal pleura but not the vessels (arrow, C), and causing atelectasis of the entire lung (arrowhead, D)
Figure 5 (A-D)
Figure 5 (A-D)
Stage T4 tumors. T4 tumor due to invasion of pulmonary artery (arrow, A), descending aorta (arrow, B), vertebral body (arrow, C), superior vena cava with thrombus (arrow, D)
Figure 6 (A and B)
Figure 6 (A and B)
Role of FDG PET/CT in primary tumor delineation. Irregular soft tissue opacity seen on coronal CT scan (arrow, A) with no obvious demarcation between the tumor and surrounding consolidation. PET/CT shows the FDG-avid tumor (arrow, B) separate from the non–FDG-avid consolidation (arrowhead, B)
Figure 7 (A-J)
Figure 7 (A-J)
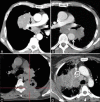
(A-D) Nodal disease. Right upper paratracheal nodes-N3 (arrow, 7A) in a left-sided lung cancer (block arrow, A). Pretracheal-N2 (arrow, B) and aortopulmonary-N3 (arrowhead, B) nodes in a right-sided lung cancer (block arrow, B). Left inferior pulmonary ligament node-N2 (arrow, C) in a left-sided lung cancer (block arrow, C). Right scalene node-N3 (arrow, D). (E-J) Nodal stations. Nodal stations based on the IASLC map (ref 15). Station 1 (E)- Low cervical, supraclavicular, and sternal notch; station 2 (E and F)- upper paratracheal; station 3a (F-H)- prevascular; station 3p (F-H)- retrotracheal; station 4 (H)- lower paratracheal; station 5 (G)- aortopulmonary window; station 6 (H)- para-aortic (ascending aorta or phrenic); station 7 (I)- subcarinal; station 8 (J)- paraesophageal (below carina); station 9 (J)- pulmonary ligament; station 10 (I)- hilar; stations 11-14 are not included in the figure
Figure 8 (A-C)
Figure 8 (A-C)
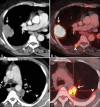
FDG PET in nodal disease. Maximum intensity projection (MIP) image shows an FDG-avid primary lung tumor on the left side (arrow, A) and a focus of FDG uptake in the mediastinum (arrowhead, A). CT scan shows enhancing, spiculated primary tumor (arrow, B) and a small right paratracheal node (arrowhead, B) which is negative by size criteria. Fused PET/CT image shows FDG concentration in the primary (arrow, C) as well as the node (arrowhead, C), suggesting metastatic involvement. Mediastinoscopy and biospy revealed metastatic node-N3 disease
Figure 9 (A and B)
Figure 9 (A and B)
FDG PET in nodal disease false-positive study. Maximum intensity projection (MIP) image shows an FDG-avid primary lung tumor on the right side (arrow, A) and multiple foci of FDG uptake in the mediastinum (arrowhead, A). CT scan shows enhancing, primary tumor (arrow, B). Fused PET/CT image shows FDG concentration in the mediastinal nodes, suggesting metastatic involvement. Mediastinoscopy and biospy revealed tuberculosis
Figure 10 (A-F)
Figure 10 (A-F)
Metastatic disease. Bilateral pleural effusions-M1a (arrow, A), lung metastases-M1a (arrows, B), adrenal metastasis-M1b (arrow, C), vertebral metastasis-M1b (arrow, D), brain metastasis-M1b (arrow, E), liver metastases-M1b (arrows, F)
Figure 11 (A-E)
Figure 11 (A-E)
Adrenal adenoma versus metastasis. Enhancing solid adrenal nodule on CT scan in a case of lung cancer (arrow, A) suggestive of metastatic deposit. Unenhanced CT scan shows fatty attenuation within the nodule with an HU value of 0 suggesting the possibility of an adenoma (arrow, B). FDG PET/CT shows no tracer concentration in the nodule, confirming the diagnosis of adenoma. Enhancing solid adrenal nodule on CT scan in another patient of lung cancer (arrow, D), which is indeterminate in nature. FDG PET/CT shows abnormal focal tracer concentration in the nodule (arrow, E) highly suggestive of a metastatic deposit
Figure 12 (A-D)
Figure 12 (A-D)
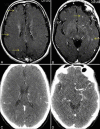
Brain metastases in asymptomatic patient, CT scan versus MRI. MRI brain in a patient of lung cancer shows multiple tiny enhancing foci scattered in the parenchyma bilaterally (arrows in A and B) suggestive of metastatic lesions. Corresponding contrast CT scan sections of the brain show no obvious lesions (C and D). Note the beam hardening effects due to bone, leading to a loss of resolution on the CT images (C and D)
Figure 13 (A-D)
Figure 13 (A-D)
Asymptomatic marrow metastases detected on FDG PET/CT. MIP image of an FDG PET scan of a lung cancer patient shows intense tracer concentration in a mass lesion in the left hemithorax (arrows in A and B) and another smaller lesion in the right hemithorax (arrowhead, B). Intense tracer concentration is seen on FDG PET/CT in the right second rib suggesting metastatic disease (arrowhead, C). Note the subtle marrow changes in the rib on CT scan (arrowhead, D)
Figure 14 (A-D)
Figure 14 (A-D)
Pleural effusion and role of FDG PET/CT. Enhancing lung masses seen on CT scans in two different patients (arrows in A and C) with minimal pleural effusions (arrowheads in A and C). Corresponding PET/CT scans show intense FDG-avid metastatic pleural deposits (arrowheads in B and D) as the cause of effusions. Note that the pleural deposits are barely perceptible on CT
Figure 15 (A-D)
Figure 15 (A-D)
Incremental value of FDG PET/CT in baseline staging. MIP image of FDG PET scan shows intense tracer concentration in the right hemithorax (arrow, A) corresponding to a right lung mass (arrow, B). Also seen are two FDG-avid foci in the abdomen (arrowheads, A) which correspond to peritoneal metastatic deposits (arrowhead, C). Note that the peritoneal deposit is almost indistinguishable from adjacent bowel (arrowhead, D). Due to PET/CT findings, the intent of treatment changes from curative surgery of a resectable mass to palliative chemotherapy
Figure 16 (A and B)
Figure 16 (A and B)
Superior sulcus tumor. Axial (A) and coronal (B) CT scans show a large mass in the apex of the right lung causing destruction of the first and second ribs (arrows) with erosion of the right half of the vertebral body (arrowheads) suggestive of a superior sulcus tumor
Figure 17 (A-C)
Figure 17 (A-C)
Small cell lung cancer (limited stage). MIP image of an FDG PET study shows intense tracer concentration in the mediastinum (arrow, A) which corresponds to an FDG-avid soft tissue mass on CT and PET/CT (arrow in B and C) which extends into the mediastinum and appears to conglomerate and merge with the nodal disease (arrowheads, B). This is a typical radiological appearance of small cell cancers. No extrathoracic metastatic site is seen on the MIP image (A)

References

    1. Mountain CF. Revisions in the international system for staging lung cancer. Chest. 1997;111:1710–7. - PubMed
    1. Ferlay J, Soerjomataram I, Ervik M, Dikshit R, Eser S, Mathers C, et al. Lyon, France: International Agency for Research on Cancer; 2013. [Last accessed on 2014 Jun 15]. GLOBOCAN 2012 v1.0, Cancer Incidence and Mortality Worldwide: IARC CancerBase No. 11. Available from: http://www.globocan.iarc.fr .
    1. Buccheri G, Ferrigno D. Lung cancer: Clinical presentation and specialist referral time. Eur Respir J. 2004;24:898–904. - PubMed
    1. Cancer facts and figures 2008. Atlanta, Ga: American Cancer Society; 2008. American Cancer Society.
    1. Goldstraw P, Crowley J, Chansky K, Giroux DJ, Groome PA, Rami-Porta R, et al. The IASLC lung cancer staging project: Proposals for the revision of the TNM stage groupings in the forthcoming (seventh) edition of the TNM classification of malignant tumours. J Thorac Oncol. 2007;2:706–14. - PubMed