

Reduced expression of peroxisome proliferator-activated receptor alpha in BAL and blood T cells of non-löfgren's sarcoidosis patients
- PMID: 25969669
- PMCID: PMC4428503
- DOI: 10.1186/s12950-015-0071-6
Reduced expression of peroxisome proliferator-activated receptor alpha in BAL and blood T cells of non-löfgren's sarcoidosis patients
Abstract
Background: Sarcoidosis is a granulomatous disease affecting in particular the lungs. The peroxisome proliferator-activated receptors (PPARs) play important regulatory roles in inflammation. The aim of this study was to gain more insight about the expression of all three PPARs (α, β/δ and γ) in sarcoidosis.
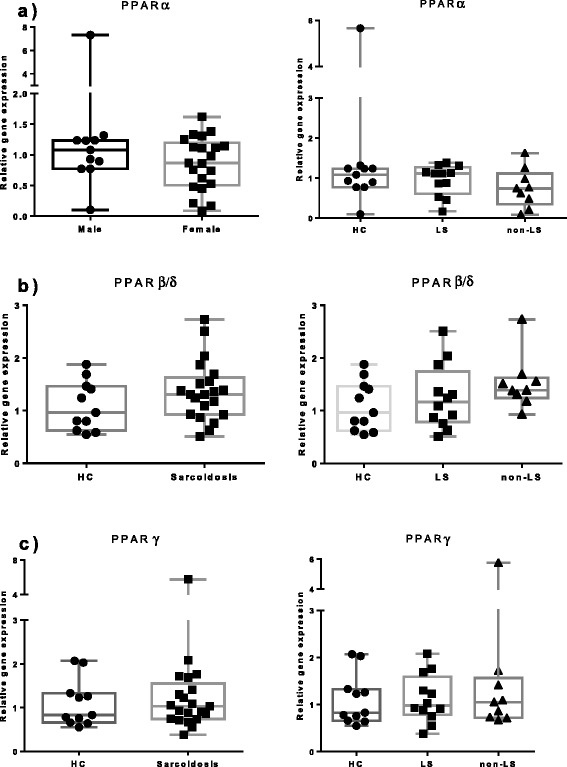
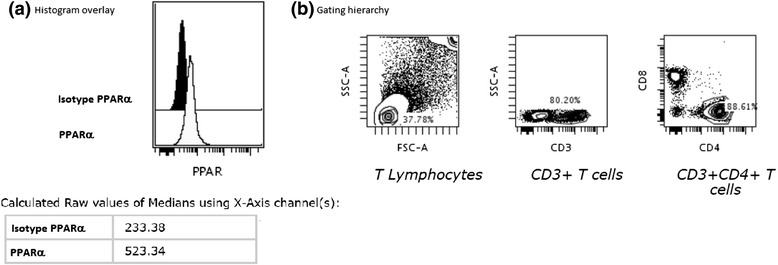
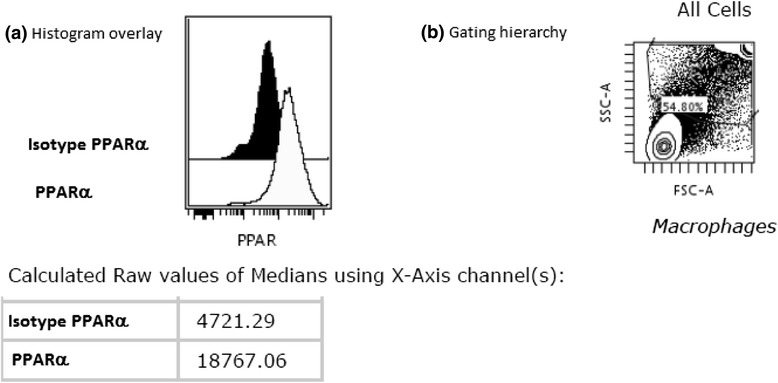
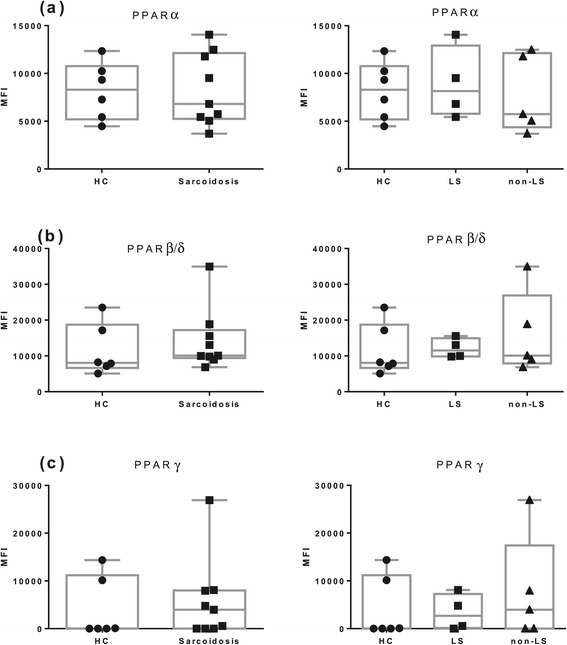
Methods: Bronchoalveolar lavage (BAL) cells and peripheral blood cells were obtained from healthy controls (HC) and sarcoidosis patients with Löfgren's syndrome (LS) and without Löfgren's syndrome (non-LS). PPARs mRNA expression was analyzed in total BAL cells and in FACS (Fluorescence-activated cell sorting) sorted alveolar macrophages (AM) and CD4(+) T cells respectively by comparative RT-PCR. PPARs protein expression was analyzed in AM, and in BAL and blood CD4(+) and CD8(+) T cells by flow cytometry.
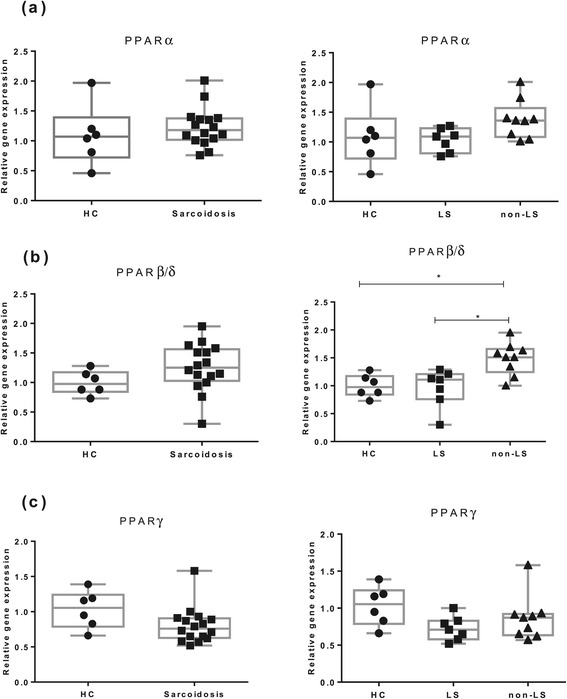
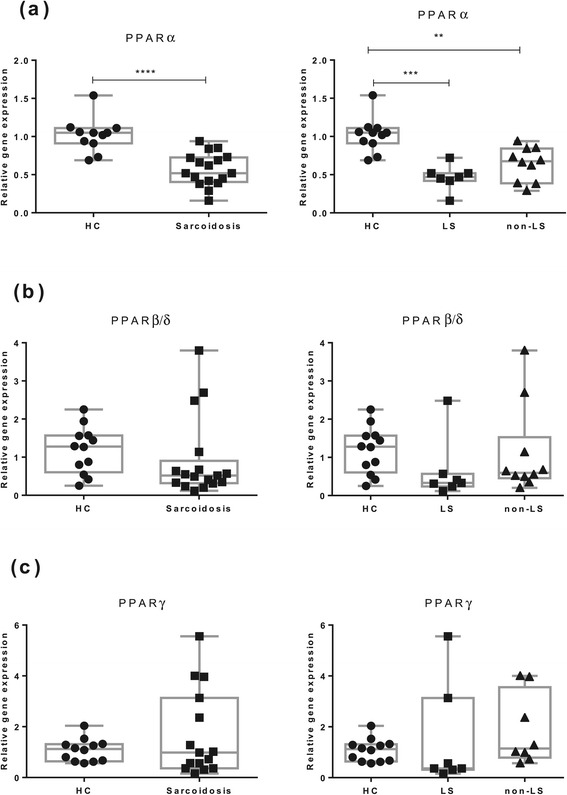
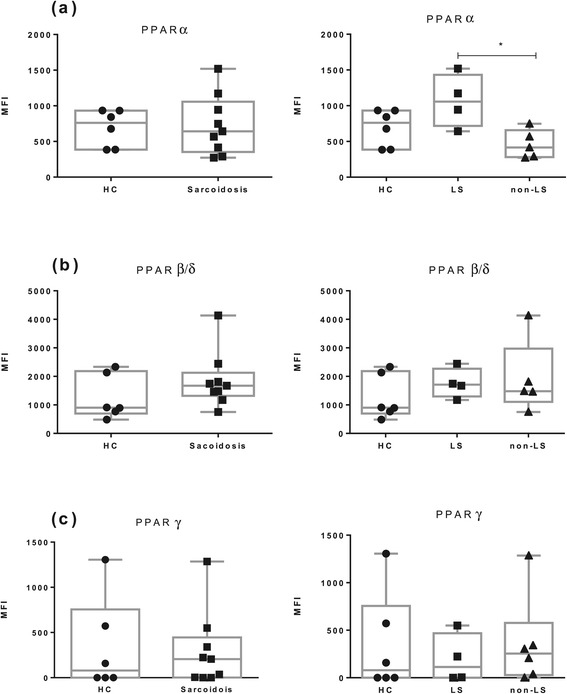
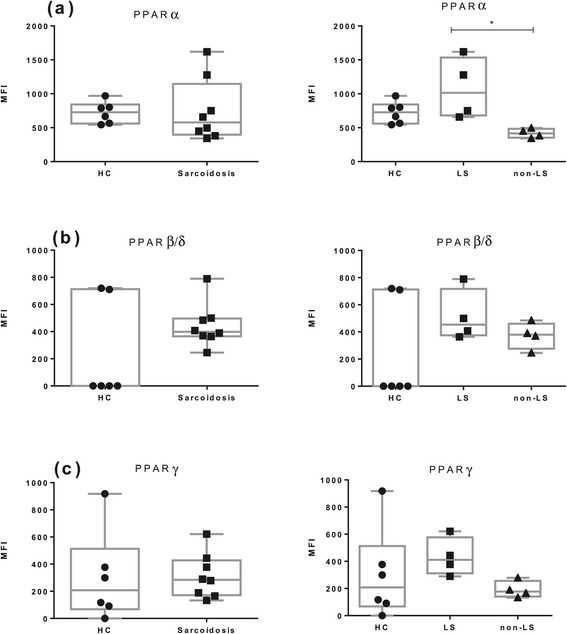
Results: In BAL CD4(+) T cells, we noticed a significantly lower PPARα mRNA expression in sarcoidosis patients compared with HC. In non-LS patients, a significantly lower PPARα protein expression in BAL CD4(+) T cells was detected as compared with LS patients. In peripheral blood CD4(+) T cells, non-LS patients had a significantly lower expression of PPARα and PPARγ compared with LS patients.
Conclusion: The lower protein expression of PPARα and PPARγ could contribute to the persistent T-cell driven inflammation noted especially in non-resolving sarcoidosis, common in non-LS patients.
Keywords: Alveolar macrophages; BAL and blood CD4+- and CD8+ T lymphocytes; Bronchoalveolar lavage (BAL); Flow cytometry; Peroxisome proliferator-activated receptors α; RT-PCR; Sarcoidosis; β/δ and γ.
Figures
Similar articles
-
Mass Cytometry Identifies Distinct Lung CD4+ T Cell Patterns in Löfgren's Syndrome and Non-Löfgren's Syndrome Sarcoidosis.Front Immunol. 2017 Sep 12;8:1130. doi: 10.3389/fimmu.2017.01130. eCollection 2017. Front Immunol. 2017. PMID: 28955342 Free PMC article.
-
Antigen-specific multifunctional T-cells in sarcoidosis patients with Lofgren's syndrome.Eur Respir J. 2012 Jul;40(1):110-21. doi: 10.1183/09031936.00166110. Epub 2011 Dec 19. Eur Respir J. 2012. PMID: 22183480
-
No evidence of altered alveolar macrophage polarization, but reduced expression of TLR2, in bronchoalveolar lavage cells in sarcoidosis.Respir Res. 2010 Sep 2;11(1):121. doi: 10.1186/1465-9921-11-121. Respir Res. 2010. PMID: 20813038 Free PMC article.
-
Th17-lineage cells in pulmonary sarcoidosis and Löfgren's syndrome: Friend or foe?J Autoimmun. 2018 Feb;87:82-96. doi: 10.1016/j.jaut.2017.12.012. Epub 2018 Jan 5. J Autoimmun. 2018. PMID: 29310925 Review.
-
Peroxisome proliferator-activated receptor gamma as modulator of inflammation in pulmonary sarcoidosis.Srp Arh Celok Lek. 2013 Sep-Oct;141(9-10):705-9. doi: 10.2298/sarh1310705p. Srp Arh Celok Lek. 2013. PMID: 24364239 Review.
Cited by
-
Altered transcription factor targeting is associated with differential peripheral blood mononuclear cell proportions in sarcoidosis.Front Immunol. 2022 Oct 13;13:848759. doi: 10.3389/fimmu.2022.848759. eCollection 2022. Front Immunol. 2022. PMID: 36311769 Free PMC article.
References
LinkOut - more resources
Full Text Sources
Other Literature Sources
Research Materials
