

doi: 10.1155/2015/152349.
Epub 2015 Apr 19.
Association of MRS-Based Vertebral Bone Marrow Fat Fraction with Bone Strength in a Human In Vitro Model
Affiliations
- PMID: 25969766
- PMCID: PMC4417596
- DOI: 10.1155/2015/152349
Item in Clipboard
Association of MRS-Based Vertebral Bone Marrow Fat Fraction with Bone Strength in a Human In Vitro Model
J Osteoporos.
2015.
Abstract
Bone marrow adiposity has recently gained attention due to its association with bone loss pathophysiology. In this study, ten vertebrae were harvested from fresh human cadavers. Trabecular BMD and microstructure parameters were extracted from MDCT. Bone marrow fat fractions were determined using single-voxel MRS. Failure load (FL) values were assessed by destructive biomechanical testing. Significant correlations (P < 0.05) were observed between MRS-based fat fraction and MDCT-based parameters (up to r = -0.72) and MRS-based fat fraction and FL (r = -0.77). These findings underline the importance of the bone marrow in the pathophysiology and imaging diagnostics of osteoporosis.
Figures
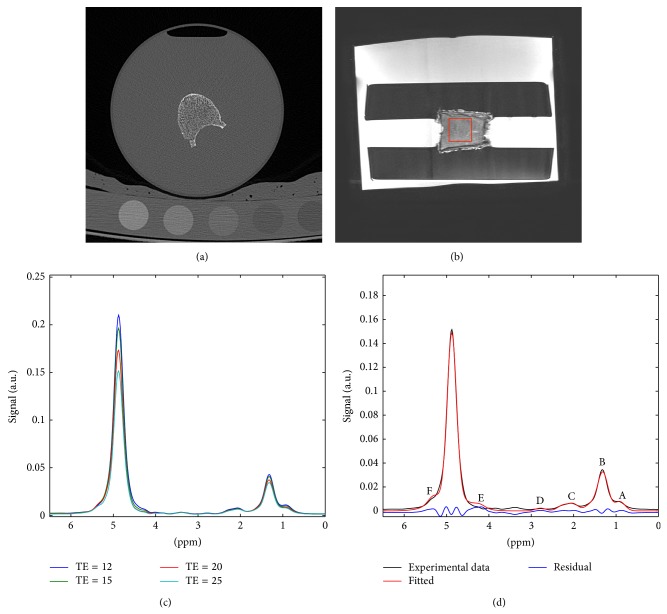
Representative images and spectra: (a) MDCT transverse image showing vertebral body and calibration phantom, (b) sagittal proton density-weighted MR image showing vertebral body and resin holders (the red box within the vertebra corresponds to the voxel position for the employed single-voxel MRS), (c) MR spectrum acquired at different echo times (12, 15, 20, and 25 ms), and (d) quality of spectrum fitting for the MR spectrum at TE = 25 ms (fat peaks A–F labeled along the spectral axis).
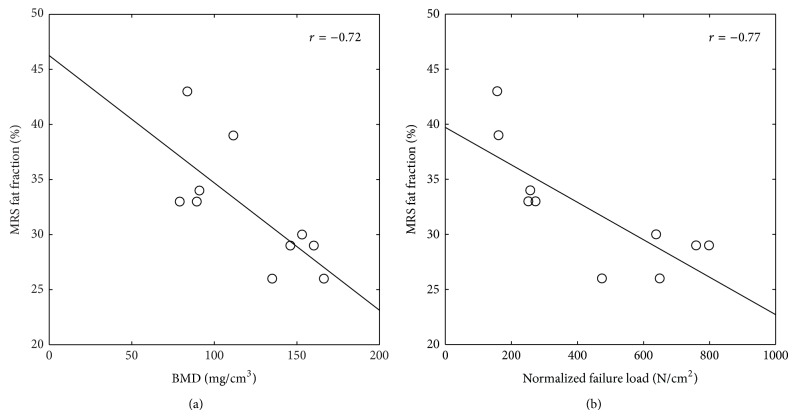
Relationship (a) between MRS proton density fat fraction and BMD and (b) between MRS proton density fat fraction and normalized failure load. The open circles represent the experimental results and the solid line shows the result of the linear regression.
References
-
- NIH. Osteoporosis prevention, diagnosis, and therapy. The Journal of the American Medical Association. 2001;285(6):785–795. - PubMed
LinkOut - more resources
Full Text Sources
Other Literature Sources
Medical
