. 2015 Aug 6;524(7563):93-6.
doi: 10.1038/nature14490. Epub 2015 May 13.

Genetic diversity and evolutionary dynamics of Ebola virus in Sierra Leone

Collaborators, Affiliations

Genetic diversity and evolutionary dynamics of Ebola virus in Sierra Leone

Yi-Gang Tong et al. Nature. .

Erratum in

  • Erratum: Genetic diversity and evolutionary dynamics of Ebola virus in Sierra Leone.
    Tong YG, Shi WF, Liu D, Qian J, Liang L, Bo XC, Liu J, Ren HG, Fan H, Ni M, Sun Y, Jin Y, Teng Y, Li Z, Kargbo D, Dafae F, Kanu A, Chen CC, Lan ZH, Jiang H, Luo Y, Lu HJ, Zhang XG, Yang F, Hu Y, Cao YX, Deng YQ, Su HX, Sun Y, Liu WS, Wang Z, Wang CY, Bu ZY, Guo ZD, Zhang LB, Nie WM, Bai CQ, Sun CH, An XP, Xu PS, Zhang XL, Huang Y, Mi ZQ, Yu D, Yao HW, Feng Y, Xia ZP, Zheng XX, Yang ST, Lu B, Jiang JF, Kargbo B, He FC, Gao GF, Cao WC; China Mobile Laboratory Testing Team in Sierra Leone. Tong YG, et al. Nature. 2015 Oct 22;526(7574):595. doi: 10.1038/nature15255. Epub 2015 Aug 26. Nature. 2015. PMID: 26308898 Free PMC article. No abstract available.

Abstract

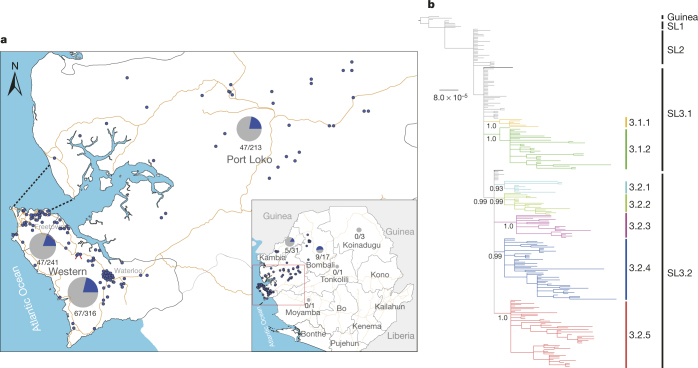
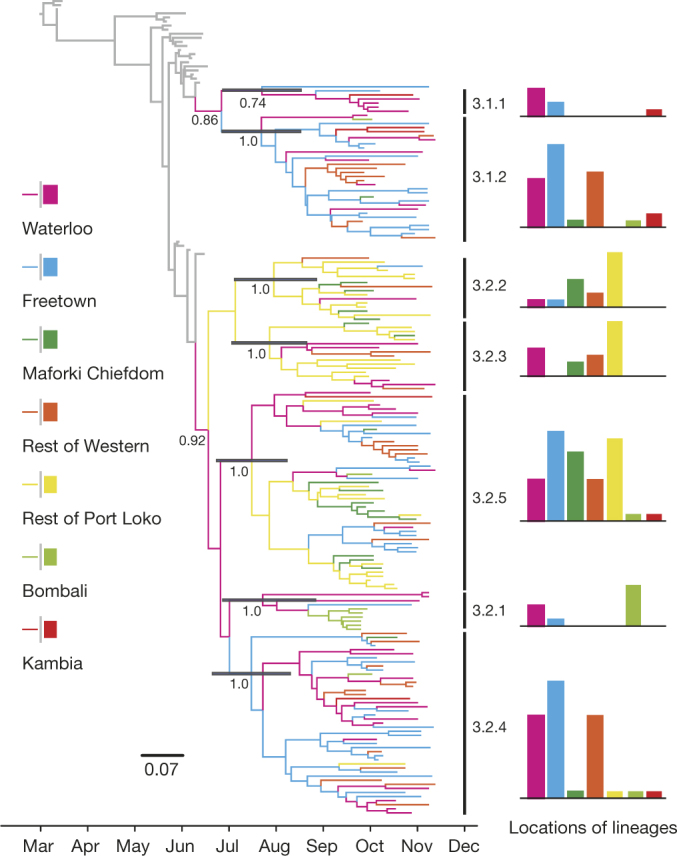
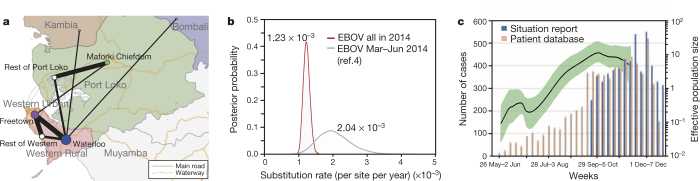
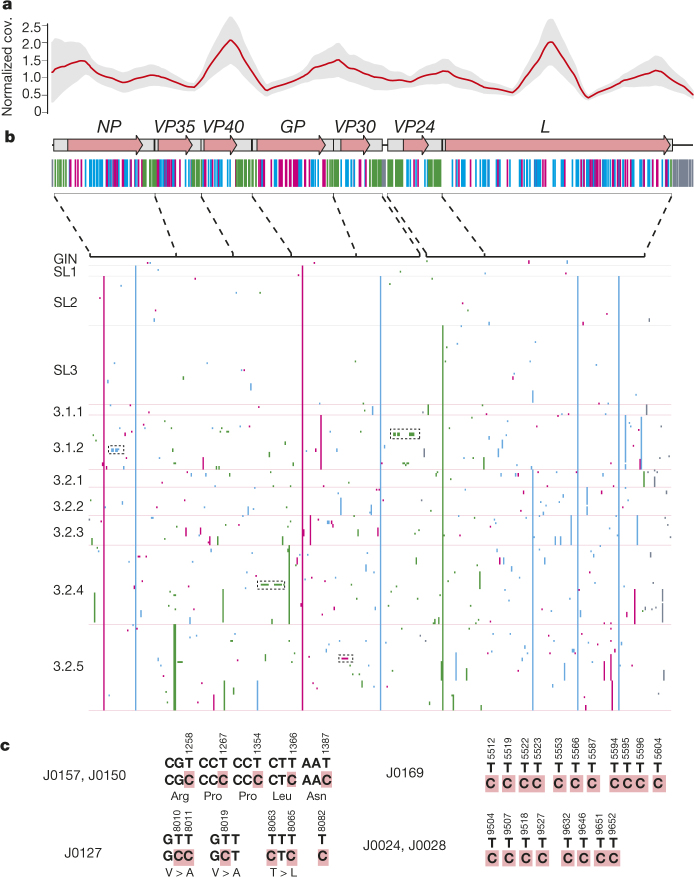
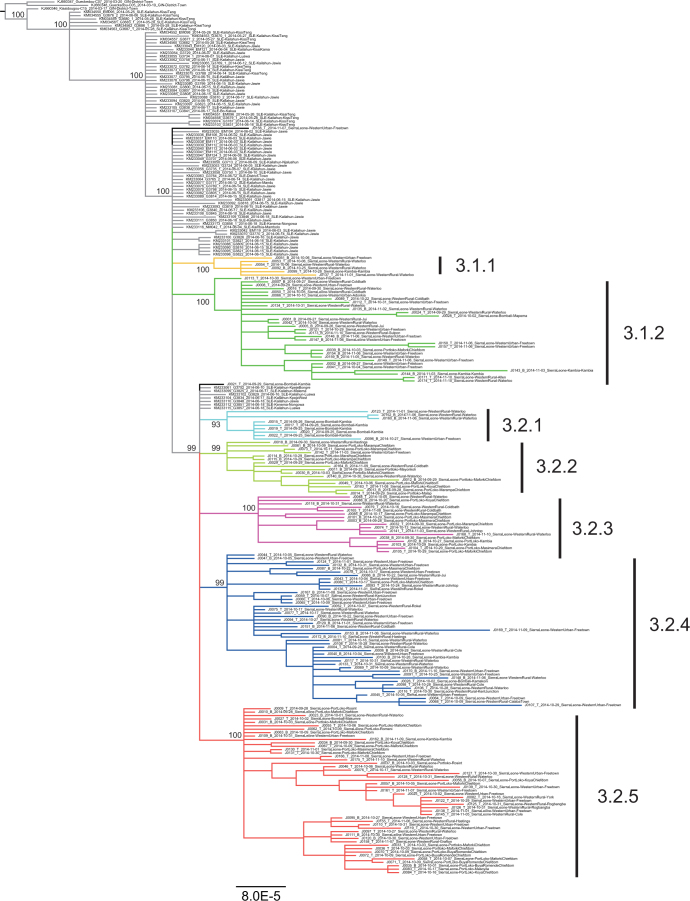
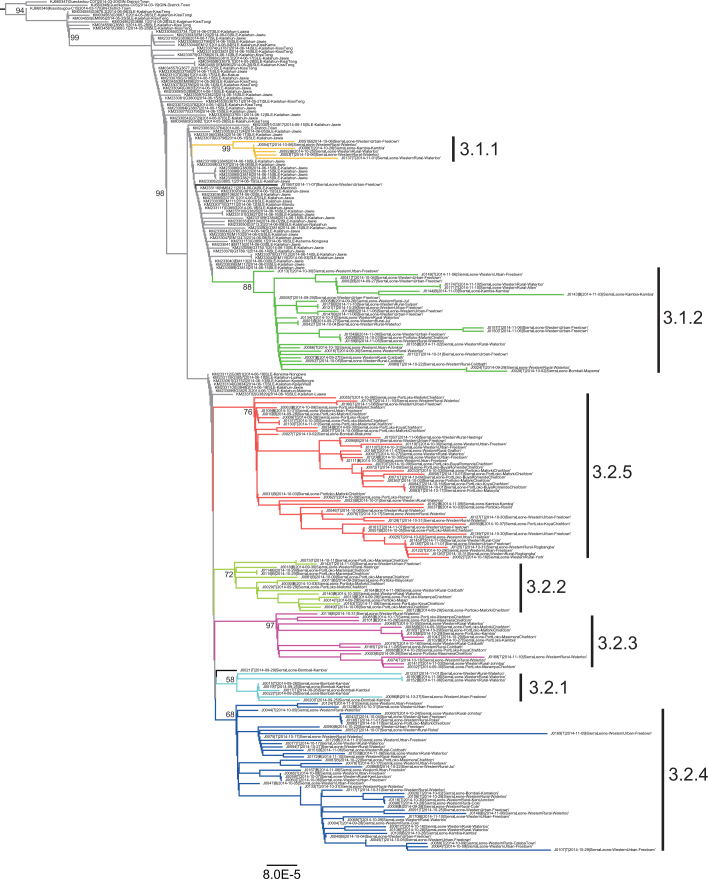
A novel Ebola virus (EBOV) first identified in March 2014 has infected more than 25,000 people in West Africa, resulting in more than 10,000 deaths. Preliminary analyses of genome sequences of 81 EBOV collected from March to June 2014 from Guinea and Sierra Leone suggest that the 2014 EBOV originated from an independent transmission event from its natural reservoir followed by sustained human-to-human infections. It has been reported that the EBOV genome variation might have an effect on the efficacy of sequence-based virus detection and candidate therapeutics. However, only limited viral information has been available since July 2014, when the outbreak entered a rapid growth phase. Here we describe 175 full-length EBOV genome sequences from five severely stricken districts in Sierra Leone from 28 September to 11 November 2014. We found that the 2014 EBOV has become more phylogenetically and genetically diverse from July to November 2014, characterized by the emergence of multiple novel lineages. The substitution rate for the 2014 EBOV was estimated to be 1.23 × 10(-3) substitutions per site per year (95% highest posterior density interval, 1.04 × 10(-3) to 1.41 × 10(-3) substitutions per site per year), approximating to that observed between previous EBOV outbreaks. The sharp increase in genetic diversity of the 2014 EBOV warrants extensive EBOV surveillance in Sierra Leone, Guinea and Liberia to better understand the viral evolution and transmission dynamics of the ongoing outbreak. These data will facilitate the international efforts to develop vaccines and therapeutics.


Conflict of interest statement

The authors declare no competing financial interests.

Figures

Figure 1
Figure 1. Geographical distribution and phylogenetic analysis of the 2014 EBOV from Sierra Leone.
a, Geographical distribution of the 823 EBOV positive samples and the 175 newly sequenced genomes (represented as blue dots). In the panel, main roads and waterways are showed as yellow lines and black dash lines, respectively. b, A Bayesian phylogenetic tree of the 2014 EBOV. The 175 newly sequenced viruses in this study are shown in colours, and others are shown in grey. The seven novel lineages designated in the present are highlighted. Posterior support for major nodes is shown. PowerPoint slide
Figure 2
Figure 2. Phylogeographic reconstruction of the 2014 EBOV using BEAST.
In the left panel, the novel 175 EBOV genome sequences were coloured by geographic regions. The transition of different colours represents a potential transmission event. In the right panel, the number of sequences from different geographic regions in each lineage is summarized. PowerPoint slide
Figure 3
Figure 3. Reconstructed phylogeographic linkage, substitution rate, and effective population size of the 2014 EBOV in western Sierra Leone from September to November 2014.
a, The phylogeographic linkage constructed using BEAST. Thickness of lines represents the relative transmission rate between two regions. The size of each node is proportional to the sum of the relative rates of the region with Bayes factor >3. b, Substitution rates of the 2014 EBOV. The red line represents the substitution rate estimated using all the 2014 EBOV samples. Estimations of Gire and colleagues were repeated by us and shown as the blue line. c, Gaussian Markov random field Bayesian skyride reconstruction of the 2014 EBOV. Bar chart shows the numbers of confirmed cases of EBOV infection and patients. Smooth black line shows the effective population size. Adapted, with permission, from Ebola response roadmap - Situation report, Figure 3; http://www.who.int/csr/disease/ebola/situation-reports/en (accessed 1 April 2015). PowerPoint slide
Figure 4
Figure 4. Genomic variations of the 2014 EBOV.
a, Sequence depth across sequenced genomes. The x axis represents the virus genome structure, and the y axis represents the normalized average depth. One unit equals approximately 1,400 coverage per site. The mean depth is shown using the red line and the standard deviation is shown in shade. b, Substitutions of the 2014 EBOV. Only positions with substitutions are shown. Different lineages are separated by lines. Different types of substitutions are indicated using different colours: cyan for synonymous (S), magenta for non‐synonymous (NS), green for un‐translated regions (UTR), and grey for intergenic regions (IG). c, All the serial T > C substitutions are found within a range less than 150 bp. Substitutions within coding regions are shown in codons. PowerPoint slide
Extended Data Figure 1
Extended Data Figure 1. Phylogenetic tree of the 2014 EBOV inferred using MrBayes.
The seven novel sublineages are highlighted using different colours. Previously described EBOV sequences are shown in grey. Posterior probability for each lineage is shown.
Extended Data Figure 2
Extended Data Figure 2. Maximum likelihood tree of 2014 EBOV constructed using RAxML.
Extended Data Figure 3
Extended Data Figure 3. Phylogeographic inference of the 2014 EBOV using BEAST.
Previously described EBOV sequences are shown in grey. Posterior probability for each lineage is shown.
Extended Data Figure 4
Extended Data Figure 4. Original sequencing results of the serial T>C substitutions using the Sanger method.
All of the four regions including serial T>C substitutions were sequenced using the Sanger method with the primers provided in Extended Data Table 1.
Extended Data Figure 5
Extended Data Figure 5. Synonymous and non‐synonymous substitutions of the 2014 EBOV.
a, Distribution of synonymous and non‐synonymous substitutions in different lineages. The numbers of substitutions are labelled within bars. NS, non‐synonymous; S, synonymous; UTR, UTR region; IG, intergenic. b, Gene‐specific global dN/dS estimates. The dN/dS and 95% highest posterior density interval were calculated using HyPhy. c, Lineage‐specific global dN/dS estimates.

Comment in

References

    1. World Health Organization. Ebola response roadmap - Situation report. http://www.who.int/csr/disease/ebola/situation-reports/en (accessed, 1 April 2015)
    1. Baize Emergence of Zaire Ebola virus disease in Guinea. N. Engl. J. Med. 2014;371:1418–1425. doi: 10.1056/NEJMoa1404505. - DOI - PubMed
    1. Leroy EM, et al. Fruit bats as reservoirs of Ebola virus. Nature. 2005;438:575–576. doi: 10.1038/438575a. - DOI - PubMed
    1. Gire, S. K. et al. Genomic surveillance elucidates Ebola virus origin and transmission during the 2014 outbreak. Science345,. 1369–1372 (2014) - PMC - PubMed
    1. Kugelman JR, et al. Evaluation of the potential impact of Ebola virus genomic drift on the efficacy of sequence-based candidate therapeutics. MBio. 2015;6:e02227–14. doi: 10.1128/mBio.02227-14. - DOI - PMC - PubMed

Publication types