. 2015 Jun 25;522(7557):474-7.
doi: 10.1038/nature14326. Epub 2015 May 11.

PPAR-α and glucocorticoid receptor synergize to promote erythroid progenitor self-renewal

Affiliations

PPAR-α and glucocorticoid receptor synergize to promote erythroid progenitor self-renewal

Hsiang-Ying Lee et al. Nature. .

Abstract

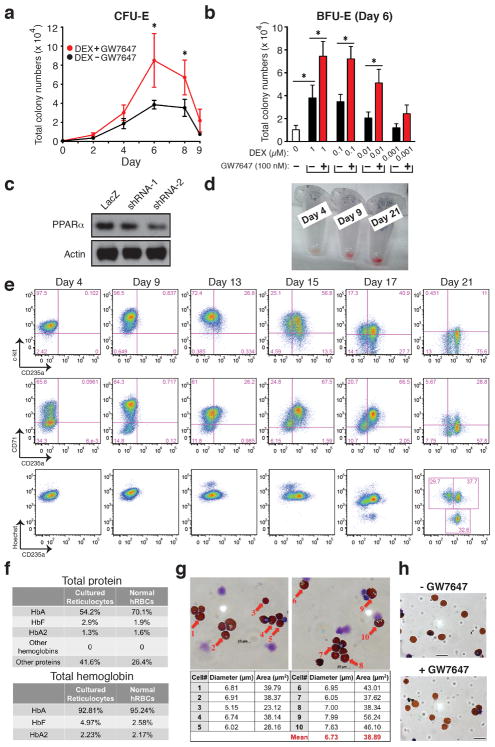
Many acute and chronic anaemias, including haemolysis, sepsis and genetic bone marrow failure diseases such as Diamond-Blackfan anaemia, are not treatable with erythropoietin (Epo), because the colony-forming unit erythroid progenitors (CFU-Es) that respond to Epo are either too few in number or are not sensitive enough to Epo to maintain sufficient red blood cell production. Treatment of these anaemias requires a drug that acts at an earlier stage of red cell formation and enhances the formation of Epo-sensitive CFU-E progenitors. Recently, we showed that glucocorticoids specifically stimulate self-renewal of an early erythroid progenitor, burst-forming unit erythroid (BFU-E), and increase the production of terminally differentiated erythroid cells. Here we show that activation of the peroxisome proliferator-activated receptor α (PPAR-α) by the PPAR-α agonists GW7647 and fenofibrate synergizes with the glucocorticoid receptor (GR) to promote BFU-E self-renewal. Over time these agonists greatly increase production of mature red blood cells in cultures of both mouse fetal liver BFU-Es and mobilized human adult CD34(+) peripheral blood progenitors, with a new and effective culture system being used for the human cells that generates normal enucleated reticulocytes. Although Ppara(-/-) mice show no haematological difference from wild-type mice in both normal and phenylhydrazine (PHZ)-induced stress erythropoiesis, PPAR-α agonists facilitate recovery of wild-type but not Ppara(-/-) mice from PHZ-induced acute haemolytic anaemia. We also show that PPAR-α alleviates anaemia in a mouse model of chronic anaemia. Finally, both in control and corticosteroid-treated BFU-E cells, PPAR-α co-occupies many chromatin sites with GR; when activated by PPAR-α agonists, additional PPAR-α is recruited to GR-adjacent sites and presumably facilitates GR-dependent BFU-E self-renewal. Our discovery of the role of PPAR-α agonists in stimulating self-renewal of early erythroid progenitor cells suggests that the clinically tested PPAR-α agonists we used may improve the efficacy of corticosteroids in treating Epo-resistant anaemias.


Conflict of interest statement

The authors declare no competing financial interests.

Figures

Extended Figure 1
Extended Figure 1. PPARα agonist GW7647 does not have adverse effects on erythroid differentiation and has no effects on CFU-E cells
a, Gene expression changes of nuclear receptors in BFU-E cells from RNA-Seq results published before . b, Flow cytometry analyses of CD71 and Ter119 markers to demonstrate erythroid differentiation of mouse BFU-E cells after 9 days of culture with the indicated additions. c, PPARα gene expression in BFU-E, CFU-E and Ter119+ erythroblasts. BFU-E, CFU-E and Ter119+ erythroid cells were isolated from E14.5 mouse fetal livers as described . Total RNA was purified for quantitative PCR analysis. PPARα gene expression was normalized to mouse 18S rRNA in different stages. (Error bars represent mean ± S.D. from three independent experiments.) d, DNase I hypersensitivity (HS) analysis at PPARα promoter region in different mouse cells from Encode. e, Production of mouse erythroblasts from isolated CFU-E cells. Wild-type mouse CFU-E cells from E14.5 fetal livers were untreated (black line) or treated with DEX (blue line), GW7647 (red line) or fenofibrate (green line). (Error bars represent mean ± S.D. from three independent experiments.) f, Colony forming assays were conducted at 48 hrs after compound treatment to determine BFU-E colony numbers from 100 mouse BFU-E cells cultured under the indicated conditions. (* p < 0.05; Student t test. Error bars represent mean ± S.D. from three independent experiments.) g, At day 3, BFU-E colony numbers from 100 purified mouse BFU-E cells were quantified by colony forming assays. 100 purified mouse BFU-E cells were untreated or treated with DEX alone or DEX in combination with agonists or antagonists targeting PPAR receptors (α, γ or β). BFU-E colonies were quantified after 8 days in culture. (* p < 0.05; ** p < 0.01; Student t test. Error bars represent mean ± S.D. from three independent experiments.) h, Real-time PCR analysis of gene expression in DEX treated and DEX+GW7647 treated wild-type or PPARα−/− mouse BFU-E cells. (* p < 0.05; *** p < 0.001; Student t test. Error bars represent mean ± S.D. from three independent experiments.)
Extended Figure 2
Extended Figure 2. Human CD34+ Erythroid Differentiation System
a, Total CFU-E colonies formed during day 0–9. CFU-E colony numbers were quantified by plating 1000 cells from various time points during day 0–9 of the human CD34+ erythroid culture on methylcellulose. CFU-E colonies were quantified after 12–14 days. Total CFU-E colony numbers in culture under conditions without GW7647 (black line) or with GW7647 (red line) were calculated using the total cell numbers at corresponding time points in Figure 2a. b, Human CD34+ cells were treated at day 1 with 100 nM GW7647 with or without DEX at the concentration indicated in the figure. At day 6, total cell numbers were counted and cells were collected for BFU-E colony assays. c, Protein expression of PPARα demonstrating shRNA knock-down efficiency via lentiviral transduction. LacZ shRNA is used as a control. shRNA-1 and -2 are both specific for PPARα. shRNA-2 has higher knock-down efficiency. d, Cell pellets of 1 million cells demonstrating hemoglobin accumulation during the differentiation process. e, Flow cytometry analyses of erythroid markers during the 21-day human CD34+ erythroid culture. (top row) c-kit vs. CD235a; (middle row) CD71 vs. CD235a. Note the sequential induction of c-kit, CD71 and CD235a, as well as the sequential down-regulation of c-kit and CD71, (bottom row) Enucleated reticulocytes are CD235a+Hoechst, nuclei are CD235aHoechst+, and nucleated erythroblasts are CD235a+Hoechst+. Enucleation rate is 32.6/(32.6+37.7)× 100%= 46.4%. f, Summary of high-performance liquid chromatography (HPLC) results using hemolysates of cultured reticulocytes and normal human RBCs (control). (top) total protein composition of hemolysates. (bottom) hemoglobin composition of hemolysates. Cultured reticulocytes contain more than 90% of adult globins. g, Size measurement of enucleated reticulocytes by both diameter and area. (Scale bar=10μm) h, Benzidine-Giemsa staining of human reticulocytes cultured with or without GW7647. (Scale bar=12μm) (* p < 0.05; Student t test. Error bars represent mean ± S.D. from three independent experiments.)
Extended Figure 3
Extended Figure 3. GW7647 increases erythroid progenitors and CD235a+ cells in RPS19 knock down human progenitor cells
a, Human CD34+ hematopoietic progenitors were transduced with lentivirus encoding GFP and either a scrambled shRNA or an shRNA targeting RPS19. Then transduced cells were treated with or without 100 nM GW7647. After 48 hrs, GFP+ cells were sorted by FACS and plated for BFU-E and CFU-E colony forming assays. RPS19 knocking down efficiency is shown at the bottom. (* p < 0.05; Student t test. Error bars represent mean ± S.D. from three independent experiments.) b. Sorted GFP+ cells were returned to culture with the indicated concentration of GW7647. (Top) Percentage of CD71+ cells at day 9 in was determined by FACS; (Bottom) Percentage of CD235a+ cells at day 21 was determined by FACS. (* p < 0.05; Student t test. Error bars represent mean ± S.D. from three independent experiments.) c. Total cell numbers generated from one GFP positive cell at the indicated times of culture. (* p < 0.05; Student t test. Error bars represent mean ± S.D. from three independent experiments.)
Extended Figure 4
Extended Figure 4. GW7647 improves the anemia in two mouse models of anemia
a, Experimental scheme for phenylhydrazine-induced hemolytic anemia, used also in Figure 3a. Wild-type or PPARα−/− mice were pretreated with DMSO (control) or GW7647 (100 μg/kg) for 3 days (days −3 to −1) before phenylhydrazine (PHZ) injection on day 0. Mice were subject to daily DMSO or GW7647 injections during days 0 – 6. Red arrows indicate days of blood sample collection. b, PPARα−/− mice were treated with DMSO or GW7647 and then injected with PHZ. Hemoglobin (HGB), red blood cell numbers (RBC), and hematocrit (HCT) were measured on the days indicated in panel; (Error bars represent mean ± S.D. from six mice.) c, BFU-E and CFU-E colony forming assays of spleen or bone marrow cells. Wild-type or PPARα−/− mice were treated with PHZ and DMSO (control) or GW7647 (100 μg/kg) as described in the legend to panel a. (* p < 0.05; Student t test. Error bars represent mean ± S.D. from three independent experiments.) d, Spleen and bone marrow cells were harvested. Representative flow cytometry analysis of spleen erythroblasts isolated from GW7647- or DMSO-treated WT mice at day 3 following PHZ injection. FSC-A, forward scatter area.
Extended Figure 5
Extended Figure 5. GW7647 increases BFU-E numbers in Nan/+ mutant mice
a, Corticosteroid levels in serum were measured in WT and Nan/+ mutant mice. Each dot represents one mouse. (* p < 0.05; Student t test. Error bars represent mean ± S.D. from all mice.) b, Increase of BFU-E numbers in spleens from GW7647 treated WT and Nan/+ mutant mice at day 18. (* p < 0.05; Student t test.) c, Total numbers of white blood cells (WBC) and platelets from peripheral blood samples were measured at day 0 and day 18. Each dot represents one mouse. (Error bars represent mean ± S.D. from all mice.)
Extended Figure 6
Extended Figure 6. Bioinformatic analyses of mouse BFU-E cells
a, Genome-wide distribution of GR and PPARα chromatin occupancy sites in BFU-E cells. ChIP-Seq analyses of GR and PPARα occupancy in mouse BFU-E cells isolated from DEX and GW7647 treated wild-type E14.5 fetal livers. TSS, transcription start site. TTS, transcription termination site. UTR, untranslated region. Distal intergenic, regions greater than 3kb from TSS. b, Venn diagram showing overlap between GR and PPARα chromatin occupancy sites. c, De novo motif searching of the overlapped chromatin sites occupied by GR and PPARα. The table depicts transcription factor binding motifs enriched at GR and PPARα overlapping sites relative to genomic background and associated p values. d, Real-time PCR analysis of Pu.1 gene expression in mouse BFU-E cells transduced with virus encoding either LacZ shRNA or Pu.1 shRNA. (* p < 0.05; Student t test. Error bars represent mean ± S.D. from three independent experiments.) e, Colony forming assays were conducted to determine BFU-E colony numbers from 100 mouse BFU-E cells infected with virus encoding either LacZ shRNA or Pu.1 shRNA. Cells were cultured in SFELE medium with or without DEX ± GW7647. Colony forming assays were performed at 48 hrs. (* p < 0.05; Student t test. Error bars represent mean ± S.D. from three independent experiments.)
Extended Figure 7
Extended Figure 7
a, Real-time RT-PCR analysis of Kit gene expression in wild-type and PPARα−/− mouse BFU-E cells untreated or treated with DEX with or without addition of GW7647 (* p < 0.05; Student t test. Error bars represent mean ± S.D. from three independent experiments.); b, Human CD34+ cells were treated with or without GW7647 as described in the legend to Figure 2. (top) At day 9 of culture, cell surface KIT and CD71 expression were analyzed by flow cytometry. (bottom) A representative histogram of KIT expression in cells treated or untreated with GW7647; c, ChIP-Seq occupancy signal map of GR and PPARα across the Kit locus in BFU-E cells.
Extended Figure 8
Extended Figure 8
Pathway analysis of RNA-Seq data of genes that are up- or down-regulated by more than 50%, comparing cultures treated with DEX alone or DEX+GW7647.
Extended Figure 9
Extended Figure 9
a, Quantitative ChIP analysis of GR and PPARα occupancy at Kit and Pparα loci in mouse BFU-E cells following the indicated treatments. Units are arbitrary; signals using rabbit IgG are represented by gray dot lines across the plots (* p < 0.05; ** p < 0.01; Student t test. Error bars represent mean ± S.D. from three independent experiments.). b, Co-immunoprecipitation measuring interaction between GR and PPARα in mouse BFU-E cells isolated from E14.5 fetal livers in wild-type or PPARα−/− mice. BFU-E cells were untreated, or treated with DEX with or without GW7647 with or without GW6471. Whole cell lysates were incubated with anti-GR antibody and immunoprecipitates probed with specific antibodies as indicated. c, Colony forming assays to determine BFU-E colony numbers from 100 mouse BFU-E cells cultured with the indicated treatments. (* p < 0.05; Student t test. Error bars represent mean ± S.D. from three independent experiments.)
Extended Figure 10
Extended Figure 10. Model of synergism between PPARα and GR to promote BFU-E self-renewal
BFU-E cells normally undergo limited self-renewal to generate CFU-Es, which can differentiate into erythroblasts. GR is sequestered in the cytoplasm without GCs such as DEX. Upon GC treatment, liganded GR will be translocated into nucleus and bind to chromatin to regulate gene transcription important for BFU-E self-renewal. PPARα is often recruited to chromatin sites that are in close proximity to GR by GC treatment alone without any function on BFU-E self-renewal. Upon GCs and PPARα agonist co-treatment, activated PPARα interacts with GR to modulate GR transcriptional activity. This leads to enhanced BFU-E self-renewal, and over time generates more CFU-Es and erythroblasts.
Figure 1
Figure 1. PPARα signaling synergizes with glucocorticoid receptor to promote self-renewal of mouse BFU-E erythroid progenitors
a, Wild-type (left) and PPARα−/− (right) BFU-E cells from E14.5 mouse fetal livers were isolated and cultured in SFELE medium with the indicated treatment. Cell numbers were counted every 3 days. b, Mouse BFU-E cells were cultured in DEX ± 10 μM GW7647 as indicated. Total erythroid cell numbers were counted at day 9. c, Colony forming assays were conducted to determine BFU-E colony numbers from 100 mouse BFU-E cells cultured under the indicated conditions. Colony forming assays were performed at 24-hour intervals. Error bars represent mean ± S.D. from three biological replicates; *p<0.05, **p<0.01, ***p<0.001, Student t test.
Figure 2
Figure 2. Activation of PPARα signaling increased erythroid cell expansion in the ex vivo human CD34+ erythroid culture system
a, Human CD34+ cells were cultured as described in Methods. Total cell numbers were quantified. b, BFU-E colony numbers were quantified by plating on methylcellulose 1000 cells at various time points during day 0–9 of the human CD34+ erythroid culture. c, (Left) BFU-E numbers or (Right) total cell number from control or PPARα knockdown human CD34+ cells cultured under the indicated condition were counted; d, Benzidine-Giemsa staining demonstrating cell morphology of the ex vivo human CD34+ erythroid differentiation system. (* p < 0.05; ** p < 0.01; Student t test. Error bars represent mean ± S.D. from three biological replicates.)
Figure 3
Figure 3. PPARα agonist GW7647 is effective in vivo to alleviate anemic symptoms
a, Wild-type mice were pretreated with DMSO or GW7647 (100 μg/kg) for 3 days (days −3 to −1) before PHZ injection on day 0. Mice were subject to daily DMSO or GW7647 injections during days 0 – 6. Hemoglobin (HGB), red blood cell numbers (RBC), and hematocrit (HCT) were measured in wild-type mice on the days indicated in panel. n = 6; b, Nan/+ mutant mice were injected either with DMSO or GW7647 (100 μg/kg) for 18 days. Each dot represents one mouse. (* p < 0.05; ** p < 0.01; *** p < 0.001; Student t test)
Figure 4
Figure 4. PPARα and glucocorticoid signaling pathways regulate a common target gene ensemble
a, Density maps of GR and PPARα ChIP-Seq signals in mouse BFU-E cells. GR-binding peaks were used as the reference to search for corresponding ChIP-Seq signals of PPARα; b, GR and PPARα occupancy across the PPARα locus in BFU-E cells treated as indicated. c, (Left) Protein level of GR, PPARα and β-actin in mouse BFU-E cells treated as indicated. (right) Densitometry quantification of GR and PPARα protein expression levels normalized to β-actin. Experiments were repeated three times (* p < 0.05; ** p < 0.01; Student t test). d, Co-immunoprecipitation demonstrating interaction between GR and PPARα in mouse BFU-E cells.

Similar articles

Cited by

References

    1. Kaushansky KLAM, Beutler E, Kipps JT, Seligsohn U, Prchal TJ. Title of book: Williams Hematology. 8. 2010.
    1. Livingston DH, et al. Bone marrow failure following severe injury in humans. Annals of surgery. 2003;238:748–753. doi: 10.1097/01.sla.0000094441.38807.09. - DOI - PMC - PubMed
    1. Jones KB, Anderson DW, Longmore GD. Effects of recombinant hematopoietins on blood-loss anemia in mice. The Iowa orthopaedic journal. 2005;25:129–134. - PMC - PubMed
    1. Robinson Y, et al. Impaired erythropoiesis after haemorrhagic shock in mice is associated with erythroid progenitor apoptosis in vivo. Acta anaesthesiologica Scandinavica. 2008;52:605–613. doi: 10.1111/j.1399-6576.2008.01656.x. - DOI - PubMed
    1. Zimmerman JL. Use of blood products in sepsis: an evidence-based review. Critical care medicine. 2004;32:S542–547. - PubMed

Publication types

MeSH terms

Associated data