. 2015 May 13;10(5):e0124952.
doi: 10.1371/journal.pone.0124952. eCollection 2015.

Crossmodal integration improves sensory detection thresholds in the ferret

Affiliations

Crossmodal integration improves sensory detection thresholds in the ferret

Karl J Hollensteiner et al. PLoS One. .

Abstract

During the last two decades ferrets (Mustela putorius) have been established as a highly efficient animal model in different fields in neuroscience. Here we asked whether ferrets integrate sensory information according to the same principles established for other species. Since only few methods and protocols are available for behaving ferrets we developed a head-free, body-restrained approach allowing a standardized stimulation position and the utilization of the ferret's natural response behavior. We established a behavioral paradigm to test audiovisual integration in the ferret. Animals had to detect a brief auditory and/or visual stimulus presented either left or right from their midline. We first determined detection thresholds for auditory amplitude and visual contrast. In a second step, we combined both modalities and compared psychometric fits and the reaction times between all conditions. We employed Maximum Likelihood Estimation (MLE) to model bimodal psychometric curves and to investigate whether ferrets integrate modalities in an optimal manner. Furthermore, to test for a redundant signal effect we pooled the reaction times of all animals to calculate a race model. We observed that bimodal detection thresholds were reduced and reaction times were faster in the bimodal compared to unimodal conditions. The race model and MLE modeling showed that ferrets integrate modalities in a statistically optimal fashion. Taken together, the data indicate that principles of multisensory integration previously demonstrated in other species also apply to crossmodal processing in the ferret.


Conflict of interest statement

Competing Interests: The authors have declared that no competing interests exist.

Figures

Fig 1
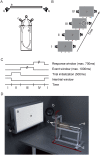
Fig 1. Experimental setup and behavioral task.
(A) Schematic of the components of the experimental setup in a top view: the LED-screen (a) with a speaker (b) on each side, the aluminum pedestal (d), and the three light-barrier-waterspout combinations (c). The semi-circular acrylic tube with a ferret (e) inside was placed on the pedestal. (B) Successive phases in the detection task: The inter-trial window (I), the trial initialization window (II), the event window (III) and the response window (IV). The three circles below each frame represent the light-barriers (white = unbroken, red = broken). The center of the screen displays a static visual random noise pattern. (C) Schematic of trial timing. When the ferret broke the central light-barrier (II) for 500ms a trial was initialized and the event window started (III), indicated by a decrease in contrast of the static random noise pattern. At a random time between 0-1000ms during the event window the auditory and/or visual stimulus appeared for 100ms either left or right from the center. After stimulus offset the ferret had a response time window between +100-700ms (IV) to pan its head from the central position to the light-barrier on the side of the stimulation. Subsequently, the inter-trial screen (I) appeared again. During the whole session the screen’s global luminance remained unchanged. (D) Three-dimensional rendering of the experimental setup. Labeling of the components as in (A).
Fig 2
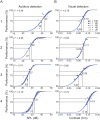
Fig 2. Detection task performance of the unimodal experiment.
(A) Data for performance in the unimodal auditory detection task. (B) Data for the unimodal visual detection task. Each row represents one animal (1–4). Each dot represents the average performance of N trials (diameter) for the tested auditory amplitudes (dB SPL) or visual contrasts (Cm). The data are fitted by a Weibull function. Numbers within the panels indicate the amplitude values corresponding to the 75% and 84% thresholds, respectively. The blue shaded area around the fit indicates the standard deviation. The unmasked parts of the graphs indicate the range of the actually tested stimulus amplitudes.
Fig 3
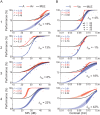
Fig 3. Detection task performance of the bimodal experiment.
(A) Data for the stimulus conditions auditory-only (A) and auditory stimulation supported by a visual stimulus (Av). (B) Data for the stimulus conditions visual-only (V) and visual stimulation supported by an auditory stimulus (Va). Each row represents one ferret (1–4). Each dot represents the average performance of N trials (diameter) at a given auditory amplitude (dB SPL) or visual contrast (Cm). The data are fitted by a Weibull function. The uni- and bimodal fit is represented by the blue and red line, respectively. The shaded area around the fit indicates the standard deviation. Δ84 displays the relative amount of threshold shift of the bimodal compared to the unimodal psychometric function at a performance of 84%. A positive shift indicates a threshold decrease. The black curve represents the MLE model. The unmasked parts of the graphs indicate the range of the actually tested stimulus amplitudes.
Fig 4
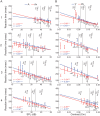
Fig 4. Reaction time data from the bimodal experiment.
(A) Data for the stimulus conditions auditory-only (A) and auditory stimulation supported by a visual stimulus (Av). (B) Data for the stimulus conditions visual-only (V) and visual stimulation supported by an auditory stimulus (Va). Each row represents one ferret (1–4). RT ± SEM are shown as a function of stimulus amplitude (red = bimodal, blue = unimodal). Each data point represents the RT average for all hit trials recorded at that amplitude. Asterisks indicate significant differences between uni- and bimodal conditions (t-test: * = p < 0.05, ** = p < 0.01, *** = p < 0.001). Below each pair of uni- and bimodal RTs the Multisensory Response Enhancement (MRE) is shown as numerical values. In each panel, Pearson correlation coefficient and regression line for both data sets are shown. The two vertical lines mark the borders between the subject intensity classes (left of first line: 0–74%, between the lines 75–89%; right of the second line 90–100% performance).
Fig 5
Fig 5. Race model example.
Analysis of RT CDFs from animal 4. High visual SIC CDFs are shown for unimodal visual stimulation (V, blue), auditory stimulation at 75% (A75%, green), auditory stimulus supported by visual stimulation (Av, red) and the combination of both unimodal CDFs (V+A75%, black). In this case the race model gets rejected, because the empirical bimodal CDF (red) is ‘faster’ than the modeled CDF (black).
Fig 6
Fig 6. Reaction time: race model results.
The RTs were sorted by the SICs (rows) and both modalities (A: audio, B: visual) pooled across all animals. The X-axis displays the cumulative reaction time differences to the race model for each modality (± SEM). A value of 0 at the X-axis corresponds to the prediction from the combination of both unimodal CDF’s. The blue curve displays the unimodal condition, the green curve the RTs at the supportive value and the red curve the bimodal class, respectively.
Fig 7
Fig 7. Reaction time: two-way ANOVA results.
The reaction times (RT) pooled by subjective intensity classes (0–74%, 75–89%, 90–100%). The X-axis displays the three performance classes and the Y-axis shows the RT in milliseconds ± SEM. The solid lines represent the unimodal, the dashed lines the bimodal, red indicates the audio and blue the visual modalities (*: p < 0.05; **: p < 0.01; ***: p < 0.001; Holm-Bonferroni corrected). +++, significant differences between performance classes within each modality (Holm-Bonferroni corrected); red and blue asterisks, significant differences between uni- and bimodal conditions in one performance class (Holm-Bonferroni corrected); green asterisk, significant difference between the two unimodal conditions.

Similar articles

Cited by

References

    1. Alves-Pinto A, Sollini J, Sumner CJ. Signal detection in animal psychoacoustics: analysis and simulation of sensory and decision-related influences. Neuroscience. 2012;220: 215–227. 10.1016/j.neuroscience.2012.06.001 - DOI - PMC - PubMed
    1. Bizley JK, King AJ. Visual influences on ferret auditory cortex. Hear Res. 2009;258: 55–63. 10.1016/j.heares.2009.06.017 - DOI - PMC - PubMed
    1. Bizley JK, Nodal FR, Nelken I, King AJ. Functional organization of ferret auditory cortex. Cereb Cortex N Y N 1991. 2005;15: 1637–1653. 10.1093/cercor/bhi042 - DOI - PubMed
    1. Bizley JK, Nodal FR, Bajo VM, Nelken I, King AJ. Physiological and anatomical evidence for multisensory interactions in auditory cortex. Cereb Cortex N Y N 1991. 2007;17: 2172–2189. 10.1093/cercor/bhl128 - DOI - PMC - PubMed
    1. Chiu C, Weliky M. Spontaneous activity in developing ferret visual cortex in vivo. J Neurosci Off J Soc Neurosci. 2001;21: 8906–8914. - PMC - PubMed

Publication types

LinkOut - more resources