. 2015 May 13;11(5):e1004220.
doi: 10.1371/journal.pcbi.1004220. eCollection 2015 May.

Sharing and Specificity of Co-expression Networks across 35 Human Tissues

Collaborators, Affiliations

Sharing and Specificity of Co-expression Networks across 35 Human Tissues

Emma Pierson et al. PLoS Comput Biol. .

Abstract

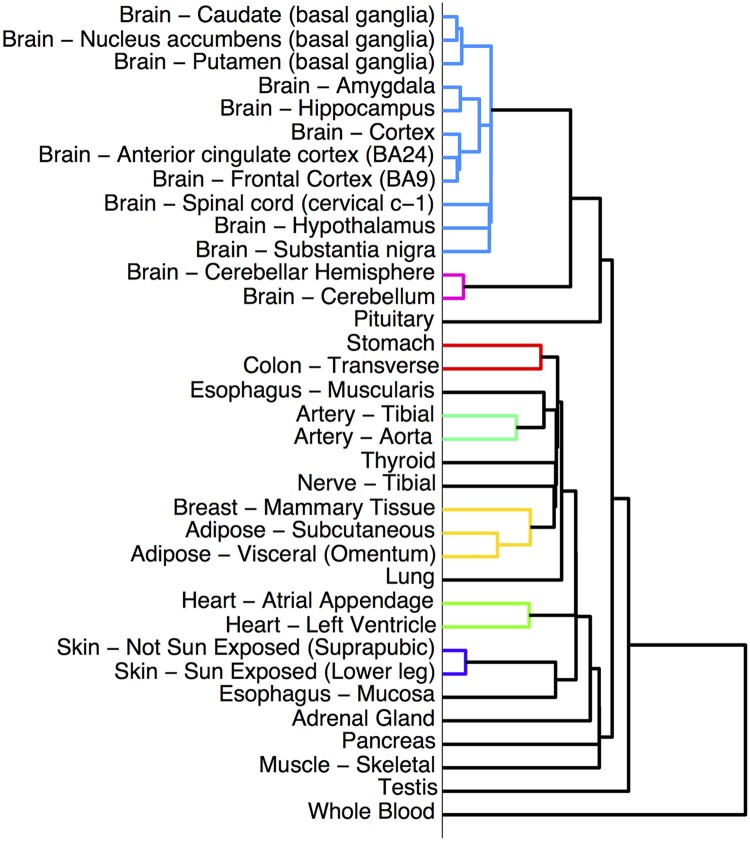
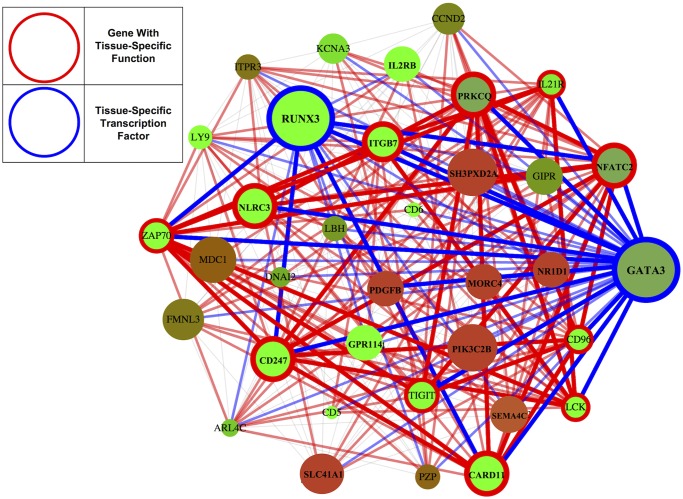
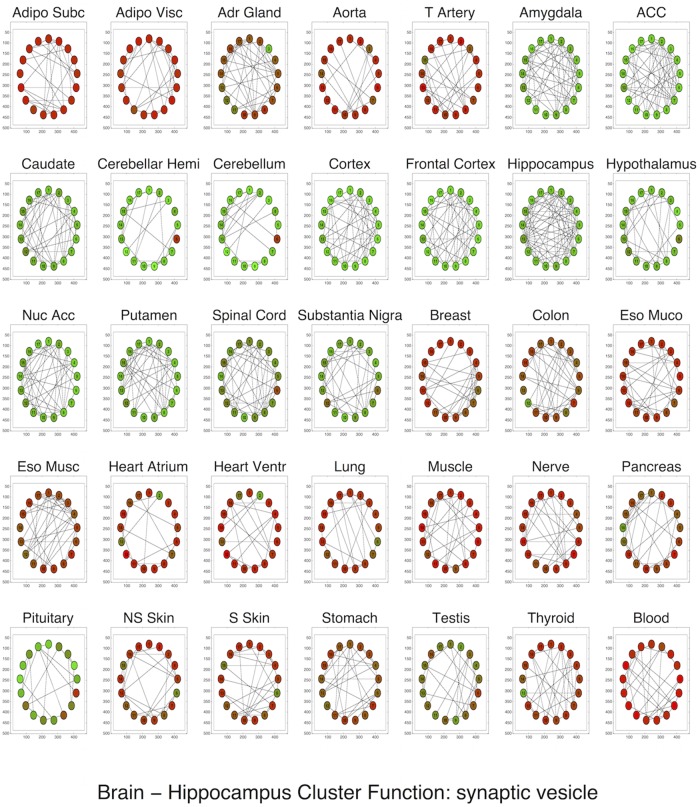
To understand the regulation of tissue-specific gene expression, the GTEx Consortium generated RNA-seq expression data for more than thirty distinct human tissues. This data provides an opportunity for deriving shared and tissue specific gene regulatory networks on the basis of co-expression between genes. However, a small number of samples are available for a majority of the tissues, and therefore statistical inference of networks in this setting is highly underpowered. To address this problem, we infer tissue-specific gene co-expression networks for 35 tissues in the GTEx dataset using a novel algorithm, GNAT, that uses a hierarchy of tissues to share data between related tissues. We show that this transfer learning approach increases the accuracy with which networks are learned. Analysis of these networks reveals that tissue-specific transcription factors are hubs that preferentially connect to genes with tissue specific functions. Additionally, we observe that genes with tissue-specific functions lie at the peripheries of our networks. We identify numerous modules enriched for Gene Ontology functions, and show that modules conserved across tissues are especially likely to have functions common to all tissues, while modules that are upregulated in a particular tissue are often instrumental to tissue-specific function. Finally, we provide a web tool, available at mostafavilab.stat.ubc.ca/GNAT, which allows exploration of gene function and regulation in a tissue-specific manner.


Conflict of interest statement

The authors have declared that no competing interests exist.

Figures

Fig 1
Fig 1. The hierarchy of tissues which is used as the basis for learning networks for each tissue.
The hierarchy was created using hierarchical clustering: for each tissue, the mean expression of each gene in the tissue was computed, and tissues with similar gene expression patterns were merged into clusters. Lower branching points represent clusters with more similar gene expression patterns. Many biologically plausible clusters are apparent: the brain and non-brain cluster, and clusters for the basal ganglia, cortex, adipose tissue, heart, artery, and skin.
Fig 2
Fig 2. An illustration of our algorithm for hypothetical tissues (1, 2, 3, 4) and genes (A, B, C).
The tree represents the hierarchy over tissues 1–4. For each tissue and each internal node in the hierarchy, gene networks over three genes (A, B, and C) are represented by circles (genes) and edges. a) Learning the hierarchy: tissues 1 and 2 are clustered together because A, B, and C have high mean expression levels in both tissues (green) and low levels in tissues 3 and 4 (red). b) co-expression networks are learned in each tissue independently. Edge AB is shared across three tissues; BC and AC only appear in one tissue. c) Networks are learned for each internal node in the hierarchy, representing an “average” of the child node networks, allowing similar tissues to share knowledge. The child node networks are re-learned and encouraged to be similar to their parents; this repeats until convergence. d) The final networks. Edge AB is now present in all 4 tissues; similarly, AC now appears in tissues 1 and 2, and edge BC in tissues 3 and 4.
Fig 3
Fig 3. Network accuracy as measured by 5-fold cross validation.
Learning networks independently corresponds to setting λp = 0 (the bottom left corner of each graph); the y-axis is the improvement in log likelihood over baseline. Our method improved on this baseline for all three gene sets we experimented with. The baseline of learning a single network for all tissues cannot be shown on this graph because its log likelihood is so low; we dropped it from further consideration in our analysis. The differing scales on the y-axes are due to the different sizes of the gene sets.
Fig 4
Fig 4. Important principles of tissue-specificity.
a) Tissue-specific transcription factors (circled in blue) have higher expression levels (green) in tissues they are specific to, and those that change most dramatically in expression are most likely to be essential genes. b) Tissue-specific transcription factors connect to and upregulate genes with tissue-specific function (circled in red), which in turn connect to each other. c) Transcription factors lie at the centers of networks; genes with tissue-specific function and enriched modules lie at the network peripheries. d) Modules shared across tissues are more likely to be enriched for Gene Ontology functions, and tend to have functions common to all tissues like cell division.
Fig 5
Fig 5. Genes linked to the blood-specific transcription factor GATA3 are enriched for immune function.
Blue circles (and links) denote tsTFs; red circles denote tsFXNGs; the color of a gene indicates its level of expression, with green denoting upregulation and red denoting downregulation. This tightly connected cluster of genes comprises the blood-specific TFs GATA3 and RUNX3 (circled in blue) and 11 genes with immune related function (circled in red). GATA3 has been previously linked to RUNX3 [53] and implicated as a master regulator of the immune system [54], required for the maintenance of T cells; consistent with this, the set of genes linked to GATA3 to is significantly enriched for the T cell receptor signaling pathway and the T cell receptor complex (Fisher’s exact test with Bonferroni correction p = .0001 and .01, respectively) with 8 of the top 10 most enriched functions for these genes relating to the immune system.
Fig 6
Fig 6. The most upregulated enriched cluster in the hippocampus, enriched for synaptic vesicle function, shown across all tissues.
Green indicates upregulation of a gene: the cluster is upregulated in all brain tissues (including the pituitary) and downregulated in non-brain tissues.

References

    1. Liang Y., Ridzon D., Wong L., Chen C.: Characterization of microRNA expression profiles in normal human tissues. BMC Genomics 8(1), 166 (2007) 10.1186/1471-2164-8-166 - DOI - PMC - PubMed
    1. Messina D.N., Glasscock J., Gish W., Lovett M.: An ORFeome-based analysis of human transcription factor genes and the construction of a microarray to interrogate their expression. Genome Research 14(10b), 2041–2047 (2004) 10.1101/gr.2584104 - DOI - PMC - PubMed
    1. Yu X., Lin J., Zack D.J., Qian J.: Identification of tissue-specific cis-regulatory modules based on interactions between transcription factors. BMC Bioinformatics 8(1), 437 (2007) 10.1186/1471-2105-8-437 - DOI - PMC - PubMed
    1. Lemon B., Tjian R.: Orchestrated response: a symphony of transcription factors for gene control. Genes & Development 14(20), 2551–2569 (2000) 10.1101/gad.831000 - DOI - PubMed
    1. Schug J., Schuller W.-P., Kappen C., Salbaum J.M., Bucan M., Stoeckert C.J.: Promoter features related to tissue specificity as measured by Shannon entropy. Genome Biology 6(4), 33 (2005) 10.1186/gb-2005-6-4-r33 - DOI - PMC - PubMed

Publication types

Grants and funding