

Review
doi: 10.1021/acs.chemrev.5b00003.
Epub 2015 May 13.
Chemical biology of protein arginine modifications in epigenetic regulation
Affiliations
- PMID: 25970731
- PMCID: PMC4463550
- DOI: 10.1021/acs.chemrev.5b00003
Item in Clipboard
Review
Chemical biology of protein arginine modifications in epigenetic regulation
Chem Rev.
.
No abstract available
Figures
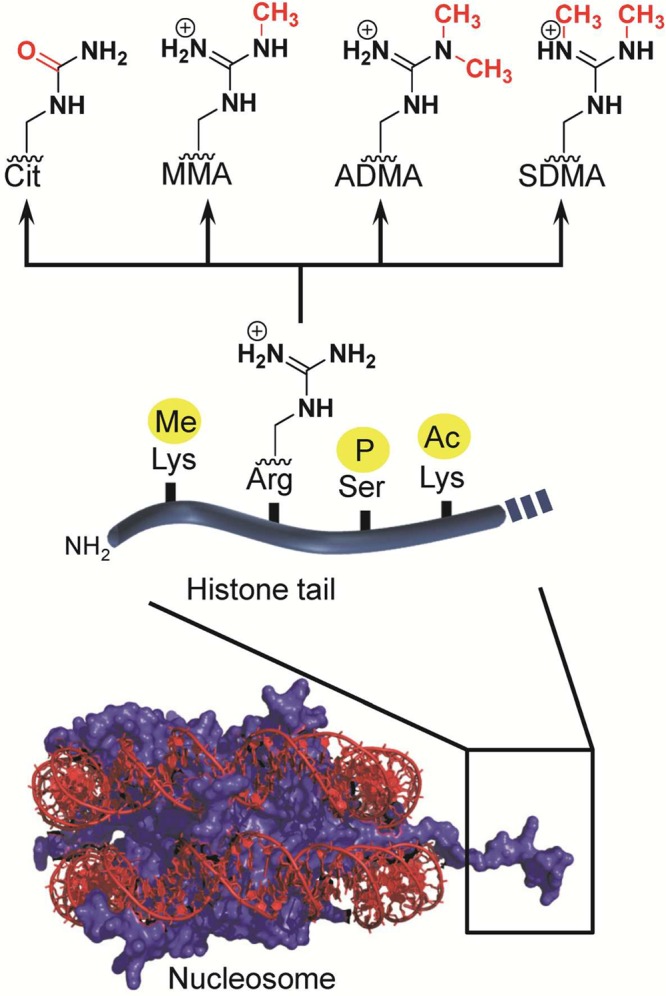
N-terminal
tails of histone proteins are the preferred targets
of histone-modifying enzymes. The major modifications of histone arginine
residues are citrullination and methylation. Abbreviations: Cit, citrulline;
MMA, monomethylarginine; ADMA, asymmetric dimethylarginine; SDMA,
symmetric dimethylarginine.

Bidendate interactions
of the arginine guanidinium group exemplified
by (i) the carboxyl group of aspartate (trypsin–peptide complex,
PDB code 1OX1) (left), (ii) the phosphoryl group of phosphotyrosine (SH2–pTyr,
PDB code 4F5B) (middle), and (iii) atoms O6 and
N7 of guanine (p53–DNA, PDB code 3TS8) (right).
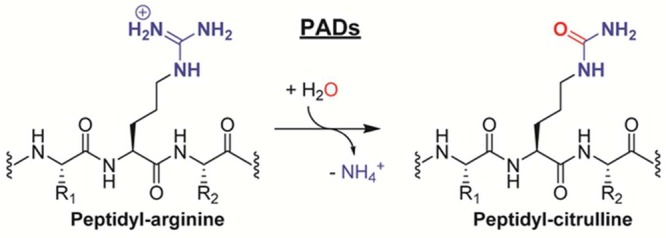
PAD enzymes
catalyze the hydrolytic conversion of peptidyl arginine
residues into citrulline.

Electrostatic surface potential and hydrogen bond donor/acceptor
sites of the side chains of arginine and citrulline. Hydrogen bond
donor sites are highlighted in red, whereas hydrogen bond acceptor
sites are depicted in blue. Cα denotes the α-carbon.
Charge potentials were rendered by using SPARTAN (Wavefunction Inc.),
with negative electrostatic charges shown in red, positive charges
in blue, and neutral charges in green.
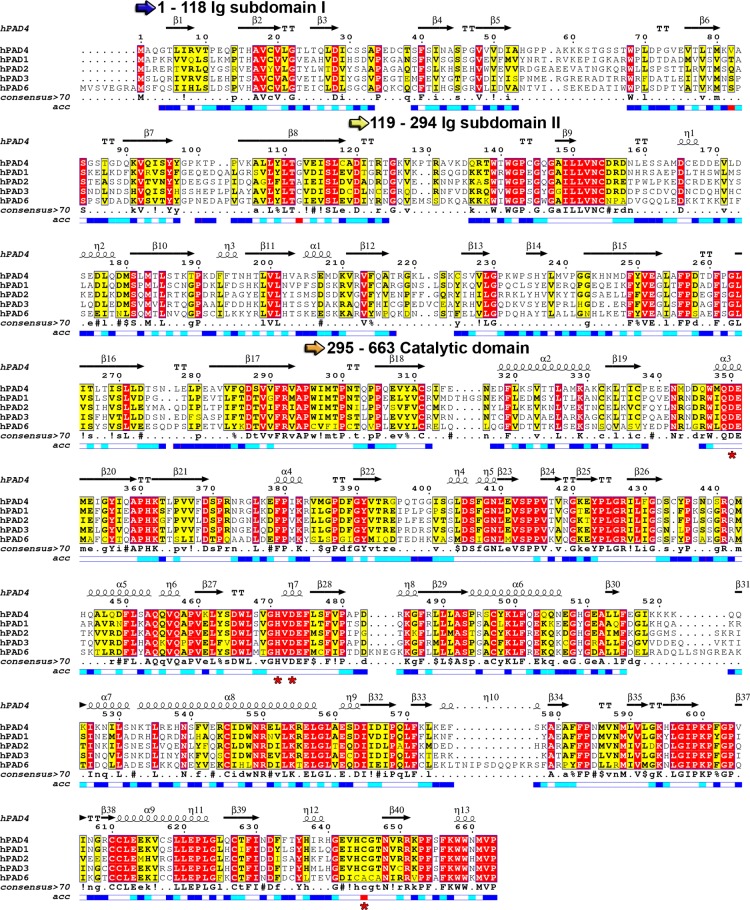
Sequence alignment
of human PAD family members. Catalytic residues
are highlighted with red asterisks below the alignment. The sequence
alignment was generated using Clustal Omega and visualized using Espript
3.0. The consensus sequence is abbreviated
as follows: uppercase letters indicate identical residues, lowercase
letters indicate consensus level >0.5, “!” represents
any conserved residue of isoleucine (I) or valine (V), “$”
represents any conserved residue of leucine (L) or methionine (M),
“%” represents any conserved residue of phenylalanine
(F) or tyrosine (Y), and “#” represents any conserved
residue of asparagine (N), aspartate (D), glutamine (Q), or glutamate
(E). The relative accessibility of each residue is depicted below
the consensus motif: blue indicates accessible residues, cyan marks
intermediately accessible residues, white stands for buried residues,
and red indicates that the accessibility is not predicted.
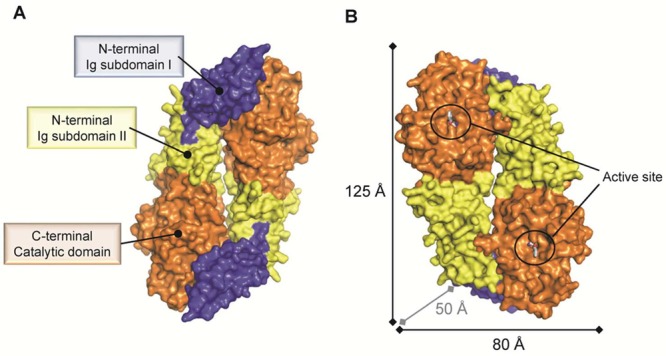
Surface representation
of the dimeric PAD4 C645A mutant bound to
the substrate BAA (PDB code 1WDA). (A) PAD4 exists as a head-to-tail dimeric protein
that comprises three domains as indicated for one protomer. (B) The
catalytic sites of both protomers are located on the same dimer face
and are separated by ∼65 Å. Abbreviation: Ig subdomain,
immunoglobulin-like subdomain.
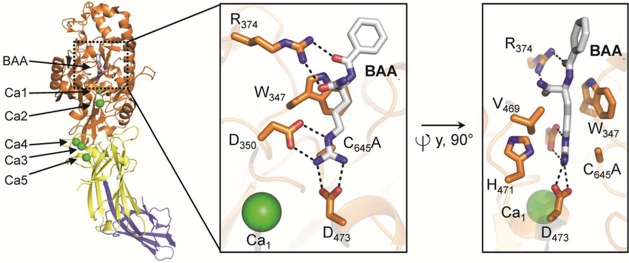
Domain organization and
calcium-binding sites of the PAD4 C645A
protomer bound to the substrate BAA (PDB code 1WDA). The structural
elements are color coded according to Figure 6. The insets on the right depict two orientations of the PAD4 active
site bound to BAA, highlighting critical residues for substrate binding
and catalysis. Polar contacts of <3.5 Å are represented as
dashed lines.
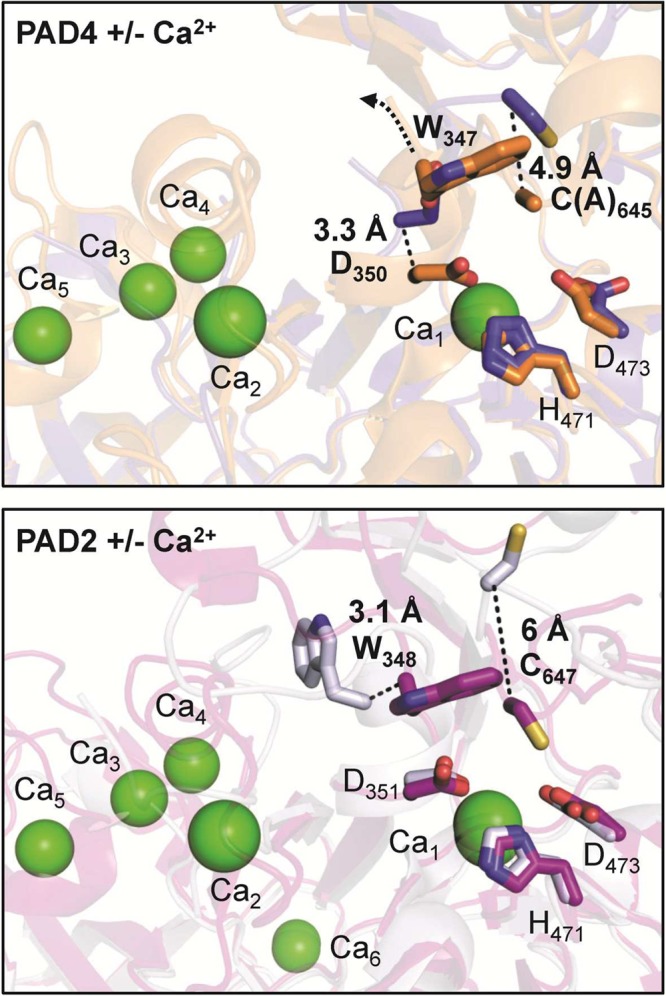
The image on top represents
the structure of PAD4 without Ca2+ (blue) (PDB code 1WD8) superimposed onto
the structure of PAD4 with Ca2+ (orange) (PDB code 1WD9). The image on the
bottom depicts the structure of
apoPAD2 without Ca2+ (gray) (PDB code 4N20) overlaid onto the
structure of holoPAD2 F221/222A mutant with Ca2+ (purple)
(PDB code 4N2C). The movements of active site residues (bold) are highlighted as
dashed lines. Ca2+ ions are illustrated as green spheres,
whereas active site residues are shown as sticks.

Top view of the PAD4 C645A mutant bound to BAA colored according
to its electrostatic surface potential, highlighting two connected
cavities that form a continuous tunnel (orange rod) of ∼21
Å (PDB code 1WDA). The lower image illustrates the side view of the active site cavity
(front door), occupied by BAA, and the back door tunnel, presumably
involved in incoming water channeling and ammonia (product) extrusion.

PAD4 (orange) bound to histone H3 peptide (gray) (PDB
code 2DEW).
Waters are depicted
as red spheres. Adapted with permission from ref (31). Copyright (2006) National
Academy of Sciences, U.S.A.

Proposed catalytic mechanism
for PAD enzymes.

Comparison of PAD4 and
DDAH active site pockets. (A) Active site
of PAD4 with bound BAA (left side) (PDB code 1WDA), bovine DDAH with
bound citrulline abbreviated as Cit (middle panel) (PDB code 2C6Z), and human DDAH
with bound N5-(1-iminopentyl)-l -ornithine abbreviated as LN6 inhibitor (right side) (PDB code 3P8P). All protein structures
are colored according to their electrostatic surface potential. (B)
Bidendate recognition of the substrate arginine guanidinium group
(gray) by the carboxyl groups of PAD4 (orange, PDB code 1WDA) D473 and D350,
left panel. Methylation of the arginine guanidinium group would disfavor
and preclude tight interactions with the aspartate residues, right
panel.
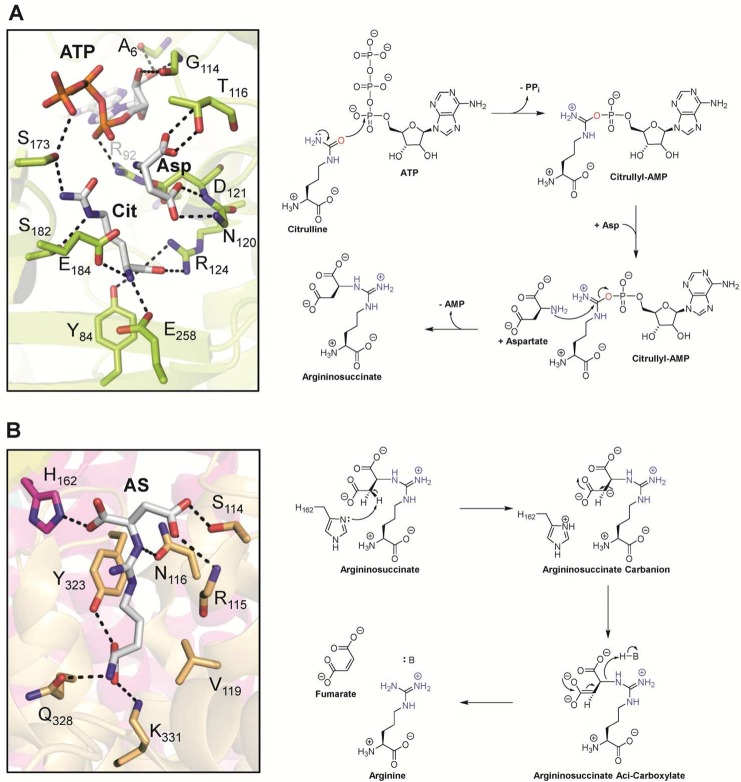
(A) Active site of argininosuccinate
synthetase with bound citrulline,
aspartate, and ATP (PDB 1J1Z) and proposed mechanism. (B) Active site of the argininosuccinate
lyase homologue δ crystalline T161D mutant with bound argininosuccinate
highlighted in gray (PDB 1TJW) and proposed mechanism. Abbreviations: Cit, citrulline;
Asp, aspartate; ATP, adenosine triphosphate; PPi, pyrophosphate;
AMP, adenosine monophosphate, AS, argininosuccinate; H–B, general
acid.
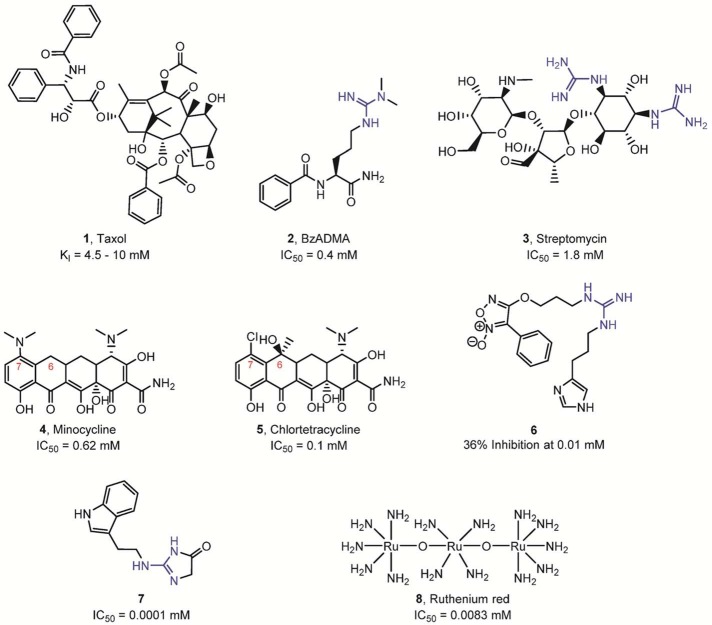
Reversible PAD inhibitors. The presence of a guanidine
group is
highlighted in blue.

(A)
Reversible, mixed-type PAD4 inhibitors. Kis is the dissociation constant for the enzyme–inhibitor
complex. (B) Crystal structure of PAD4 bound to inhibitor 9, GSK199 (PDB code 4X8G). GSK199 (gray) directly interacts with active site residues H471
and D473, and is further stabilized by binding to F634 and N588. Hydrogen
bonds of <3.5 Å are represented as dashed black lines. (C)
The image on the left side depicts the structure of PAD4 (orange)
bound to inhibitor GSK199 (gray, PDB code 4X8G) superimposed onto the structure of PAD4
(green) bound to BAA substrate (green stick model, PDB code 1WDA). Residues 633–640
(red, denoted by α) of PAD4 bound to BAA adopt an α-helical
conformation, while residues 633–645 (yellow, denoted by β)
of PAD4 bound to GSK199 form an antiparallel β-sheet. The image
on the right side compares the binding sites of BAA (green) and GSK199
(gray) mapped onto the structure of PAD4 (PDB code 1WDA), colored according
to its electrostatic surface potential.
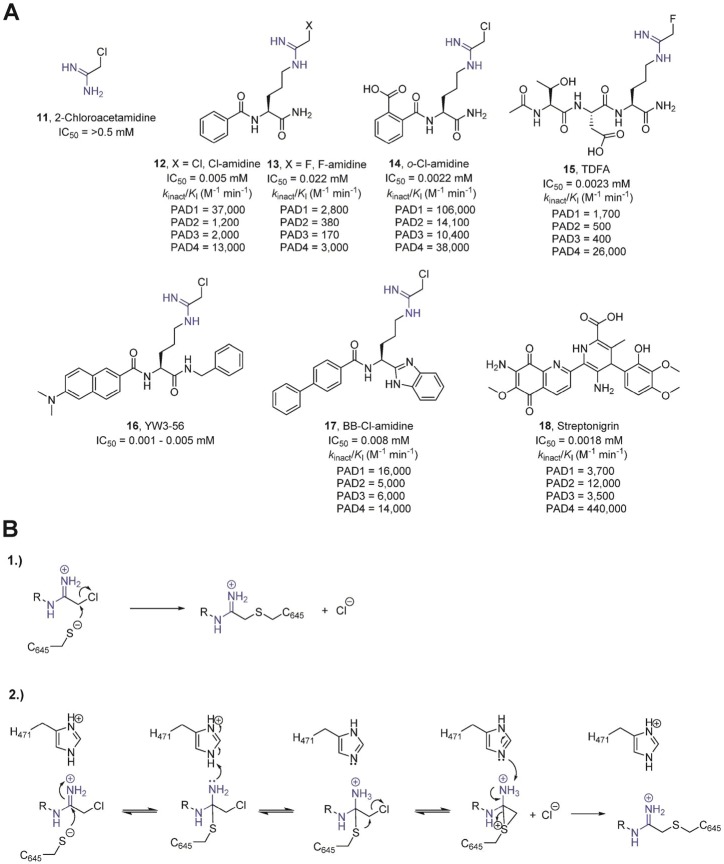
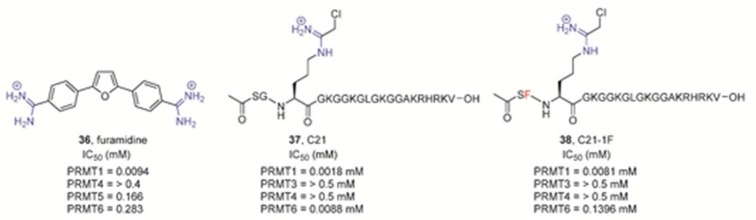
(A) Covalent, irreversible inhibitors of the PADs. The presence
of an amidine group is highlighted in blue. The potency toward the
individual PAD isozymes is represented below the compounds. (B) Potential
mechanisms of PAD inactivation by chloroacetamidine-based inhibitors.
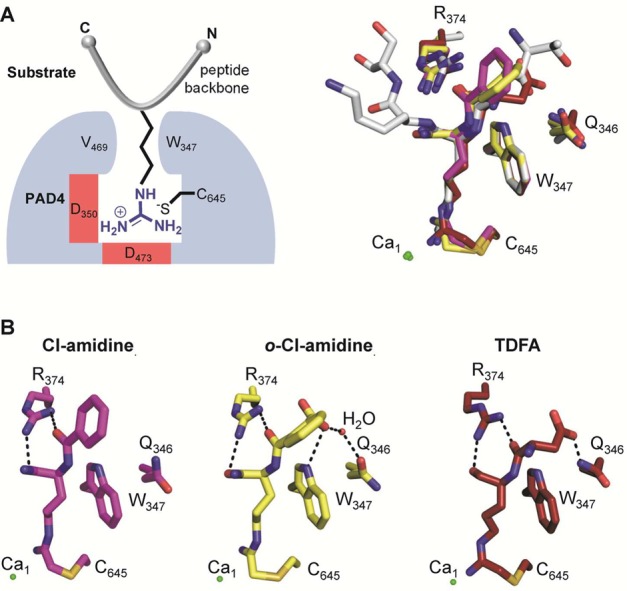
Crystal structures of
PAD4 with inhibitors bound. (A) Schematic
overview of PAD4 (blue) bound to a peptidyl substrate (gray) (left
panel). Structural alignment of inhibitors bound to the active site
of PAD4. The histone H3 peptide (sequence TARKS) bound to PAD4 (gray)
(PDB code 2DEW) is included to compare the substrate-binding site. The Cl-amidine
(magenta) (PDB code 2DW5), o-Cl-amidine (yellow) (PDB code 3B1T), and TDFA (red)
(PDB code 4DKT) structures are aligned accordingly, including the depiction of
critical PAD4-interacting residues. (B) Close-up view of PAD4 with
bound inhibitors, highlighting critical inhibitor backbone interactions
with PAD4 residues shown as dashed lines. Interactions between the
amidine group as well as the α-amine of the inhibitor and PAD4
are omitted for clarity.

ABPP probes for PADs.
(A) Structures of PAD-selective probes. The
amidine group is highlighted in blue, whereas the reporter tags (rhodamine
or biotin) are marked in red. (B) Schematic overview of fluorescence
polarization assay using the PAD4-specific RFA probe.
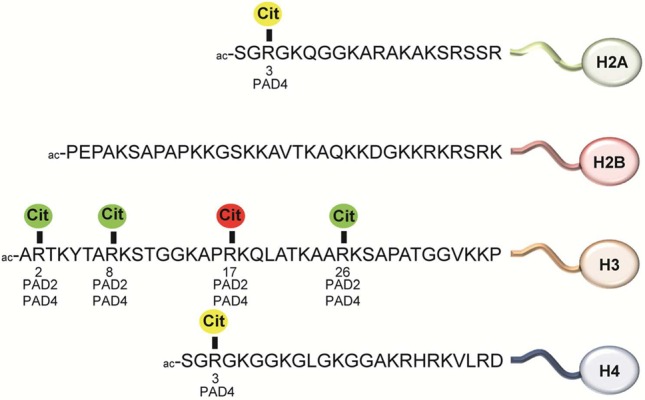
Citrullination
sites in histone proteins. Color code: green, gene
activation; red, gene repression; yellow, gene activation or repression,
or unknown.
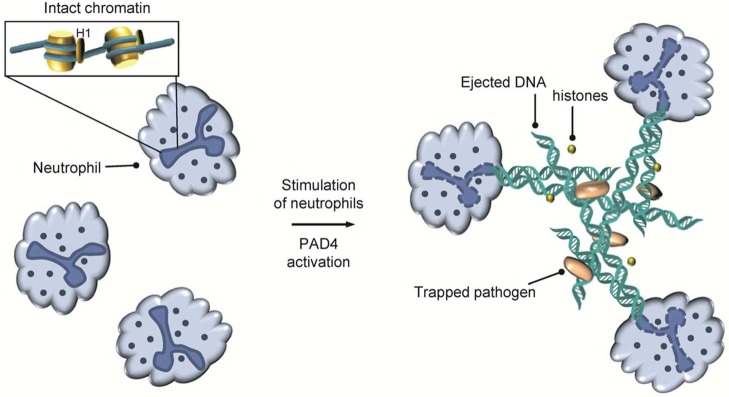
NET formation in neutrophils.
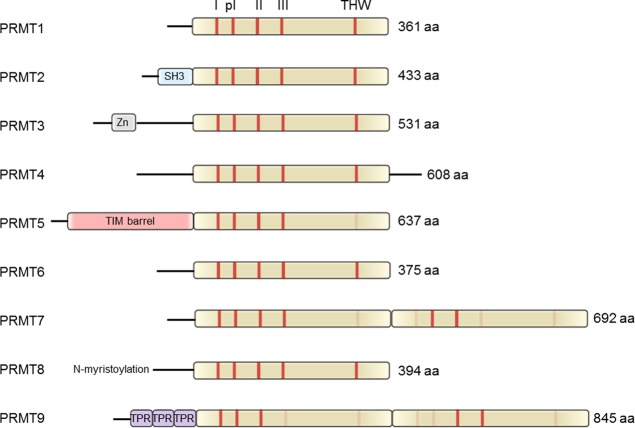
Schematic
depiction of the human PRMT family. The SAM-binding methyltransferase
region is highlighted in olive green. All family members contain the
methyltransferase signature motifs I, post-I, II, and III and the
conserved THW loop, labeled as red bars, respectively. Sequence motifs
with low or no sequence similarity are depicted in light red. Abbreviations:
SH3, SH3 domain; Zn, zinc finger motif; TPR, tetratricopeptide repeat.

PRMTs are
SAM-dependent enzymes that catalyze the transfer of methyl
groups onto peptidyl arginine residues. There are three types of PRMTs
that are classified according to the site of modification. Type I
enzymes generate asymmetric dimethylations, type II enzymes form symmetric
dimethylations, and the type III enzyme PRMT7 only catalyzes monomethylation
reactions.

(A) Electrostatic surface
potential and hydrogen-bonding donor
sites of the side chain of arginine, and the methylated arginine side
chains of MMA, ADMA, and SDMA. Cα denotes the α-carbon.
Charge potentials were rendered by using SPARTAN (Wavefunction Inc.),
with negative electrostatic charges shown in red, positive charges
in blue, and neutral charges in green. (B) Distinct stereoisomers
for MMA and SDMA. Methyl groups are highlighted in yellow, whereas
hydrogen-bonding donor sites are marked in red. Stereoisomers emerging
from rotation around the central Cζ–Nε bond are omitted for simplicity.

Sequence alignment of
the SAM-binding methyltransferase region
of human PRMT family members. The product specificity-determining
residue is highlighted with a blue asterisk below the alignment. Catalytic
residues located on the double E-loop are highlighted with red asterisks
below the alignment. The sequence alignment was generated using Clustal
Omega and visualized using Espript 3.0. The relative accessibility of each residue is depicted below the
consensus motif: blue indicates accessible residues, cyan marks intermediately
accessible residues, white stands for buried residues, and red indicates
that the accessibility is not predicted.
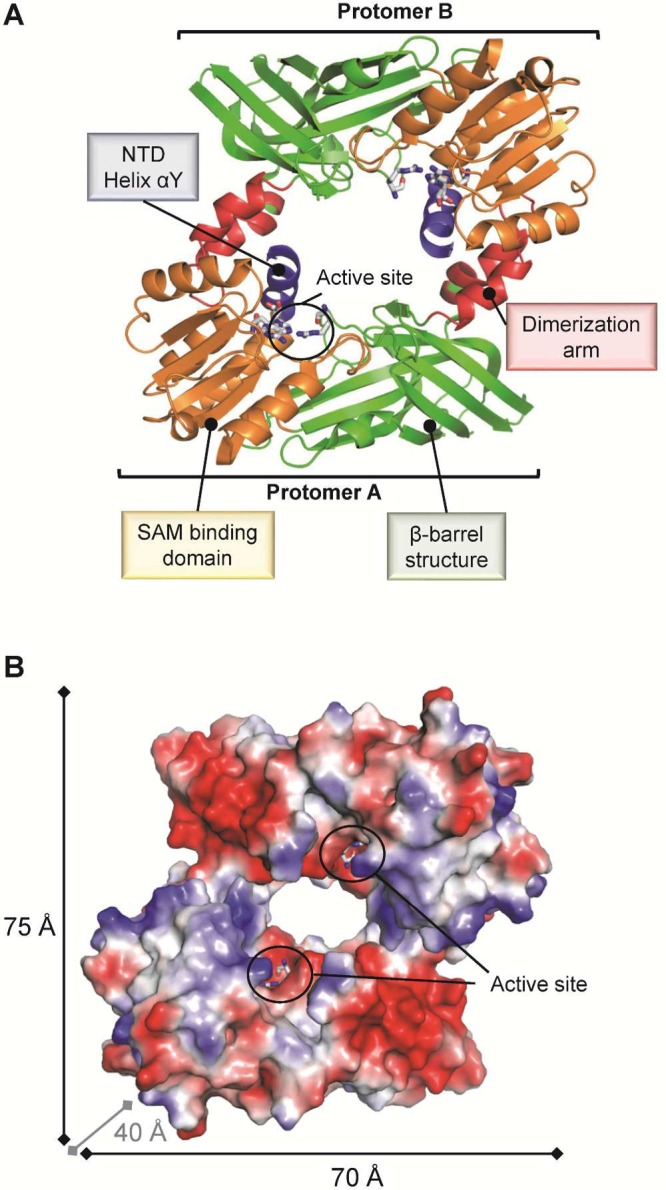
(A) PRMT1 exists as a head-to-tail dimeric protein that comprises
four characteristic functional regions, as indicated (PDB code 1OR8). (B) Surface representation
of dimeric PRMT1 colored according to its electrostatic surface potential.
The catalytic sites of both protomers are located on the same dimer
side and are facing each other, separated by ∼30 Å.

Homodimeric PRMT1 contains two active
sites and a central hole
(PDB code 1OR8). Monomeric PRMT7 from Mus musculus harbors only one active site and does not possess a central hole
(PDB code 4C4A). Homodimeric PRMT7 from T. brucei contains two active sites and does not possess a central hole (PDB
code 4M37).
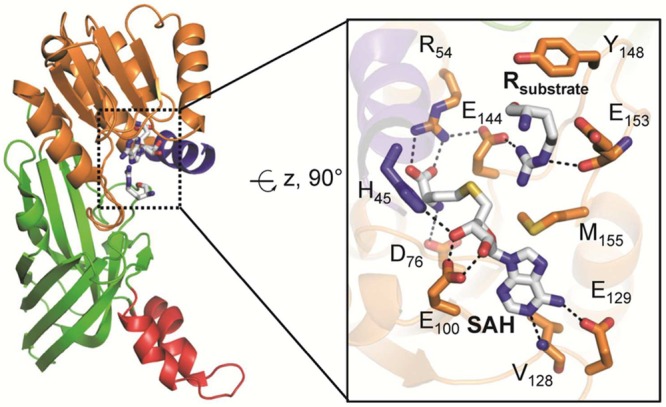
Active site architecture of PRMT1 bound
to arginine (PDB code 1OR8). The structural
elements are color coded according to Figure 25. The image on the right depicts details of the PRMT1 active site,
highlighting critical residues for substrate binding and catalysis.
Polar contacts of <3.5 Å are represented as dashed lines.
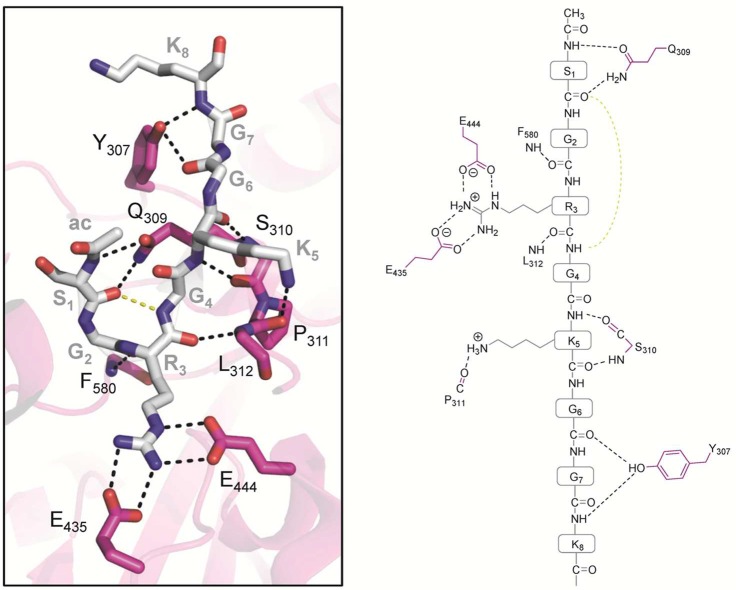
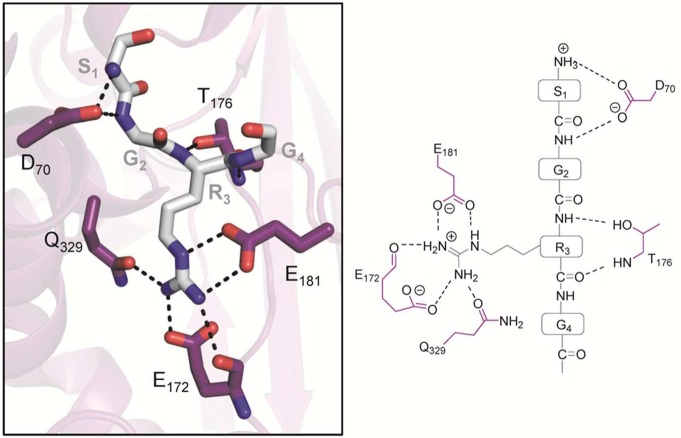
PRMT5·MEP50 (pink) complex bound to histone H4 peptide
(gray)
(PDB code 4GQB). Polar contacts of <3.5 Å are represented as dashed lines.
The highly conserved active site glutamate residues Glu435 and Glu444,
forming the double E-loop, bind to the substrate guanidinium group.
The hydrogen bond (highlighted in yellow dashed lines) between the
carbonyl oxygen of S1 and the amide nitrogen of G4 stabilizes the
β-turn conformation. Abbreviation: ac, N-terminal acetylation.
PRMT7 (purple) from T. brucei bound
to histone H4 peptide (gray) (PDB code 4M38). Polar contacts of <3.5 Å are
represented as dashed lines.
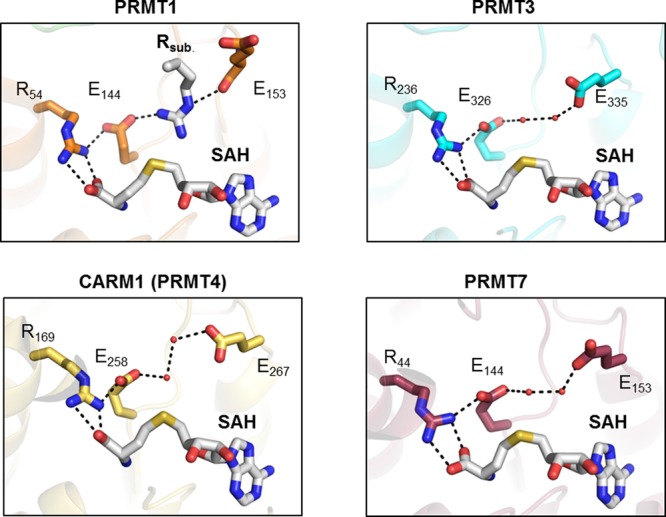
Structural representation of the active site of rat PRMT1
(PDB
code 1OR8),
rat PRMT3 (PDB code 1F3L), rat PRMT4 (PDB code 3B3F), and mouse PRMT7 (PDB code 4C4A). All structures
contain a bound cofactor (SAH, highlighted in gray). Abbreviation:
Rsub, substrate arginine.

Structural comparison of the active site of rat PRMT1 bound to
SAH and substrate arginine (PDB code 1OR8) and human PRMT5 bound to sinefungin
and histone H4 peptide substrate (PDB code 4GQB).

Structural comparison of the active site pocket of C. elegans PRMT5 bound to SAH (PDB code 3UA3) and rat PRMT4 (CARM1)
bound to SAH (PDB code 3B3F). The lower images depict the putative model of the
enzyme active site pockets bound to its products, represented by SAH
and SDMA in the case of PRMT5 or SAH and ADMA for PRMT4.
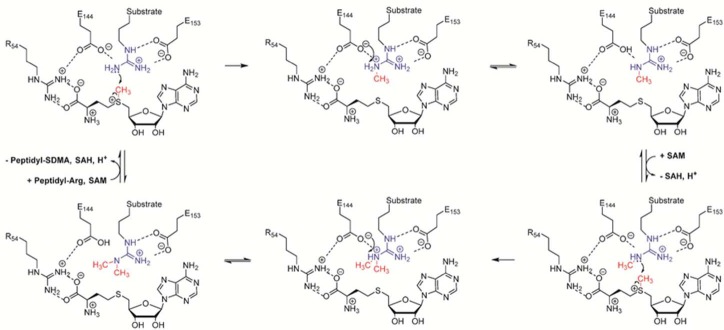
Proposed catalytic mechanism for type I PRMT enzymes, exemplified
by PRMT1.
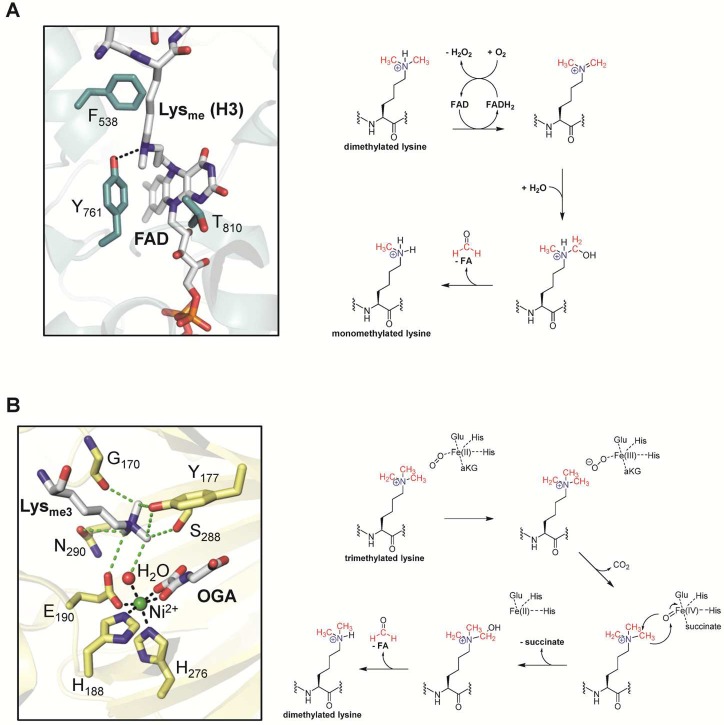
Mechanisms of lysine
demethylation. (A) Active site of human LSD1
with bound FAD attached to the mechanism-based histone 3 peptide inhibitor N-methylpropargyl-K4 H3 (PDB 2UXN) and proposed
mechanism. Note that the covalent inhibitor was further reduced using
NaBH4. (B) Active site of the JMJD2A with bound H3K9me3,
nickel, and N-oxalylglycine that both mimic the actual
iron and α-ketoglutarate cofactors, highlighted in green and
gray, respectively (PDB 2OQ6), and proposed mechanism.
Green dashed lines represent CH···O hydrogen bonds.
Abbreviations: FAD, flavin adenine dinucleotide; FADH, reduced flavin
adenine dinucleotide; FA, formic acid; aKG, α-ketoglutarate;
OGA, N-oxalylglycine.

Schematic overview of
writers and readers of histone arginine methylation.
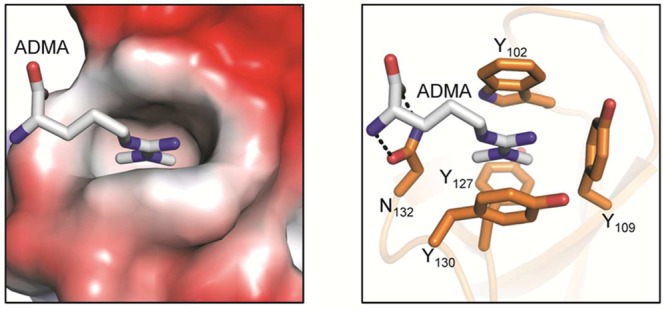
SMN Tudor domain bound to the asymmetric dimethylated
arginine
residue (PDB code 4A4G). The left panel illustrates the Tudor domain colored according
to its electrostatic surface potential. The image on the right highlights
the ADMA-interacting residues that form a hydrophobic cage around
the methylated guanidinium group.
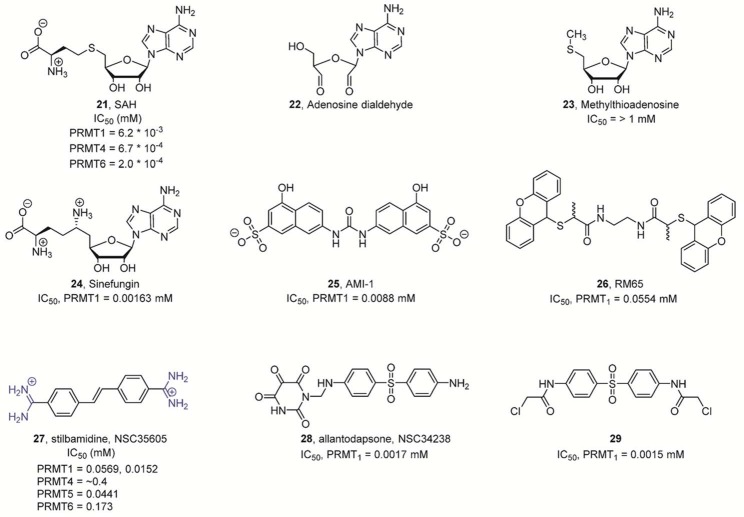
Nonselective PRMT inhibitors. Note that adenosine dialdehyde (22) and AMI-1 (25) are both not direct PRMT inhibitors.
Adenosine dialdehyde blocks the activity of SAH hydrolase, which induces
an increase in SAH levels, thereby inhibiting PRMT activity. AMI-1
binds to the histone substrates and prevents recognition by the PRMT
enzyme.
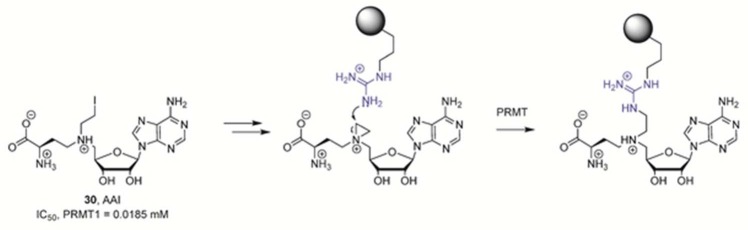
SAM derivative AAI is transformed in situ to generate
a bisubstrate
PRMT inhibitor. The gray sphere denotes a peptidyl arginine substrate.
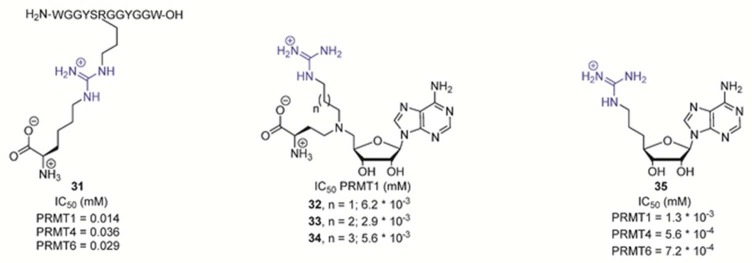
Bisubstrate-based PRMT inhibitors.
PRMT1-selective
inhibitors.
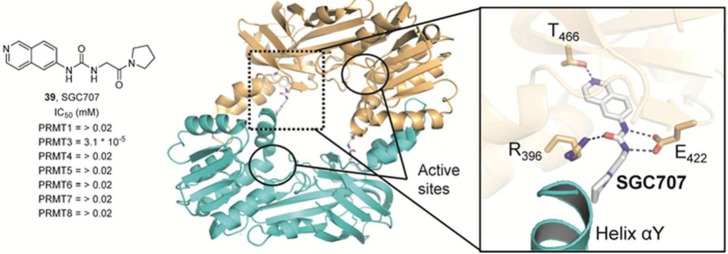
Allosteric
PRMT3 inhibitor SGC707. Crystal structure of dimeric
PRMT3 bound to inhibitor 39 (PDB code 4RYL). SGC707 (gray)
binds an allosteric site located at the interface between two PRMT3
protomers. Hydrogen bonds of <3.5 Å are represented as dashed
black lines.

PRMT4 (CARM1)-selective
inhibitors. The top panel illustrates the
structural characterization of the indole inhibitor 40 bound to PRMT4 (PDB code 2Y1W). The lower image represents the crystal structure
of PRMT4 bound to the pyrazole inhibitor 41 (PDB code 2Y1X). Dashed green lines
indicate CH···O hydrogen bonds, whereas other polar
contacts of <3.5 Å are represented as dashed black lines.
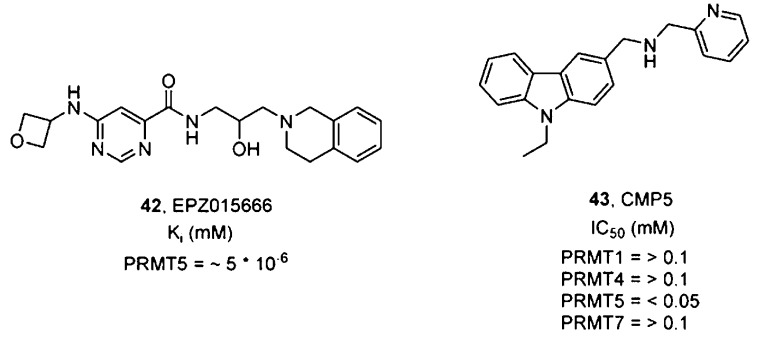
PRMT5-selective inhibitors.
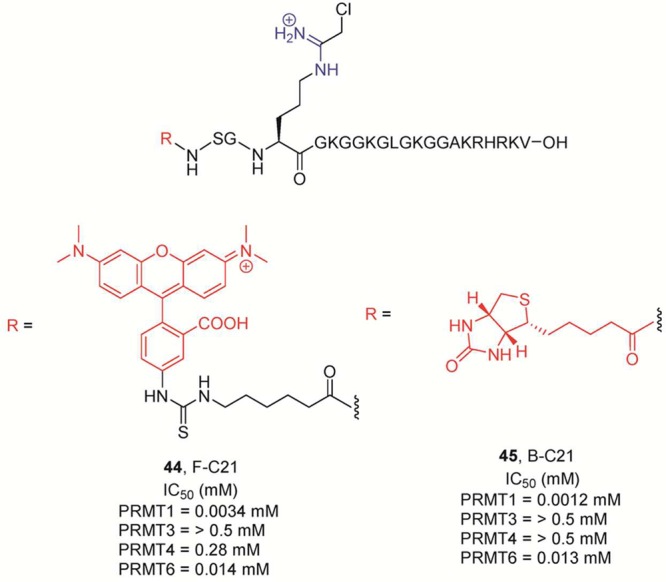
Probes
for PRMT1. The amidine group is highlighted in blue, whereas
the reporter tags (biotin or fluorescein) are marked in red. IC50 values for the PRMTs were determined after incubation of
the enzyme with 15 μM 14C-methyl-SAM for 10 min at
37 °C.
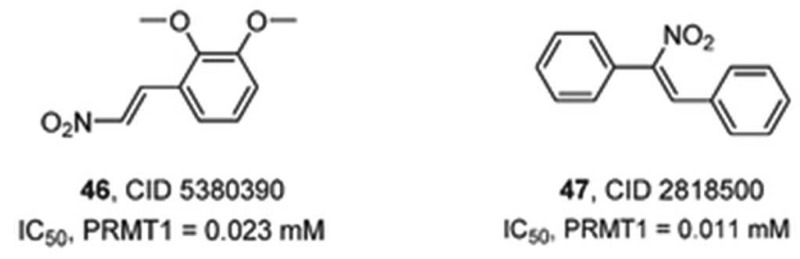
Nitroalkenes
as cysteine-reactive PRMT1 inhibitors.

Arginine
methylation sites in histone proteins. Abbreviations:
a, asymmetric dimethylation; s, symmestric dimethylation; m, monomethylation.
Color code: green, gene activation; red, gene repression; yellow,
gene activation or repression, or unknown.
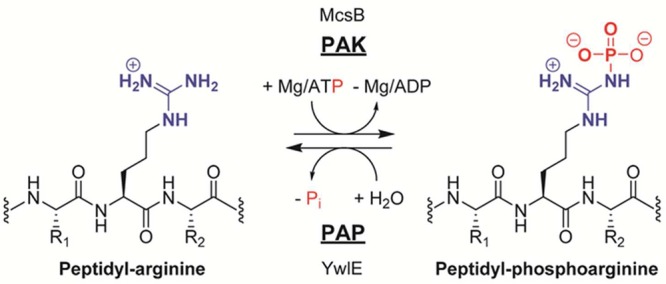
Protein arginine kinase McsB transfers the γ-phosphoryl
group
from ATP onto the arginine guanidinium group. The generated phosphoarginine
residue can be hydrolyzed by the protein arginine phosphatase YwlE.

(A) Active site of l -arginine
kinase with bound ADP, nitrate,
and l -arginine (PDB code 1BG0) and proposed reaction mechanism. Note
that several arginine residues were omitted in the proposed reaction
scheme for clarity. (B) Active site of YwlE C7S with bound peptidyl
arginine and containing a phosphorylated S7 residue, which mimics
the thiophosphate reaction intermediate generated after the first
SN2 reaction (PDB code 4KK4). Residue R149* originates from a symmetry-equivalent
molecule. Polar contacts of <3.5 Å are represented as dashed
lines. The proposed catalytic mechanism for the PAP enzyme YwlE is
shown on the right side. The guanidinium group of the incoming phosphoarginine
substrate is colored in blue, whereas the phosphoryl group is shown
in red.
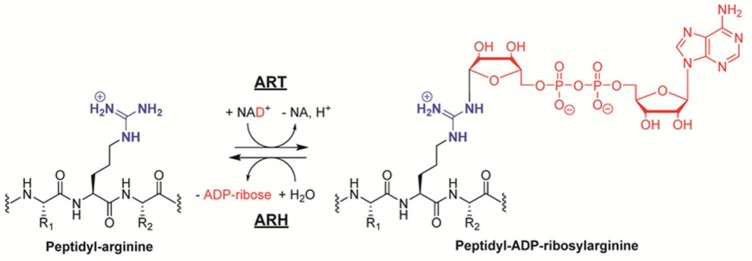
Generation of ADP-ribosylated
arginines is catalyzed by ART enzymes,
while the hydrolysis of peptidyl ADP-ribosylated arginine residues
is mediated by ARH enzymes.

Post-translational addition of arginine residues is catalyzed by
ATE1.
References
-
- Ruthenburg A. J.; Allis C. D.; Wysocka J. Methylation of lysine 4 on histone H3: intricacy of writing and reading a single epigenetic mark. Mol. Cell 2007, 25115–30. - PubMed
-
- Kouzarides T., SnapShot: histone-modifying enzymes. Cell 2007, 131 (4). - PubMed
-
- Tan M.; Luo H.; Lee S.; Jin F.; Yang J. S.; Montellier E.; Buchou T.; Cheng Z.; Rousseaux S.; Rajagopal N.; Lu Z.; Ye Z.; Zhu Q.; Wysocka J.; Ye Y.; Khochbin S.; Ren B.; Zhao Y. Identification of 67 histone marks and histone lysine crotonylation as a new type of histone modification. Cell 2011, 14661016–28. - PMC - PubMed
Publication types
MeSH terms
Substances
Grants and funding
LinkOut - more resources
Full Text Sources
Other Literature Sources
