Review
. 2015 Aug;24(8):1193-209.
doi: 10.1002/pro.2696. Epub 2015 May 27.

Chemical cross-linking and native mass spectrometry: A fruitful combination for structural biology

Affiliations
Review

Chemical cross-linking and native mass spectrometry: A fruitful combination for structural biology

Andrea Sinz et al. Protein Sci. 2015 Aug.

Abstract

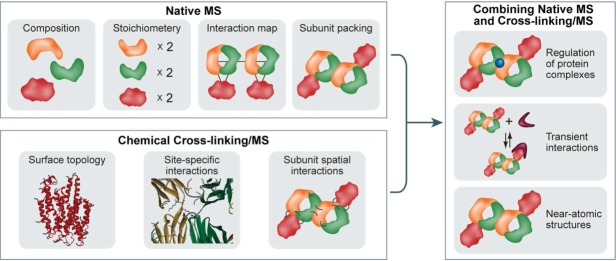
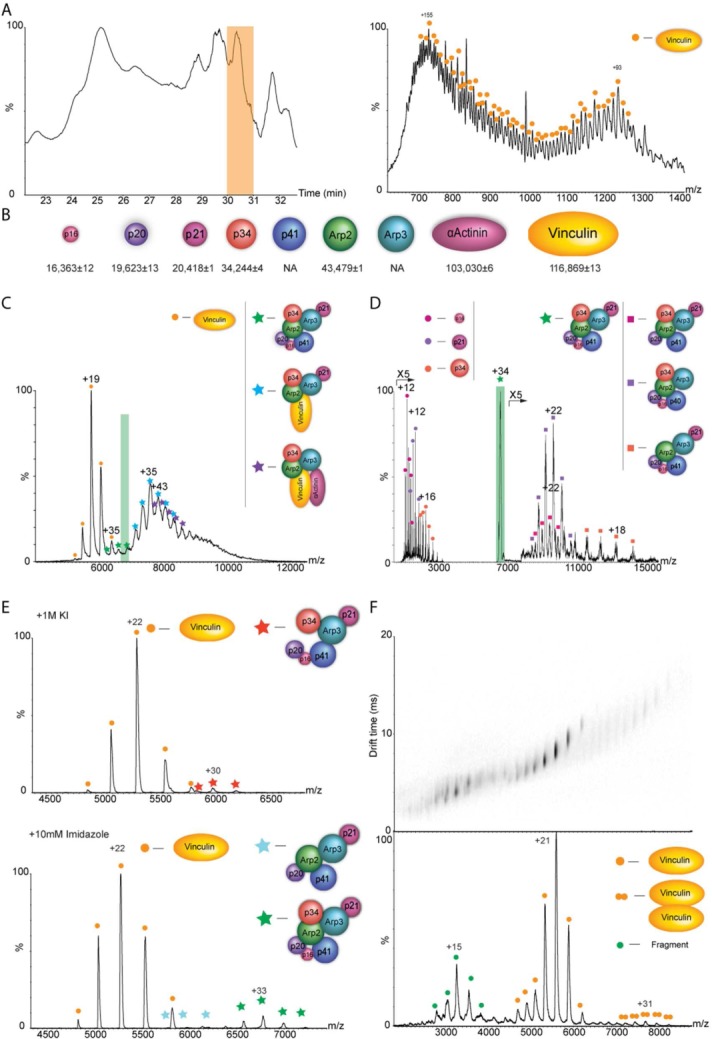
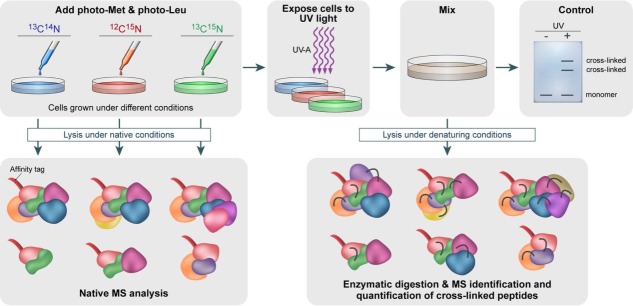
Mass spectrometry (MS) is becoming increasingly popular in the field of structural biology for analyzing protein three-dimensional-structures and for mapping protein-protein interactions. In this review, the specific contributions of chemical crosslinking and native MS are outlined to reveal the structural features of proteins and protein assemblies. Both strategies are illustrated based on the examples of the tetrameric tumor suppressor protein p53 and multisubunit vinculin-Arp2/3 hybrid complexes. We describe the distinct advantages and limitations of each technique and highlight synergistic effects when both techniques are combined. Integrating both methods is especially useful for characterizing large protein assemblies and for capturing transient interactions. We also point out the future directions we foresee for a combination of in vivo crosslinking and native MS for structural investigation of intact protein assemblies.

Keywords: chemical cross-linking; native mass spectrometry; protein 3D structure; protein-protein interactions.


Figures

Figure 1
Figure 1
Advancing structural investigation of large protein assemblies by integrating native MS and chemical crosslinking MS. The analysis of the intact protein complexes by native MS can provide information on the composition, stoichiometry, subunit architecture, and topological organization of an assembly. Chemical crosslinking/MS can probe protein surface topology, reveal specific protein–protein interaction sites, and map the intermolecular subunit contacts of protein complexes. Consequently, “marrying” these two complementary approaches and using the structural data provided by each method will facilitate investigations of challenging protein systems: for example, dynamic assemblies or proteins that are not amenable to high-resolution structural techniques such as X-ray crystallography or NMR. Here, this combination is demonstrated for studying interaction between a large multisubunit complex and a relatively small protein, for characterizing labile protein interactions, and for generating 3D, near-atomic models, when combined with computational modeling.
Scheme 1
Scheme 1
Reaction of amine-reactive NHS esters, exemplified for BSG (upper panel). Reaction products with proteins include (A) interpeptide crosslinks, (B) intrapeptide crosslinks, and (C) “dead-end” crosslinks, that is, peptides that are modified by a partially hydrolyzed crosslinker.
Scheme 2
Scheme 2
Structure of MS/MS cleavable crosslinkers. (A) “urea-linker” and (B) DSSO.
Figure 4
Figure 4
The presentation of full-length p53 in DNA-free state in a crossshaped structure according to a previously published SAXS model. DNA-binding domain (DBD; cyan and light green) and tetramerization domain (Tet.; red) are displayed in cartoon representation, connecting linkers (gray), N-termini (salmon), and C-terminal regulatory domains (yellow) are presented in spacefill mode. The crosslinking distances (in Å) are given for the most likely crosslinked residues. It should be noted that crosslinks (numbered 1–16) are presented for both monomers M1 and M2. Right-hand side: intermolecular crosslinks (red dotted lines) in simplified representation; left-hand side: in full represenation. Reprinted with permission from Arlt C, et al., Proteomics, 2015.
Figure 5
Figure 5
The cytoskeleton protein vinculin forms hybrid complexes with components of the Arp2/3 actin polymerization complex as revealed by native MS analysis. Cytoskeleton-related complexes from chicken gizzard smooth muscle were subjected to purification by stepwise ammonium sulfate precipitation, gel filtration, and anion exchange columns. The fraction that contained vinculin, α-actinin, and all seven subunits of the Arp2/3 protein complex, based on proteomic MS analysis, was further characterized by native MS. (A) Initially, the precise mass of protein components was determined by using a monolithic column-based approach in which protein constituents were separated prior to MS on an LC system using a monolithic column under denaturing conditions. A small portion of the flow was directed online into the mass spectrometer, for mass measurements of intact proteins and the remaining flow was fractionated for subsequent proteomic analysis. A representative chromatogram of the LC separation is shown on the left in which the peak representing the elution of vinculin is highlighted in yellow. The resulting ESI-QTOF mass spectrum of vinculin is shown on the right. (B) This approach together with MS/MS analysis enabled us to relate the specific subunit sequences with intact masses of almost all proteins within the sample as shown in the diagram. (C) Mass spectrum of the selected fraction recorded under native conditions. The predominant species detected, within the m/z range 5000–6800, is assigned to monomeric vinculin. Additional charge states, which correspond in mass to three coexisting protein complexes, are observed between m/z of 7000 and 11,000. The masses of these complexes indicate the presence of intact Arp2/3, a vinculin-associated Arp2/3 complex, and a vinculin-α actinin-associated Arp2/3 complex. (D) Validation of the complexes’ composition was undertaken by means of MS/MS; an example of a selected charge states is shaded in purple (D). The isolated peak is labeled with a star. Circles denote the released subunits and squares correspond to the remaining stripped complex. The MS/MS spectrum shows the dissociation products of ions isolated at m/z of 6917. Charge states above m/z of 7000 correspond to “stripped” Arp2/3 complexes. Individual Arp2/3 subunits, p16, p21, and p34 are observed at the low m/z values. (E) To enhance the structural characterization, subcomplexes were generated by manipulating the pH, increasing the ionic strength, or adding organic solvents to the buffer and subsequently acquiring MS and MS/MS data. Here, we show the effects of adding either 1M of KCl (top panel) or 10 mM of imidazole (bottom panel) to the sample and measuring the corresponding MS data. (F) To examine the topology of vinculin dimers, the recombinant protein was subjected to IM analysis. The figure shows the two-dimensional IM-mass spectrum with the corresponding line-projections in the m/z dimension. Adjusted with permission from Chorev DS, et al., Nat Commun, 2014, 5, 3758.
Figure 6
Figure 6
Schematic representation of an in vivo strategy for identifying protein–protein interactions. Cells are grown in media that are devoid of leucine and methionine. Photoreactive leucine and methionine analogues substitute the naturally occurring amino acids. To determine how multiple growth conditions influence the composition of a protein complex, cell cultures treated under different conditions will be cultured in different isotope-labeled media, containing the combinations of C- and N-labeling. Chemical crosslinking is then induced by UV-A illumination, forming a covalent bond with nearby protein side chains. Protein–protein interactions are identified by combining denaturing and native lysis conditions with pull-down experiments, using an affinity tag. Pull-down experiments under native conditions, before the formation of crosslinks, will enable to define subunit stoichiometries and characterization of all interacting proteins within the complex, using native MS. This step can also be performed in the absence of isotope labeling. Illuminating the sample with UV-A light will produce crosslinks capable of capturing even transient and weak interactions. These will be identified after pull-down experiments under denaturing conditions and analysis by both native MS and peptide MS profiling. The former provides a direct identification of the protein–protein interaction sites. MS/MS analysis of crosslinked products allows quantifying altered protein complex formation upon altered biological conditions based on C- and N-labeling.

References

    1. Tugarinov V, Hwang PM, Kay LE. Nuclear magnetic resonance spectroscopy of high-molecular-weight proteins. Annu Rev Biochem. 2004;73:107–146. - PubMed
    1. Ilari A, Savino C. Protein structure determination by x-ray crystallography. Methods Mol Biol. 2008;452:63–87. - PubMed
    1. Walian P, Cross TA, Jap BK. Structural genomics of membrane proteins. Genome Biol. 2004;5:215. - PMC - PubMed
    1. Parrish JR, Gulyas KD, Finley RL., Jr Yeast two-hybrid contributions to interactome mapping. Curr Opin Biotechnol. 2006;17:387–393. - PubMed
    1. Sun Y, Hays NM, Periasamy A, Davidson MW, Day RN. Monitoring protein interactions in living cells with fluorescence lifetime imaging microscopy. Methods Enzymol. 2012;504:371–391. - PMC - PubMed