

Reduced efficiency of sarcolipin-dependent respiration in myocytes from humans with severe obesity
- PMID: 25970801
- PMCID: PMC4483165
- DOI: 10.1002/oby.21123
Reduced efficiency of sarcolipin-dependent respiration in myocytes from humans with severe obesity
Abstract
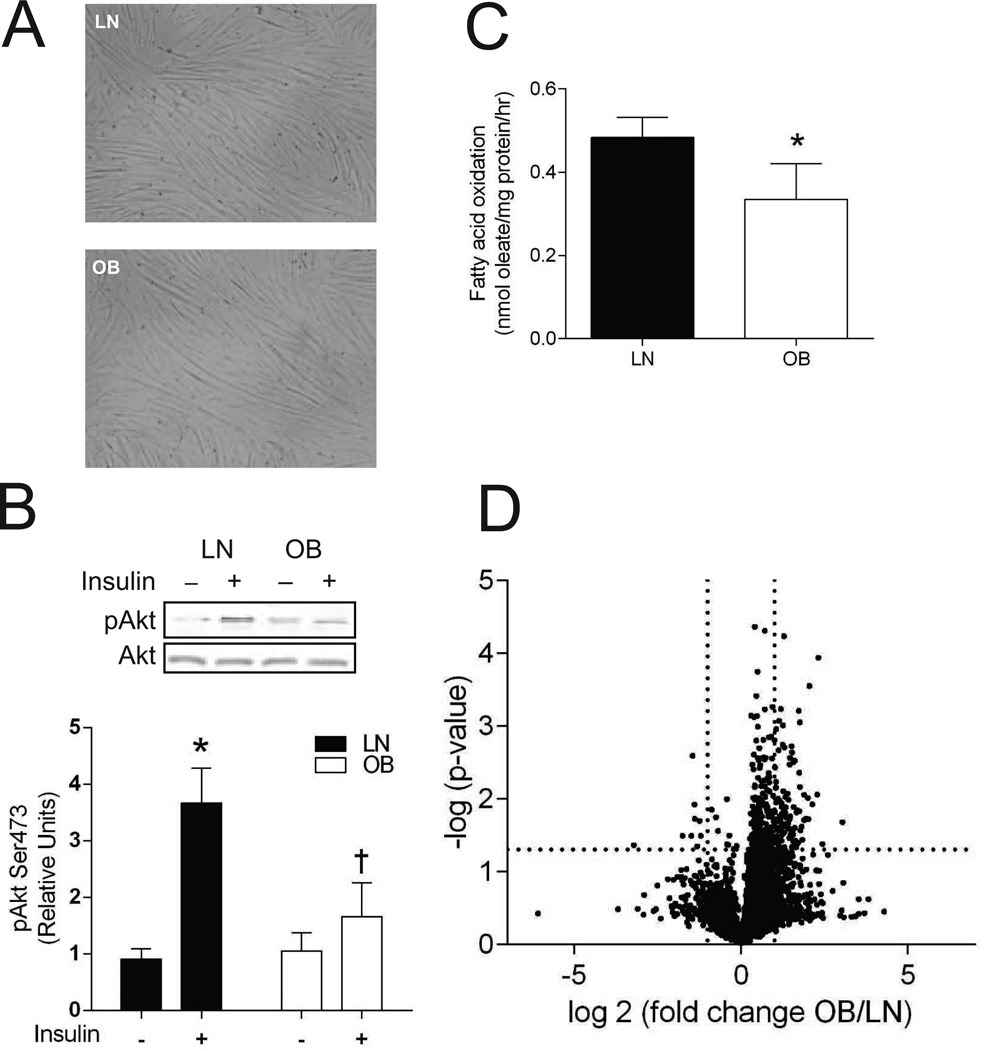
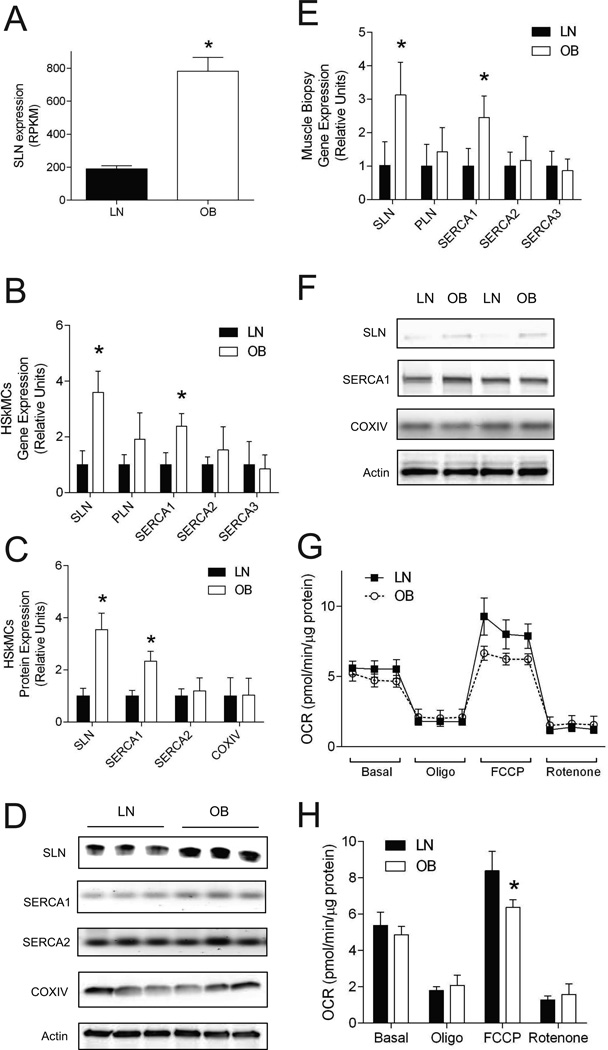
Objective: Sarcolipin (SLN) regulates muscle energy expenditure through its action on sarco/endoplasmic reticulum Ca(2+) -ATPase (SERCA) pump. It is unknown whether SLN-dependent respiration has relevance to human obesity, but whole-transcriptome gene expression profiling revealed that SLN was more highly expressed in myocytes from individuals with severe obesity (OB) than in lean controls (LN). The purpose of this study was to examine SLN-dependent cellular respiratory rates in LN and OB human muscles.
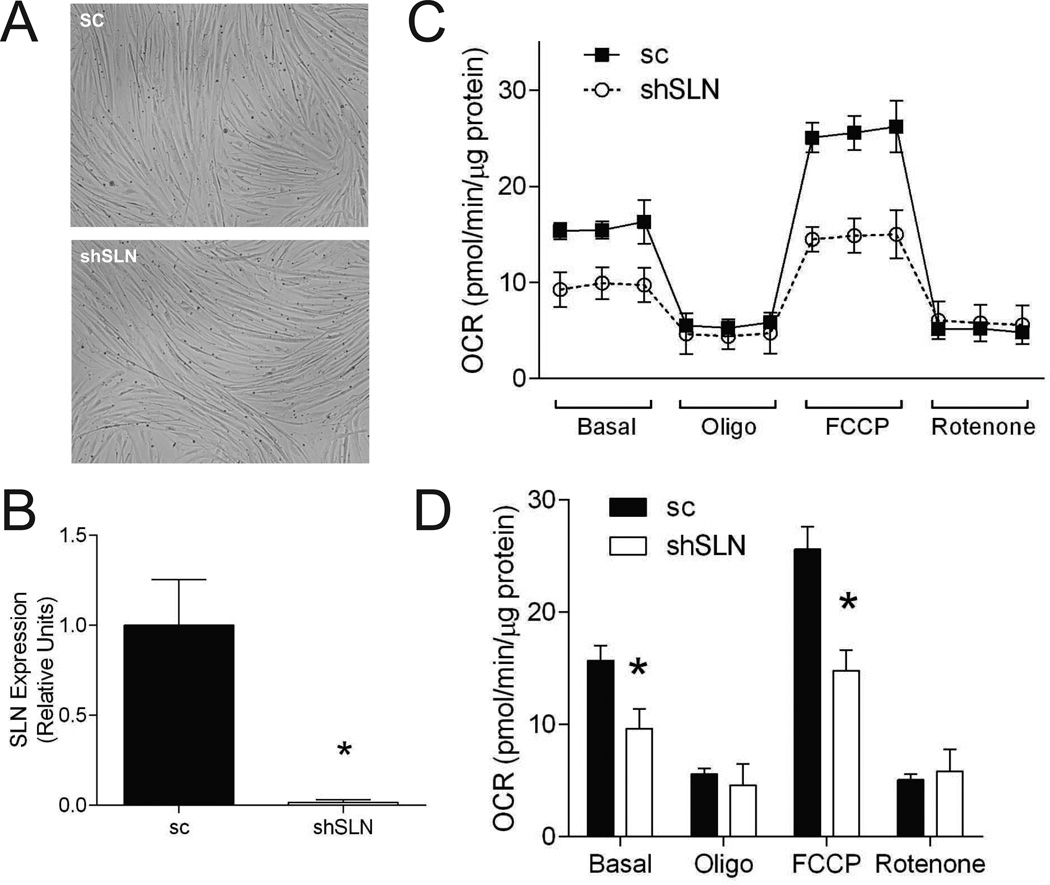
Methods: Primary myocytes were isolated from muscle biopsy from seven LN and OB Caucasian females. Cellular respiration was assessed with and without lentivirus-mediated SLN knockdown in LN and OB myocytes.
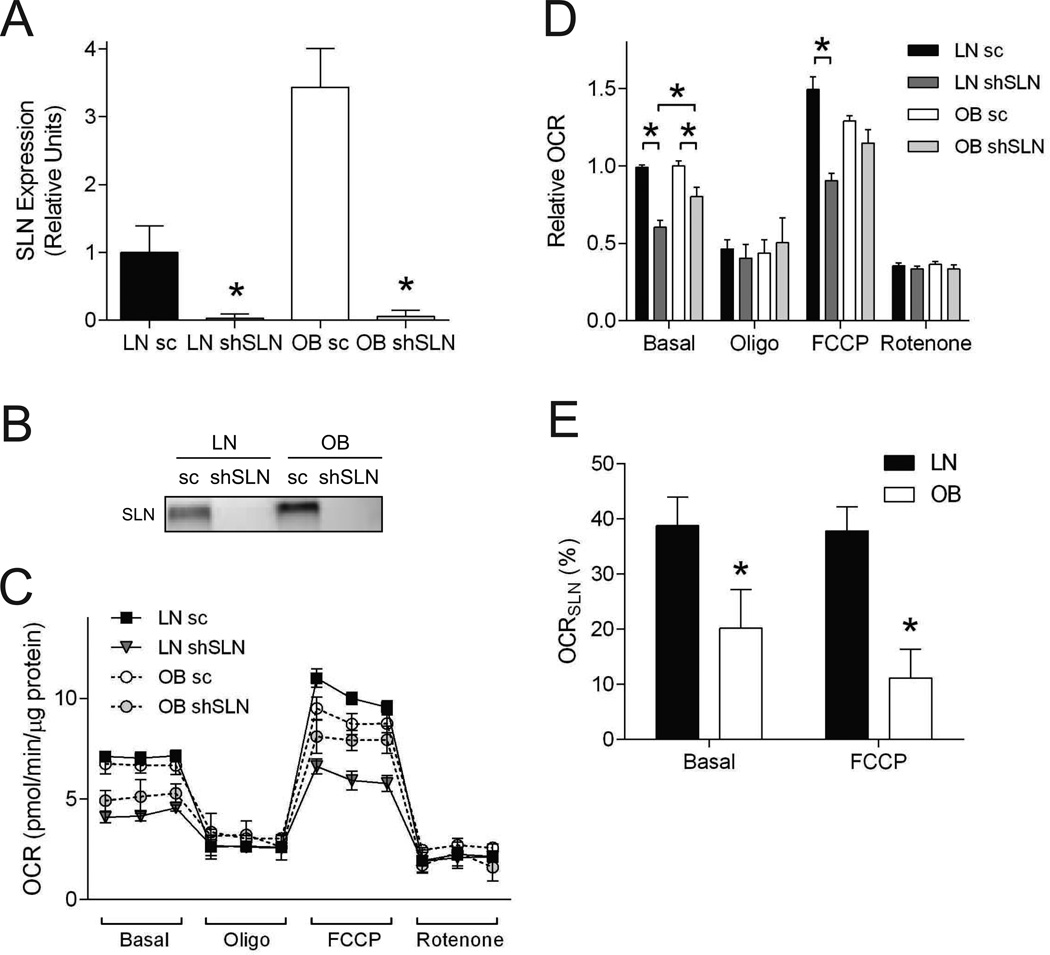
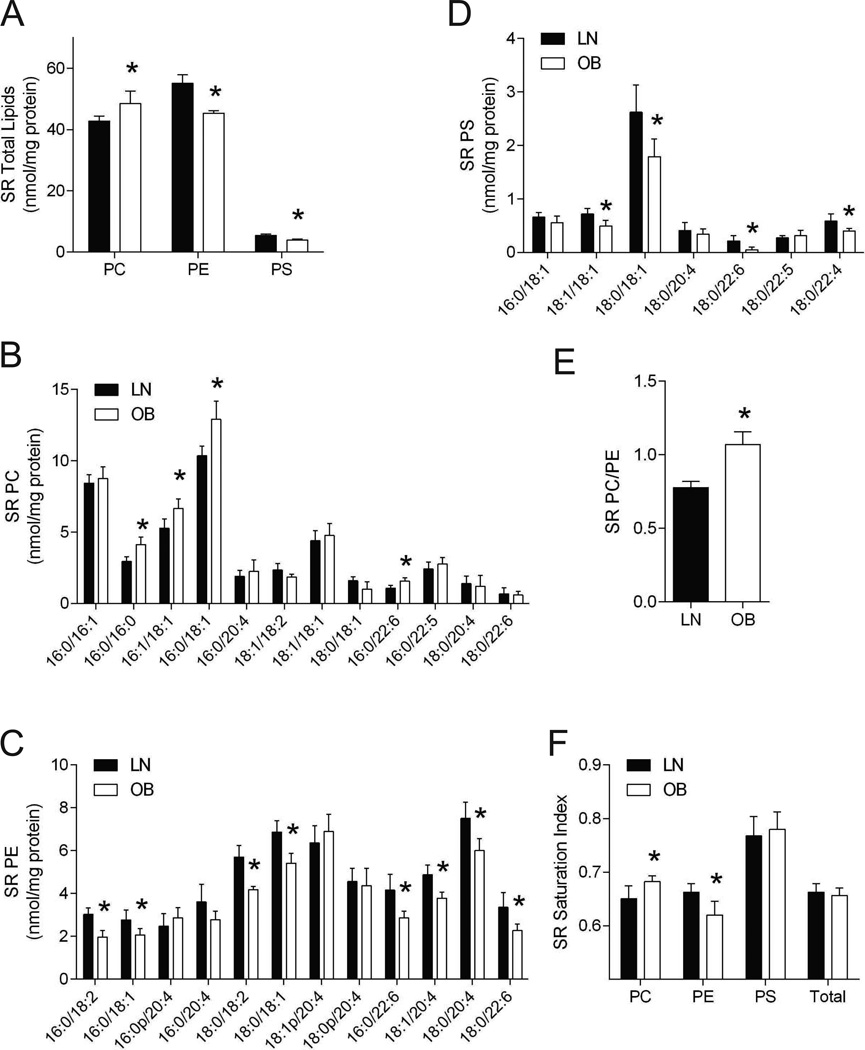
Results: SLN mRNA and protein abundance was greater in OB compared to LN cells. Despite elevated SLN levels in wild-type OB cells, respiratory rates among SLN-deficient cells were higher in OB compared to LN. Obesity-induced reduction in efficiency of SLN-dependent respiration was associated with altered sarcoplasmic reticulum phospholipidome.
Conclusions: SLN-dependent respiration is reduced in muscles from humans with severe obesity compared to lean controls. Identification of the molecular mechanism that affects SLN efficiency might lead to interventions that promote an increase in skeletal muscle energy expenditure.
© 2015 The Obesity Society.
Conflict of interest statement
No conflict of interest
Figures
Similar articles
-
Sarcolipin Is a Key Determinant of the Basal Metabolic Rate, and Its Overexpression Enhances Energy Expenditure and Resistance against Diet-induced Obesity.J Biol Chem. 2015 Apr 24;290(17):10840-9. doi: 10.1074/jbc.M115.636878. Epub 2015 Feb 24. J Biol Chem. 2015. PMID: 25713078 Free PMC article.
-
Sarcolipin is a newly identified regulator of muscle-based thermogenesis in mammals.Nat Med. 2012 Oct;18(10):1575-9. doi: 10.1038/nm.2897. Epub 2012 Sep 9. Nat Med. 2012. PMID: 22961106 Free PMC article.
-
Phospholamban and sarcolipin: Are they functionally redundant or distinct regulators of the Sarco(Endo)Plasmic Reticulum Calcium ATPase?J Mol Cell Cardiol. 2016 Feb;91:81-91. doi: 10.1016/j.yjmcc.2015.12.030. Epub 2015 Dec 29. J Mol Cell Cardiol. 2016. PMID: 26743715 Free PMC article. Review.
-
Sarcolipin provides a novel muscle-based mechanism for adaptive thermogenesis.Exerc Sport Sci Rev. 2014 Jul;42(3):136-42. doi: 10.1249/JES.0000000000000016. Exerc Sport Sci Rev. 2014. PMID: 24949847 Review.
-
Phospholamban deficiency does not alter skeletal muscle SERCA pumping efficiency or predispose mice to diet-induced obesity.Am J Physiol Endocrinol Metab. 2019 Mar 1;316(3):E432-E442. doi: 10.1152/ajpendo.00288.2018. Epub 2019 Jan 2. Am J Physiol Endocrinol Metab. 2019. PMID: 30601702
Cited by
-
Skeletal Muscle Consequences of Phosphatidylethanolamine Synthesis Deficiency.Function (Oxf). 2023 Apr 29;4(4):zqad020. doi: 10.1093/function/zqad020. eCollection 2023. Function (Oxf). 2023. PMID: 37342414 Free PMC article.
-
Hypermetabolism in mice carrying a near-complete human chromosome 21.Elife. 2023 May 30;12:e86023. doi: 10.7554/eLife.86023. Elife. 2023. PMID: 37249575 Free PMC article.
-
Roux-en-Y gastric bypass surgery restores insulin-mediated glucose partitioning and mitochondrial dynamics in primary myotubes from severely obese humans.Int J Obes (Lond). 2020 Mar;44(3):684-696. doi: 10.1038/s41366-019-0469-y. Epub 2019 Oct 17. Int J Obes (Lond). 2020. PMID: 31624314 Free PMC article.
-
Hypermetabolism in mice carrying a near complete human chromosome 21.bioRxiv [Preprint]. 2023 Jan 31:2023.01.30.526183. doi: 10.1101/2023.01.30.526183. bioRxiv. 2023. Update in: Elife. 2023 May 30;12:e86023. doi: 10.7554/eLife.86023. PMID: 36778465 Free PMC article. Updated. Preprint.
-
Sarcolipin expression is repressed by endoplasmic reticulum stress in C2C12 myotubes.J Physiol Biochem. 2017 Nov;73(4):531-538. doi: 10.1007/s13105-017-0578-9. Epub 2017 Jul 13. J Physiol Biochem. 2017. PMID: 28707279
References
-
- CDC. Vital signs: state-specific obesity prevalence among adults --- United States, 2009. Morbidity and Mortality Weekly Report. 2010;59:951–955. - PubMed
-
- Must A, Spadano J, Coakley EH, Field AE, Colditz G, Dietz WH. The disease burden associated with overweight and obesity. The Journal of the American Medical Association. 1999;282:1523–1529. - PubMed
-
- Dunkley AJ, Bodicoat DH, Greaves CJ, Russell C, Yates T, Davies MJ, et al. Diabetes prevention in the real world: effectiveness of pragmatic lifestyle interventions for the prevention of type 2 diabetes and of the impact of adherence to guideline recommendations: a systematic review and meta-analysis. Diabetes care. 2014;37:922–933. - PubMed
-
- Gray LJ, Cooper N, Dunkley A, Warren FC, Ara R, Abrams K, et al. A systematic review and mixed treatment comparison of pharmacological interventions for the treatment of obesity. Obesity Reviews. 2012;13:483–498. - PubMed
Publication types
MeSH terms
Substances
Grants and funding
- K01 DK095774/DK/NIDDK NIH HHS/United States
- P60-DK20579/DK/NIDDK NIH HHS/United States
- DK095003/DK/NIDDK NIH HHS/United States
- P30-DK56341/DK/NIDDK NIH HHS/United States
- P30 DK056341/DK/NIDDK NIH HHS/United States
- DK095774/DK/NIDDK NIH HHS/United States
- R01 DK056112/DK/NIDDK NIH HHS/United States
- P41 GM103422/GM/NIGMS NIH HHS/United States
- DK056112/DK/NIDDK NIH HHS/United States
- P41-GM103422/GM/NIGMS NIH HHS/United States
- P60 DK020579/DK/NIDDK NIH HHS/United States
- P30 DK020579/DK/NIDDK NIH HHS/United States
- K01 DK095003/DK/NIDDK NIH HHS/United States
LinkOut - more resources
Full Text Sources
Other Literature Sources
Molecular Biology Databases
Research Materials
Miscellaneous
