. 2015 Oct;29(10):1981-92.
doi: 10.1038/leu.2015.106. Epub 2015 May 14.

Pharmacological targeting of miR-155 via the NEDD8-activating enzyme inhibitor MLN4924 (Pevonedistat) in FLT3-ITD acute myeloid leukemia

Affiliations

Pharmacological targeting of miR-155 via the NEDD8-activating enzyme inhibitor MLN4924 (Pevonedistat) in FLT3-ITD acute myeloid leukemia

J Khalife et al. Leukemia. 2015 Oct.

Abstract

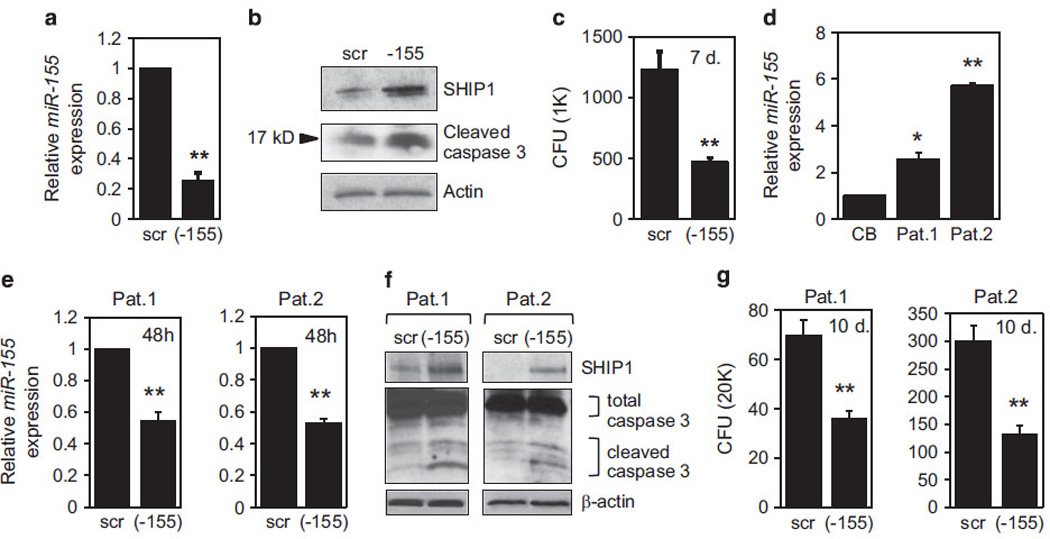
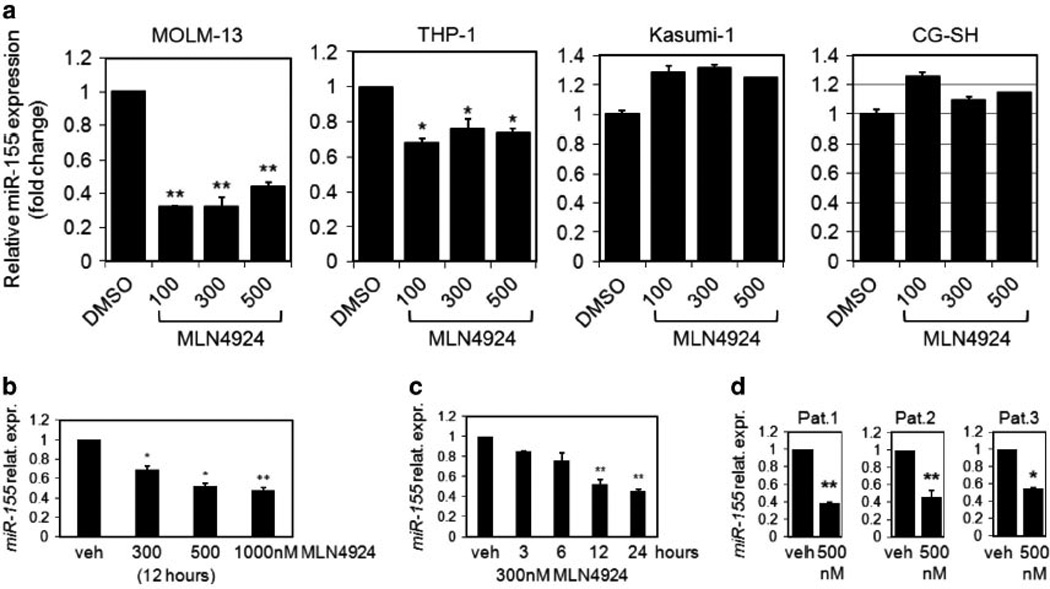
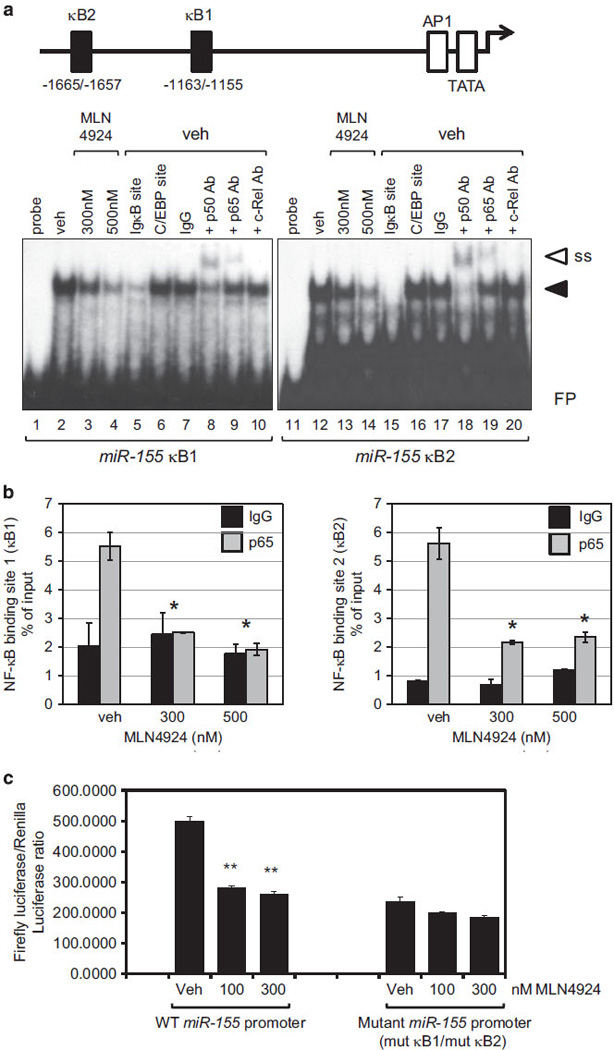
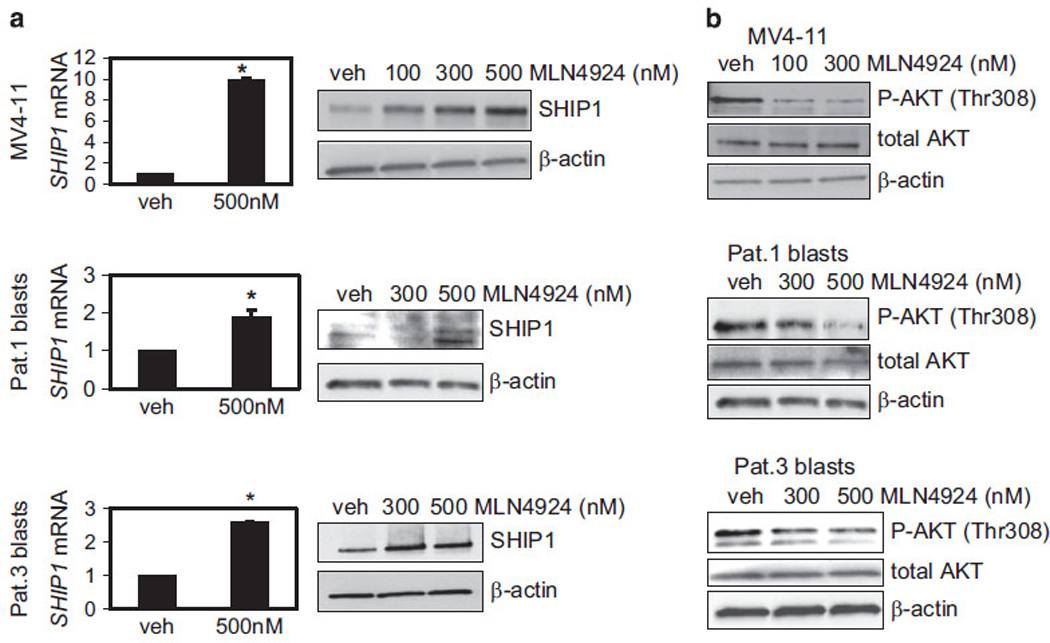
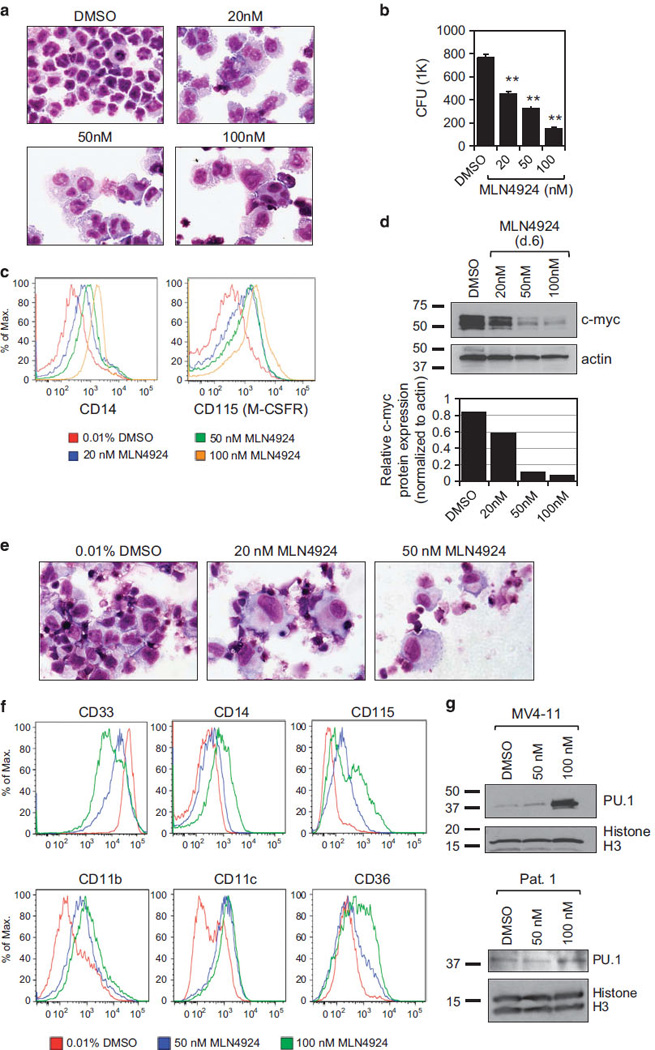
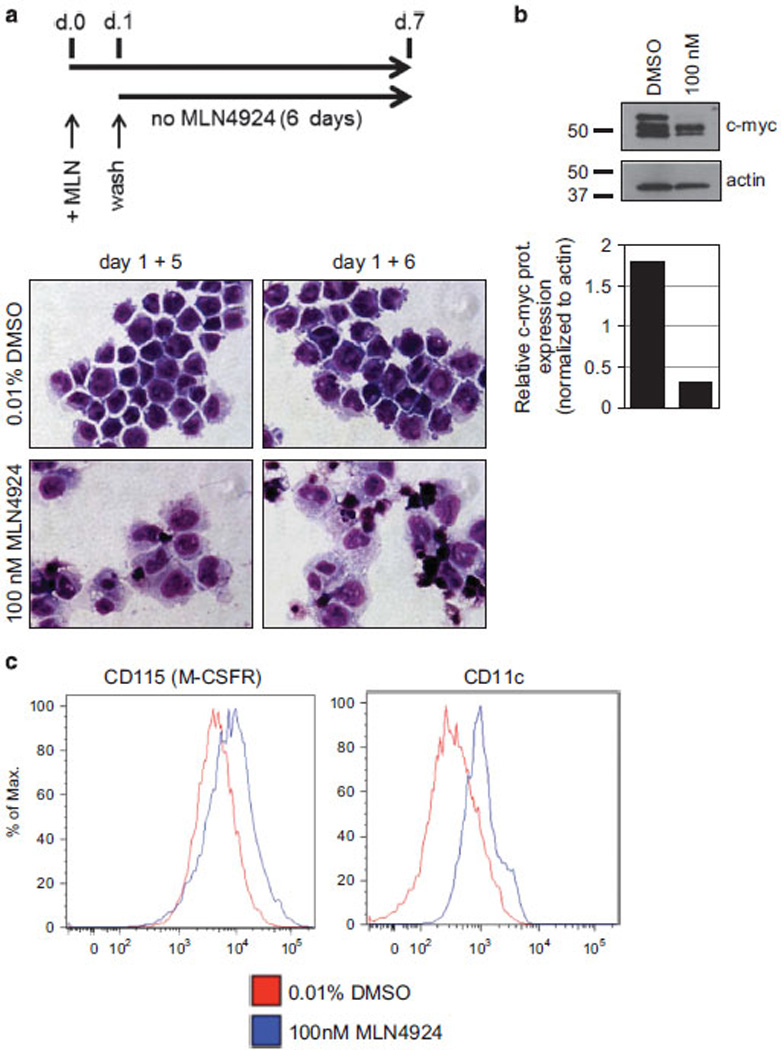
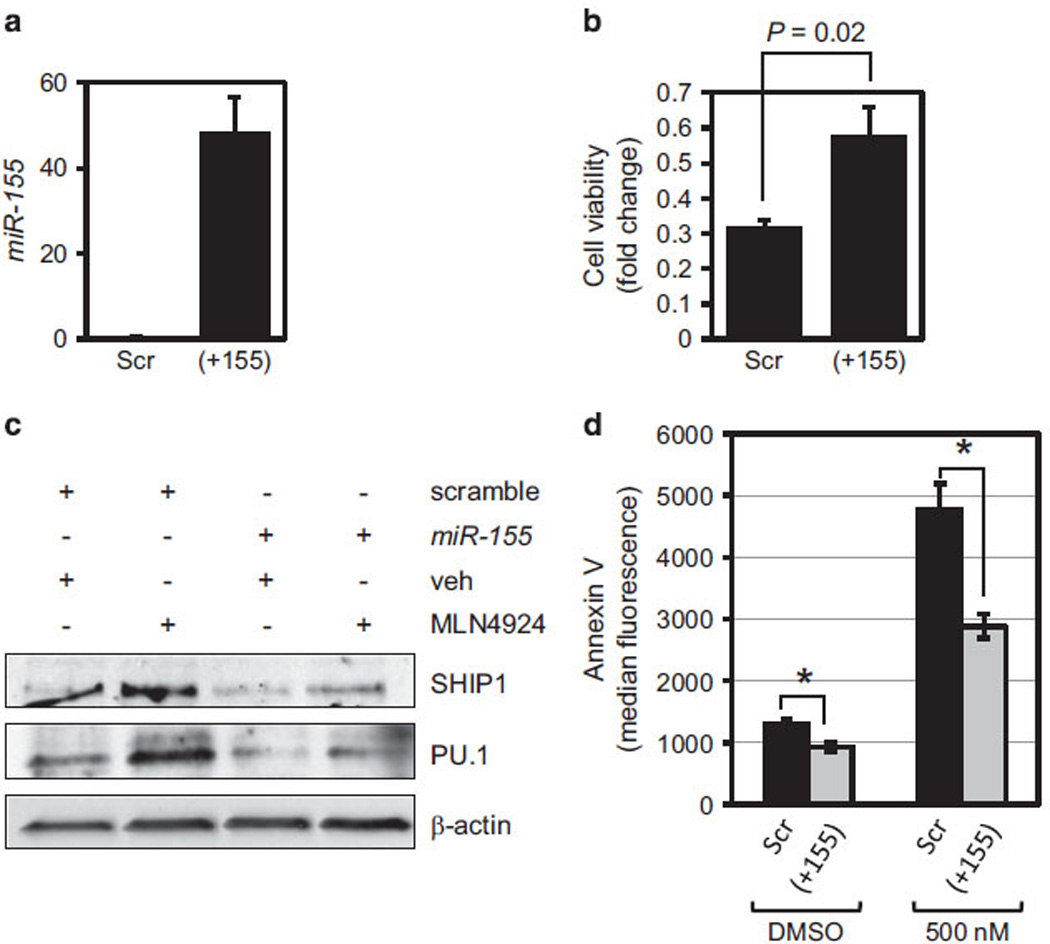
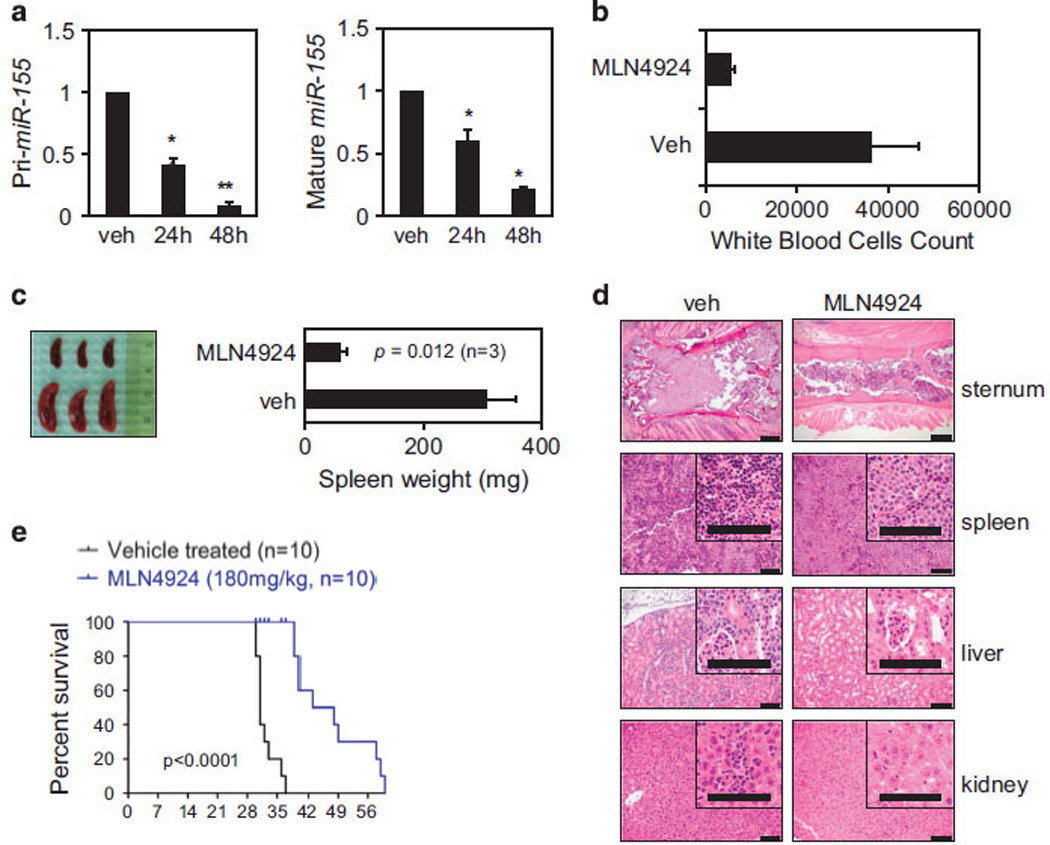
High levels of microRNA-155 (miR-155) are associated with poor outcome in acute myeloid leukemia (AML). In AML, miR-155 is regulated by NF-κB, the activity of which is, in part, controlled by the NEDD8-dependent ubiquitin ligases. We demonstrate that MLN4924, an inhibitor of NEDD8-activating enzyme presently being evaluated in clinical trials, decreases binding of NF-κB to the miR-155 promoter and downregulates miR-155 in AML cells. This results in the upregulation of the miR-155 targets SHIP1, an inhibitor of the PI3K/Akt pathway, and PU.1, a transcription factor important for myeloid differentiation, leading to monocytic differentiation and apoptosis. Consistent with these results, overexpression of miR-155 diminishes MLN4924-induced antileukemic effects. In vivo, MLN4924 reduces miR-155 expression and prolongs the survival of mice engrafted with leukemic cells. Our study demonstrates the potential of miR-155 as a novel therapeutic target in AML via pharmacologic interference with NF-κB-dependent regulatory mechanisms. We show the targeting of this oncogenic microRNA with MLN4924, a compound presently being evaluated in clinical trials in AML. As high miR-155 levels have been consistently associated with aggressive clinical phenotypes, our work opens new avenues for microRNA-targeting therapeutic approaches to leukemia and cancer patients.


Conflict of interest statement

CONFLICT OF INTEREST

The authors declare no conflict of interest.

Figures

Figure 1
Figure 1
Antileukemic effects of miR-155 inhibition. (a) Nanoparticles loaded with scramble oligo (scr), or antagomiR-155 (-155), were delivered to MV4-11 cells and mature miR-155 expression was determined 48 h later by TaqMan assay. The expression in scramble control was set to 1. (b) Nanoparticle-treated MV4-11 cells were analyzed by western blot for SHIP1 (top) and cleaved caspase-3 levels (middle). The same blot was stained with anti-actin antibody for loading control (bottom). (c) MV4-11 cells were treated with nanoparticles, 1000 cells were plated in methycellulose and colonies (CFU) were counted 7 days later. (d) TaqMan assay of miR-155 expression in CD34+/CD38+ cells purified from two AML patient samples (Pat. 1 and Pat. 2) compared with CD34+/CD38+ cells from normal cord blood (CB), which was set to 1. (e) AML patient blasts were treated with scramble oligo (scr) or antagomiR-155 (-155) loaded nanoparticles and mature miR-155 expression was measured 48 h later by TaqMan. Scramble controls were set to 1. (f) Whole-cell extracts from AML blasts treated with nanoparticles for 48 h were analyzed for the expression of SHIP1 (top) and the presence of cleaved caspase-3 (middle). Staining for anti-actin (bottom) served as a loading control. (g) Following nanoparticle treatment, primary AML cells were analyzed for clonogenic activity by plating 20 000 cells in methylcellulose. Colonies (CFU) were scored 10 days later.
Figure 2
Figure 2
MLN4924 treatment reduces miR-155 expression in FLT3-ITD AML cell lines and primary patient blasts. (a) AML cell lines: FLT3-ITD carrying MOLM-13 and wt FLT3 expressing THP-1, Kasumi-1 and CG-SH were cultured in the presence of indicated concentrations of MLN4924, or vehicle control (DMSO) for 12 h and the expression of miR-155 was determined by the TaqMan assay and normalized to U44 levels. (b) Mature miR-155 expression was analyzed by the TaqMan method in MV4-11 cells, following 12 h of treatment with MLN4924 at the indicated concentrations. The results were normalized to U44. On the basis of triplicate readings of an average of three separate experiments, the average relative fold change was calculated in comparison with the vehicle controls, which were set to 1. (c) Time course of MV4-11 treatment with 300 nm MLN4924. (d) TaqMan assay of miR-155 expression in FLT3-ITD AML primary patient blasts treated with MLN4924 for 12 h. Results are shown as relative fold change after normalization with U44 and 2 Ct, based on triplicate readings of an average of three readings in the same experiments.
Figure 3
Figure 3
MLN4924 inhibits binding of NF-κB to the miR-155 gene promoter. (a) Top: diagram of the miR-155 promoter showing known NF-κB-binding sites: κ1 (nts − 1163/ − 1155) and κ2 (nts − 1665/ − 1657). Lower panel: nuclear extracts from MV4-11 cells treated with vehicle control (DMSO), 300 or 500 nm MLN4924 (as indicated above the lanes) for 12 h were used in EMSA with radiolabeled probes containing NF-κB-binding sites from human miR-155 promoter (κ1 and κ2). NF-κB/DNA complexes are indicated by a black arrowhead. Specificity of binding is shown by using antibodies against the NF-κB subunits, p65 and p50, to supershift the DNA–protein complexes (marked with white arrowhead; SS) and competition with unlabeled oligos containing either the Igκ gene-derived NF-κB site (IgκB), or unrelated C/EBP-binding site. Free probe (FP) is indicated. (b) Chromatin immunoprecipitation using MV4-11 cells treated with 300 or 500 nm MLN4924 for 12 h. DMSO treatment served as a control (veh). Relative percent enrichment over input was measured by real-time PCR with specific primers covering the miR-155 promoter region containing the two NF-κB-binding sites (κ1 on the left and κ2 on the right). An average of three measurements is shown. Triplicate readings were averaged and error bars indicate s.d. (c) 293T cells were stimulated with 10ng/ml PMA for 2 h to activate NF-κB and then treated with either DMSO (veh), or MLN4924 (100 and 300 nm) for an additional 6 h, followed by transient transfection with firefly luciferase vectors driven by the miR-155 promoter, either wild type (WT) or with both NF-κB sites mutated (mut κB1/mut κB2) together with TK-promoter-driven Renilla luciferase vector. Cell lysates were analyzed for luciferase activity.
Figure 4
Figure 4
MLN4924 treatment restores the expression of the SHIP1 tumor suppressor and inhibits the PI3K/AKT pathway in MV4-11 cells and primary AML patient blasts. (a) MV4-11 cells and two patient blast samples were cultured in the presence of 500 nm MLN4924 for 24 h. The same samples were also similarly treated with vehicle control (DMSO; veh). SHIP1 mRNA was tested by real-time PCR (left) and the results are shown as relative fold change after normalization with 18S and 2 Ct calculations. Triplicate measurements were averaged and error bars show s.d. (P <0.01 for MV4-11 and AML patients P <0.05). Protein expression was evaluated by western blot (right). β-actin served as a loading control. (b) Phospho-AKT (Thr308, P-AKT) and total AKT protein expression in MV4-11 and two primary AML samples following treatment with 100, 300 or 500 nm MLN4924, or vehicle control for 24 h is shown by western blot. Staining with β-actin antibody was used as a loading control.
Figure 5
Figure 5
Induction of monocytic differentiation by MLN4924. (a) MV4-11 cells were cultured for 6 days in the medium supplemented with MLN4924 at the concentrations shown or vehicle control (DMSO). Cytospins were stained using the Wright–Giemsa method. (b) MV4-11 cells were treated as in a and 1000 cells were plated in methycellulose in triplicate. Colonies (CFU) were counted 7 days later. (c) Flow cytometric analyses of MV4-11 cells treated for 7 days as in a and stained with anti-CD14 (left panel), or anti-CD115 (right panel). (d) Cell aliquots treated with MLN4924 for 6 days were analyzed for c-myc protein expression by western blot of whole-cell extracts. Staining with anti-actin antibody served to normalize for loading control. Band intensities were measured using ImageJ software and the amount of c-myc normalized to actin levels was plotted (below). (e) Blasts from AML patient (Pat.1) were cultured in the presence of MLN4924 at the indicated concentrations of DMSO. Six days later, cell morphology was analyzed by Wright–Giemsa-stained cytospins. Although 100 nm MLN4924 was included in this experiment, the cell viability was very low and there was not enough material for cytospin. (f) Blast cells from patient 1 (Pat.1) were treated with 50 nm, 100 nm or 0.01% DMSO, aliquots were collected on day 6 and the expression of cell surface markers (indicated) was determined by fluorescence-activated cell sorting. (g) Western blot of nuclear extracts from MV4-11 cells (top) and AML blasts from patient 1 (Pat.1; bottom) treated with designated concentrations of MLN4924 for 24 h. Blot was stained successively with anti-PU.1 and Histone H3 antibodies.
Figure 6
Figure 6
Transient treatment of MV4-11 cells with MLN4924 is sufficient for the inception of monocytic differentiation. (a) Top: diagram of a timeline of the transient treatment with MLN4924. MV4-11 cells were treated with 100 nm MLN4924 for 24 h, washed in MLN4924-free medium three times and grown for up to an additional 6 days in the absence of MLN4924. Bottom: Wright–Giemsa-stained cytospin preparations of cells collected on day 6 (1+5) or day 7 (1+6) of the culture. (b) Whole-cell extracts were tested by western blot for c-myc protein levels and the total protein levels were normalized to actin. Densitometric quantification of band intensities, using ImageJ software is shown below. (c) Cells harvested on day 7 were analyzed by fluorescence-activated cell sorting using anti-CD-115 and anti-CD11c antibodies.
Figure 7
Figure 7
Ectopic expression of miR-155 in AML cells counteracts the antileukemic effects of MLN4924. (a) AML blasts from Patient 3 were transfected with the precursor of miR-155 and mature miR-155 expression was analyzed 24 h later. Results are shown as relative copy numbers after normalization for U44. Average of three readings is shown and error bars indicate s.d. (P <0.01). (b) Twenty-four hours after transfection with miR-155 precursor or scramble control, leukemic blasts were treated with 500 nm MLN4924 for an additional 48 h and viable cell counts were determined by Trypan blue exclusion. Results are shown as relative fold change in viable cell numbers of an average of two experiments done in triplicate. Error bars indicate s.d. (c) SHIP1, PU.1, caspase-3 and cleaved caspase-3 (indicator of apoptosis) protein levels were determined by western blot in whole-cell lysates of cells transfected with miR-155 precursor or scramble oligonucleotide and 24 h later treated for an additional 48 h with 500 nm MLN4924 or vehicle control. β-actin shows equal loading of the protein extracts. (d) Annexin V-FITC apoptosis assay of patient blasts transfected and treated as in c. Median fluorescence intensities of Annexin-V-positive cells from three independent experiments were averaged and represented in as a bar graph. Error bars indicate s.e.m.
Figure 8
Figure 8
Antileukemic activity of MLN4924 in a human AML xenograft model. (a) NOD/SCID γ (NSG) mice were transplanted intravenously with MV4-11 cells. After the engraftment, splenic cells from the leukemic mice were injected into secondary recipient NSG mice. One week later, 10 mice were treated with 180 mg/kg of MLN4924 or vehicle control. Pri-miR (left) and mature miR-155 (right) expression levels in the peripheral blood of xenografted mice were measured by real-time PCR, as early as 24 and 48 h after the first dose of MLN4924 and compared with vehicle control (veh). Results of mRNA expression are shown as relative fold change after normalization to 18 S and U44, respectively, and 2 Ct calculations. Error bars represent s.d. (P <0.01 for 48 h) based on triplicate readings of average of two separate experiments. (b) Average white blood cell count (µl/ml) taken from three mice representing each group and killed 21 days after the first injection of MLN4924 or vehicle control (veh). (c) Spleen pictures of three representative cases (MLN4924 n = 3; vehicle n = 3) at 21 days. Spleens were weighed and results are shown as bar graph representing the average of three in each group. P-value obtained using t-test is shown. (d) Hematoxylin and eosin staining of sections from sternum, spleen and liver of xenografted mice treated with vehicle or MLN4924 at 21 days. (e) Survival plot of xenografted mice after the treatments with MLN4924 at 180 mg/kg (n = 10) or vehicle control (veh; n = 10). Survival comparison was made using the log-rank test.

Similar articles

Cited by

References

    1. Burnett A, Wetzler M, Löwenberg B. Therapeutic advances in acute myeloid leukemia. J Clin Oncol. 2011;29:487–494. - PubMed
    1. Faraoni I, Antonetti FR, Cardone J, Bonmassar E. miR-155 gene: a typical multi-functional microRNA. Biochim Biophys Acta. 2009;1792:497–505. - PubMed
    1. Kong W, He L, Coppola M, Guo J, Esposito NN, Coppola D, et al. MicroRNA-155 regulates cell survival, growth, and chemosensitivity by targeting FOXO3a in breast cancer. J Biol Chem. 2010;285:17869–17879. - PMC - PubMed
    1. Marcucci G, Maharry KS, Metzeler KH, Volinia S, Wu YZ, Mrózek K, et al. Clinical role of microRNAs in cytogenetically normal acute myeloid leukemia: miR-155 upregulation independently identifies high-risk patients. J Clin Oncol. 2013;31:2086–2093. - PMC - PubMed
    1. Whitman SP, Maharry K, Radmacher MD, Becker H, Mrózek K, Margeson D, et al. FLT3 internal tandem duplication associates with adverse outcome and gene- and microRNA-expression signatures in patients 60 years of age or older with primary cytogenetically normal acute myeloid leukemia: a Cancer and Leukemia Group B study. Blood. 2010;116:3622–3626. - PMC - PubMed

Publication types

MeSH terms