Review
. 2015 Jun;79(2):243-62.
doi: 10.1128/MMBR.00001-15.

Fungal traits that drive ecosystem dynamics on land

Affiliations
Review

Fungal traits that drive ecosystem dynamics on land

Kathleen K Treseder et al. Microbiol Mol Biol Rev. 2015 Jun.

Abstract

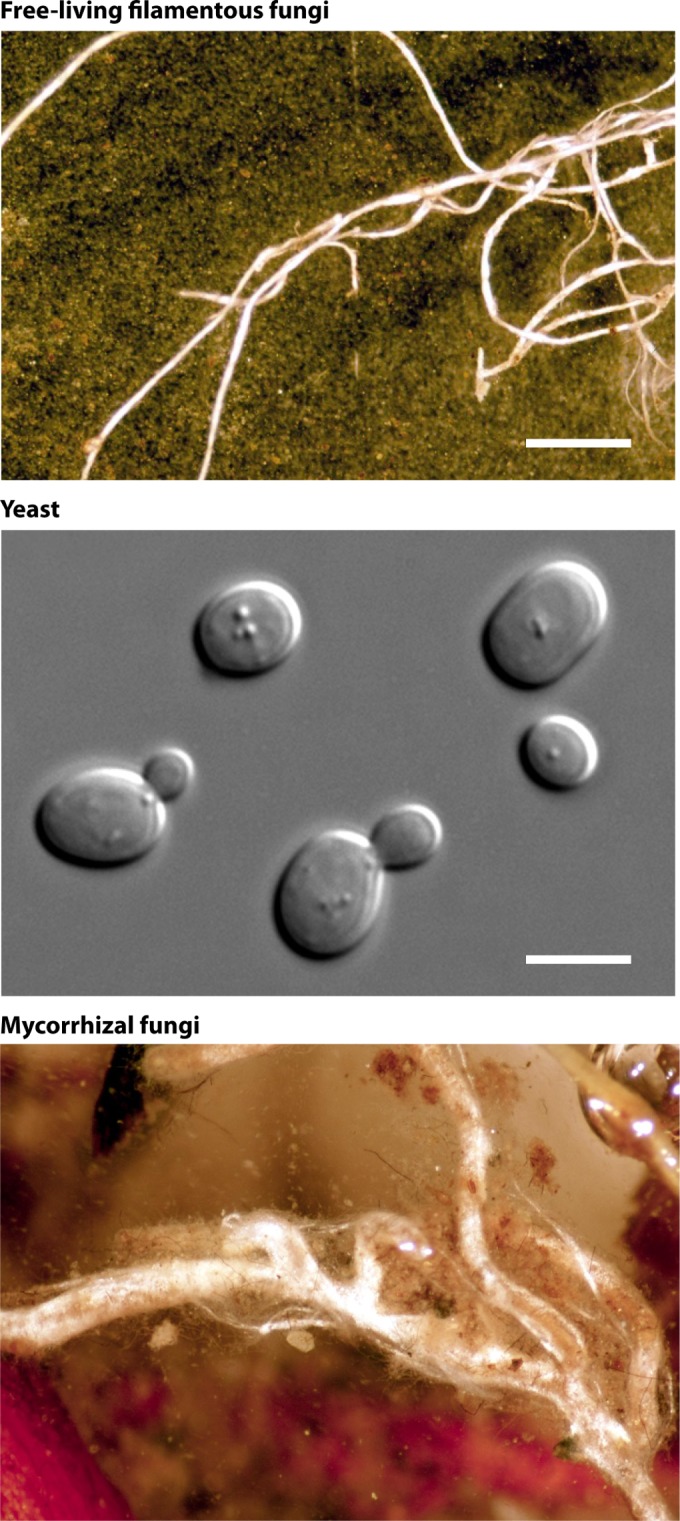
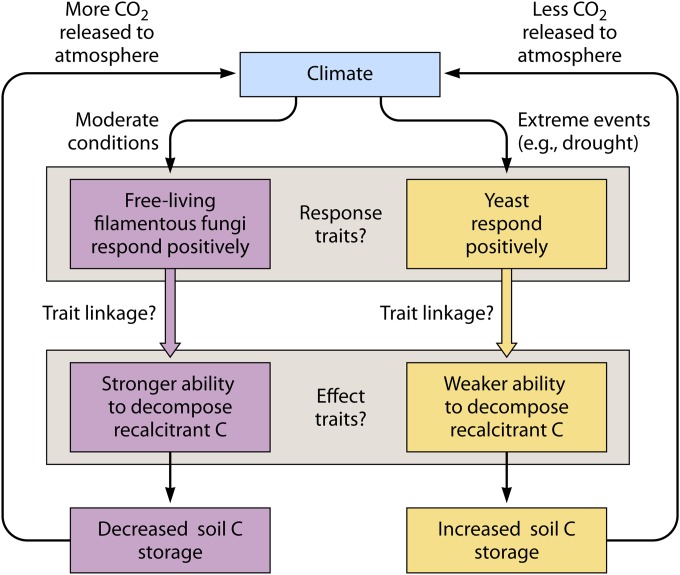
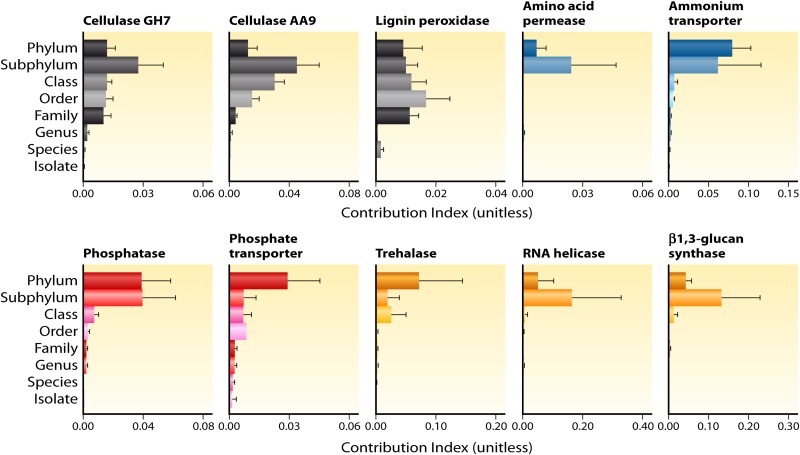
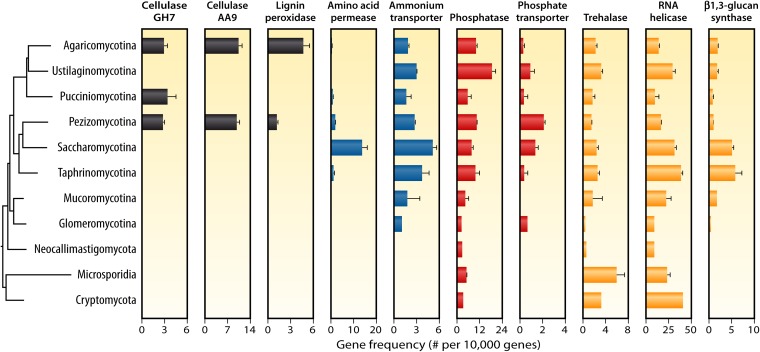
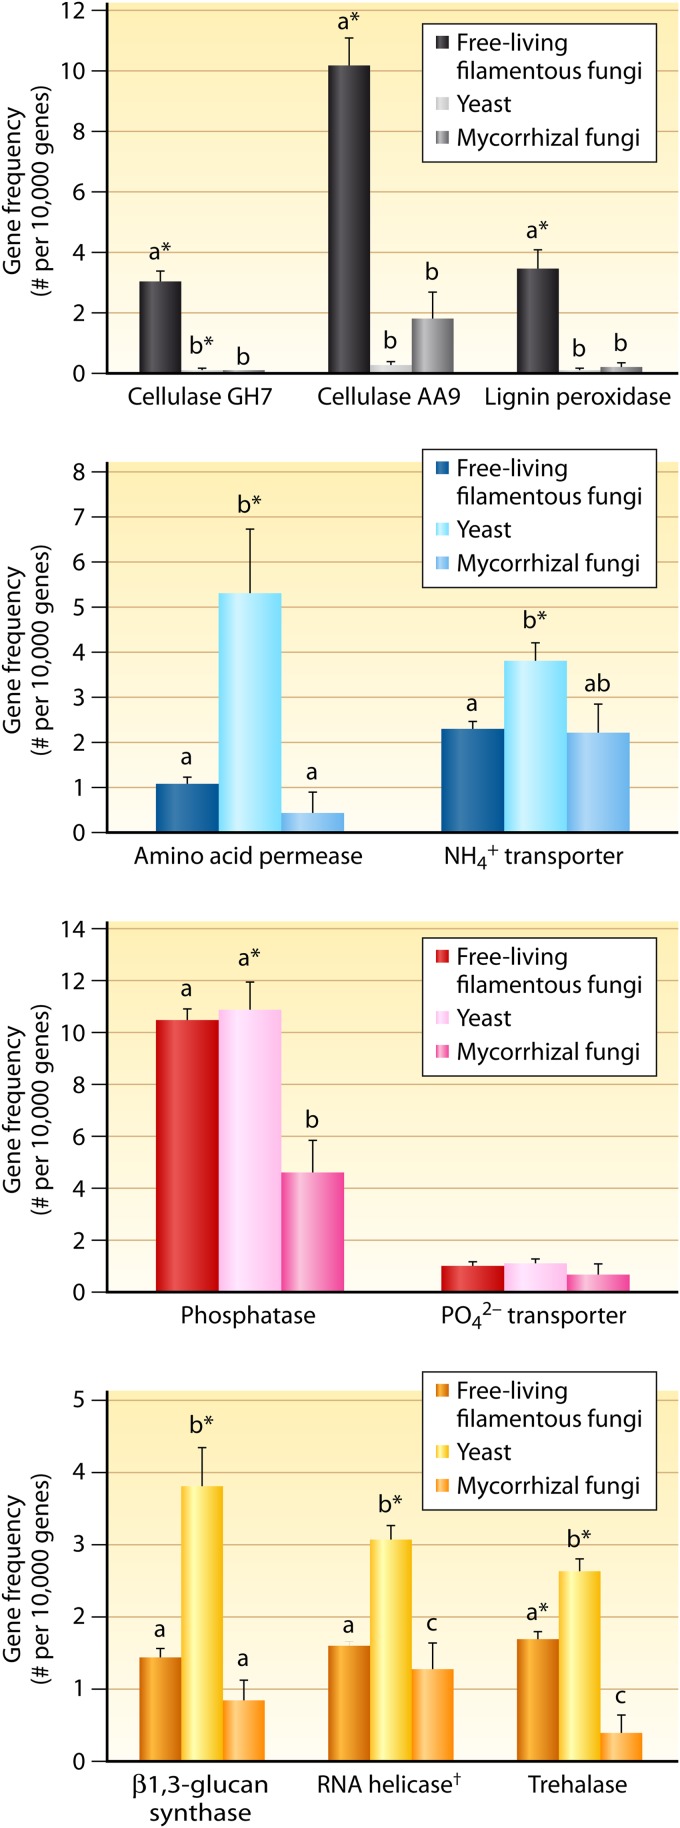
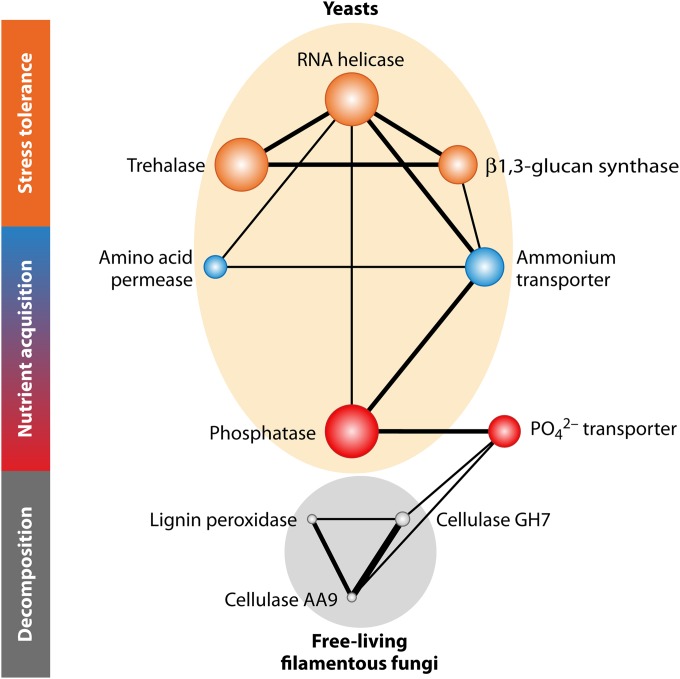
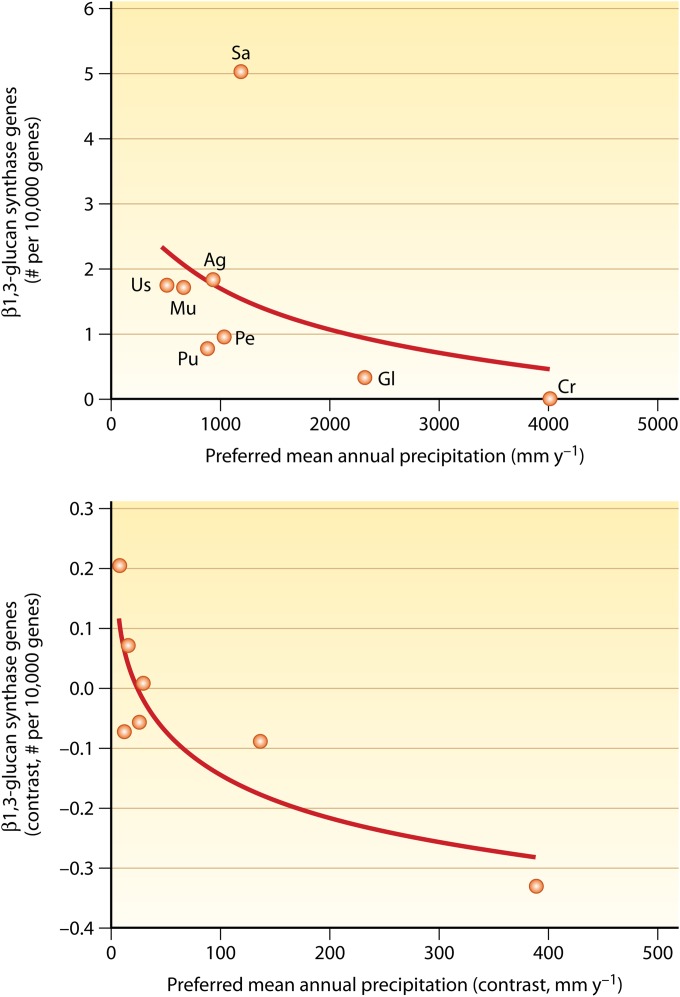
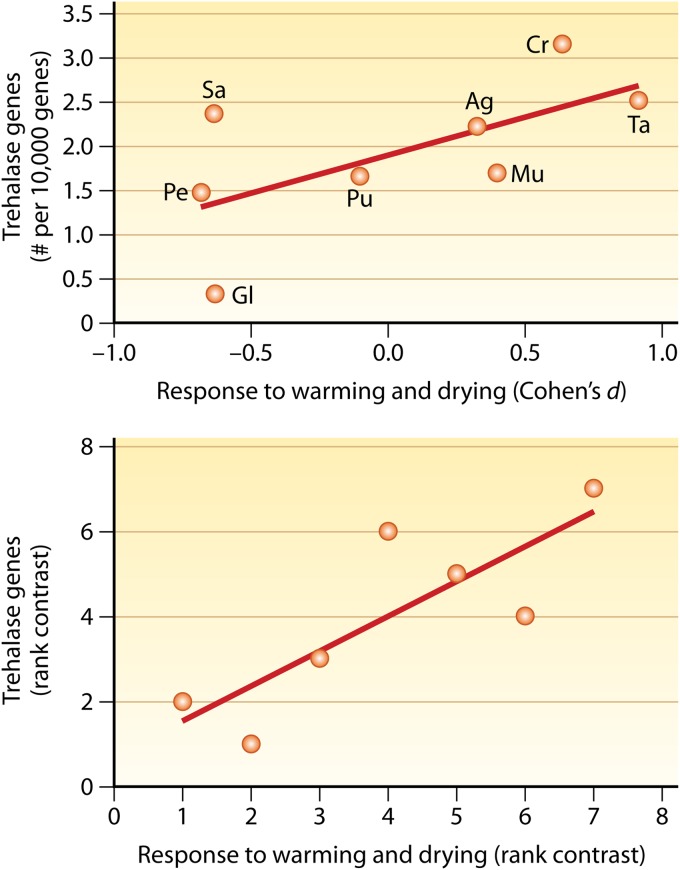
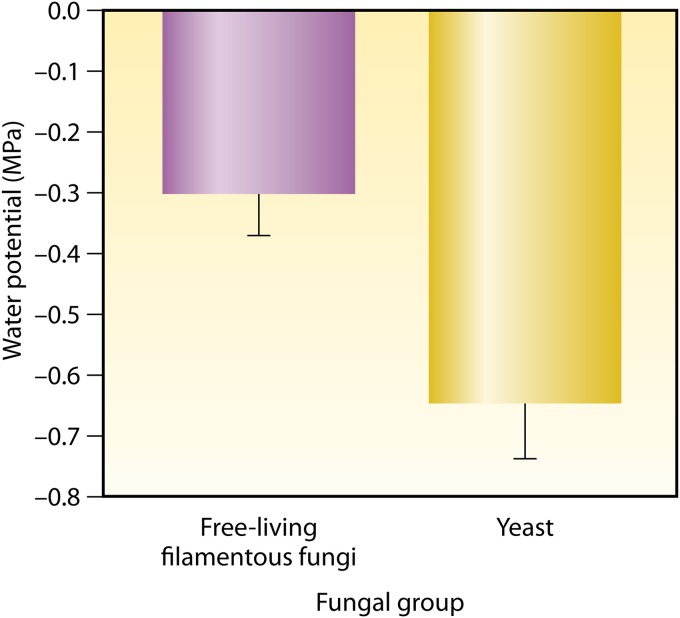
Fungi contribute extensively to a wide range of ecosystem processes, including decomposition of organic carbon, deposition of recalcitrant carbon, and transformations of nitrogen and phosphorus. In this review, we discuss the current knowledge about physiological and morphological traits of fungi that directly influence these processes, and we describe the functional genes that encode these traits. In addition, we synthesize information from 157 whole fungal genomes in order to determine relationships among selected functional genes within fungal taxa. Ecosystem-related traits varied most at relatively coarse taxonomic levels. For example, we found that the maximum amount of variance for traits associated with carbon mineralization, nitrogen and phosphorus cycling, and stress tolerance could be explained at the levels of order to phylum. Moreover, suites of traits tended to co-occur within taxa. Specifically, the genetic capacities for traits that improve stress tolerance-β-glucan synthesis, trehalose production, and cold-induced RNA helicases-were positively related to one another, and they were more evident in yeasts. Traits that regulate the decomposition of complex organic matter-lignin peroxidases, cellobiohydrolases, and crystalline cellulases-were also positively related, but they were more strongly associated with free-living filamentous fungi. Altogether, these relationships provide evidence for two functional groups: stress tolerators, which may contribute to soil carbon accumulation via the production of recalcitrant compounds; and decomposers, which may reduce soil carbon stocks. It is possible that ecosystem functions, such as soil carbon storage, may be mediated by shifts in the fungal community between stress tolerators and decomposers in response to environmental changes, such as drought and warming.


Figures

FIG 1
FIG 1
Examples of free-living filamentous fungi, yeasts, and mycorrhizal fungi. Depicted are rhizomorphs of a free-living filamentous fungus (top) (bar, 0.5 mm), cells of the model yeast Saccharomyces cerevisiae (middle) (bar, 5 μm), and a fine root tip colonized by an ectomycorrhizal fungus (bottom) (bar, 4 mm). (Middle photo from Wikipedia [user name Masur; http://en.wikipedia.org/wiki/Yeast#/media/File:S_cerevisiae_under_DIC_microscopy.jpg].)
FIG 2
FIG 2
Hypothesized feedbacks on soil C storage associated with free-living filamentous fungi or yeasts. Yeasts tend to prevail under extreme conditions rather than moderate conditions, ostensibly because they possess one or more traits that confer stress tolerance (“response traits”). If these traits are linked to a relatively weak ability to decompose types of recalcitrant C (“effect traits”), then yeasts may contribute to a decline in CO2 released into the atmosphere by the fungal community in regions exposed to extreme climate conditions. The specific response and effect traits that may be involved and the extent to which they are linked are addressed in this review.
FIG 3
FIG 3
Variation in traits by taxonomic rank. The contribution index represents the proportion of trait variance across the entire phylogenetic tree that is attributable to the variance at a particular node. We categorized each node within the phylogenetic tree by the taxonomic rank of the clades that diverged from that node. For example, a node assigned to the “phylum” level represents a divergence between two phyla. Bars represent means + 1 standard error (SE) for nodes within each taxonomic rank. Each trait was assigned based on the frequency of relevant functional genes within each whole genome. Genomic data are from the 1,000 Fungal Genomes Project, obtained via the JGI MycoCosm Web portal (205).
FIG 4
FIG 4
Distribution of ecosystem-related traits across fungal phyla (or subphyla, for Dikarya). Frequencies of functional genes were calculated for each whole genome by using MycoCosm to search for relevant InterPro and Gene Ontology domains (Table 1). Bars are means + 1 SE for each phylum/subphylum. Phylogeny is from the 2014 MycoCosm All-Fungi Species Tree.
FIG 5
FIG 5
Ecosystem-related traits of free-living filamentous fungi, yeasts, and mycorrhizal fungi. Different letters indicate significant pairwise differences between morphological groups (P < 0.05), based on the Kolmogorov-Smirnov test. Asterisks indicate a significant phylogenetically independent contrast between members and nonmembers of the morphological group. †, for RNA helicase, gene frequency units are numbers per 1,000. Data are means + 1 SE.
FIG 6
FIG 6
Relationships among traits and their associations with morphological groups of fungi. Symbols represent traits. Symbol size is proportional to the number of fungal phyla (or subphyla, for Dikarya) that possess the trait. Lines connect traits that are significantly positively related based on the following two criteria: (i) significance based on Spearman ranked correlations and (ii) significance based on phylogenetically independent contrasts. Line thickness is proportional to Spearman's ρ or phylogenetically independent contrast r, whichever is smaller; these values ranged between 0.2 and 0.47 (see Table S2 in the supplemental material). Ovals encompass traits that are significantly positively associated with yeasts or free-living filamentous fungi (Fig. 5).
FIG 7
FIG 7
Relationship between preferred mean annual precipitation and frequency of β1,3-glucan synthase genes among fungal phyla (or subphyla, for Dikarya) (upper panel), with corresponding phylogenetically independent contrasts (lower panel). In the upper panel, symbols show the means for the fungal phyla/subphyla detected in a survey of soil fungi from North and South America. In the lower panel, symbols represent the contrast at each phylogenetic node (see Fig. 4 for the phylogenetic tree). Logarithmic lines show the best fit. “Preferred mean annual precipitation” is the average mean annual precipitation of all ecosystems in which a given taxon was detected in a survey of soils from North and South America; these data are from the work of Treseder et al. (241). The mean frequency of β1,3-glucan synthase genes for each phylum/subphylum was calculated as described in the legend to Fig. 4. Fungal phyla/subphyla that possessed higher frequencies of β1,3-glucan synthase genes were found in significantly drier ecosystems (phylogenetically independent contrast; r = −0.813; P = 0.026). Ag, Agaricomycotina; Cr, Cryptomycota; Gl, Glomeromycota; Mu, Mucoromycotina; Pe, Pezizomycotina; Pu, Pucciniomycotina; Sa, Saccharomycotina; Us, Ustilaginomycotina.
FIG 8
FIG 8
Relationship between frequency of trehalase genes and response to warming and drying among fungal phyla (or subphyla, for Dikarya) (upper panel), with associated phylogenetically independent contrasts (lower panel), detected in a climate manipulation experiment in an Alaskan boreal forest (242). In the upper panel, symbols represent means for the phyla/subphyla. In the lower panel, symbols represent the contrast at each phylogenetic node (see Fig. 4 for the phylogenetic tree); values were ranked to avoid an undue influence of outliers. Lines show the best fit. The mean frequency of trehalase genes for each phylum/subphylum was calculated as described in the legend to Fig. 4. The response to warming and drying of each fungal taxon was calculated as the Cohen's d effect size (298) and averaged within each phylum/subphylum. Cohen's d is the difference between the treatment mean and the control mean divided by the pooled standard deviation. Larger values of Cohen's d indicate stronger increases in relative abundance in response to warming and drying. Ag, Agaricomycotina; Cr, Cryptomycota; Gl, Glomeromycota; Mu, Mucoromycotina; Pe, Pezizomycotina; Pu, Pucciniomycotina; Sa, Saccharomycotina; Ta, Taphrinomycotina. Fungal phyla/subphyla with higher frequencies of trehalase genes became significantly more prevalent under warmer and drier conditions (phylogenetically independent contrast; r = 0.821; P = 0.023).
FIG 9
FIG 9
Difference in drought tolerance between free-living filamentous fungi and yeasts in a laboratory study by Lennon et al. (207). A more negative optimal water potential indicates greater drought tolerance. Bars show means and 1 SE. Yeasts were significantly more drought tolerant than were free-living filamentous fungi (Kruskal-Wallis test; H = 53.5; P = 0.020). The taxa representing free-living filamentous fungi were Hypocrea (2 isolates), Mucor, Penicillium (2 isolates), Rhizopus, Schizophyllum, Trametes, and Umbelopsis, and those representing yeasts were Galactomyces, Geotrichum, and Trichosporon (5 isolates).

References

    1. Dighton J. 2003. Fungi in ecosystem processes, vol 17 Marcel Dekker, New York, NY.
    1. Chapin FS, Matson PA, Vitousek PM, Chapin MC. 2011. Principles of terrestrial ecosystem ecology, 2nd ed Springer, New York, NY.
    1. Schmidt MWI, Torn MS, Abiven S, Dittmar T, Guggenberger G, Janssens IA, Kleber M, Kogel-Knabner I, Lehmann J, Manning DAC, Nannipieri P, Rasse DP, Weiner S, Trumbore SE. 2011. Persistence of soil organic matter as an ecosystem property. Nature 478:49–56. doi: 10.1038/nature10386. - DOI - PubMed
    1. Kogel-Knabner I. 2002. The macromolecular organic composition of plant and microbial residues as inputs to soil organic matter. Soil Biol Biochem 34:139–162. doi: 10.1016/S0038-0717(01)00158-4. - DOI
    1. Six J, Frey SD, Thiet RK, Batten KM. 2006. Bacterial and fungal contributions to carbon sequestration in agroecosystems. Soil Sci Soc Am J 70:555–569. doi: 10.2136/sssaj2004.0347. - DOI

Publication types