

Prefrontal Cortical Kappa Opioid Receptors Attenuate Responses to Amygdala Inputs
- PMID: 25971593
- PMCID: PMC4864622
- DOI: 10.1038/npp.2015.138
Prefrontal Cortical Kappa Opioid Receptors Attenuate Responses to Amygdala Inputs
Abstract
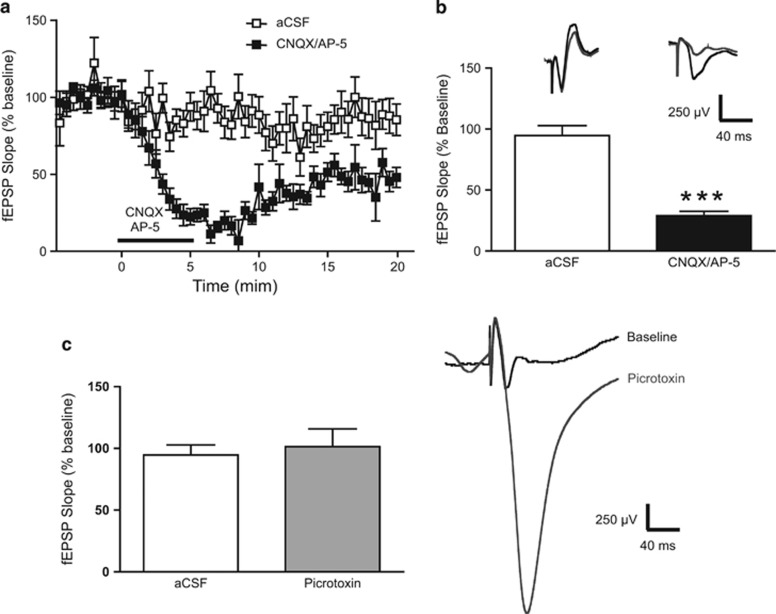
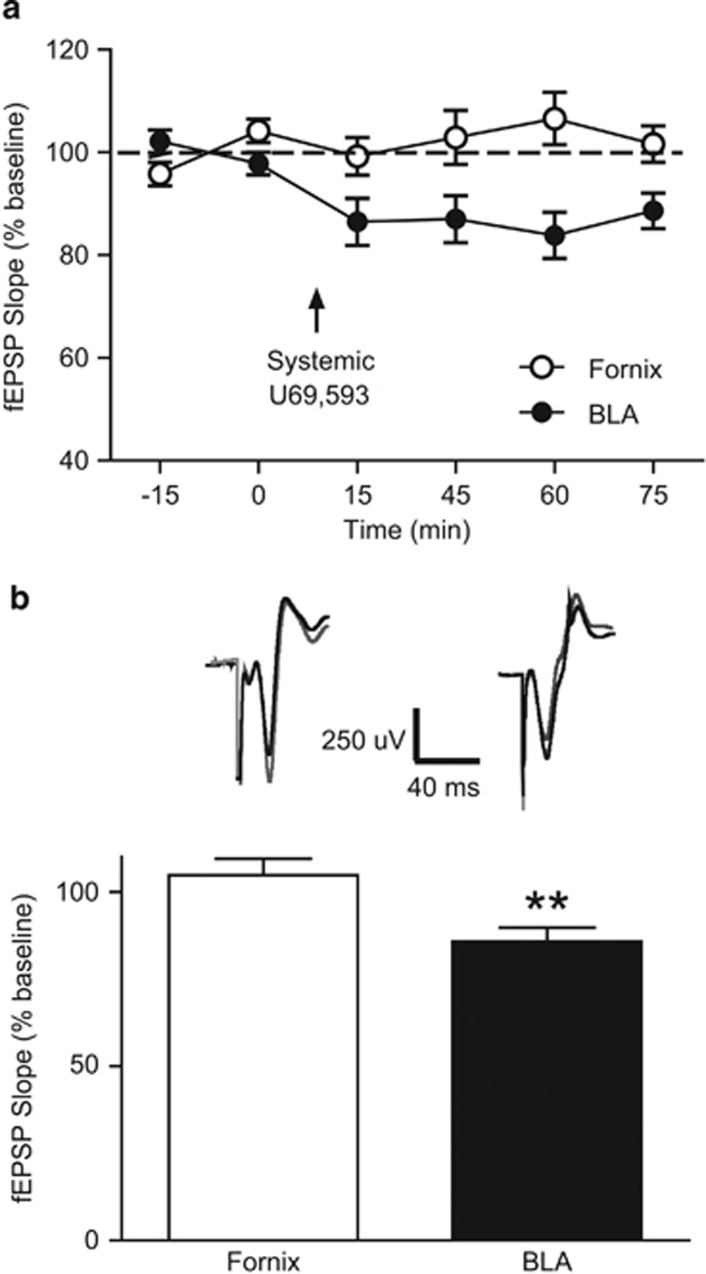
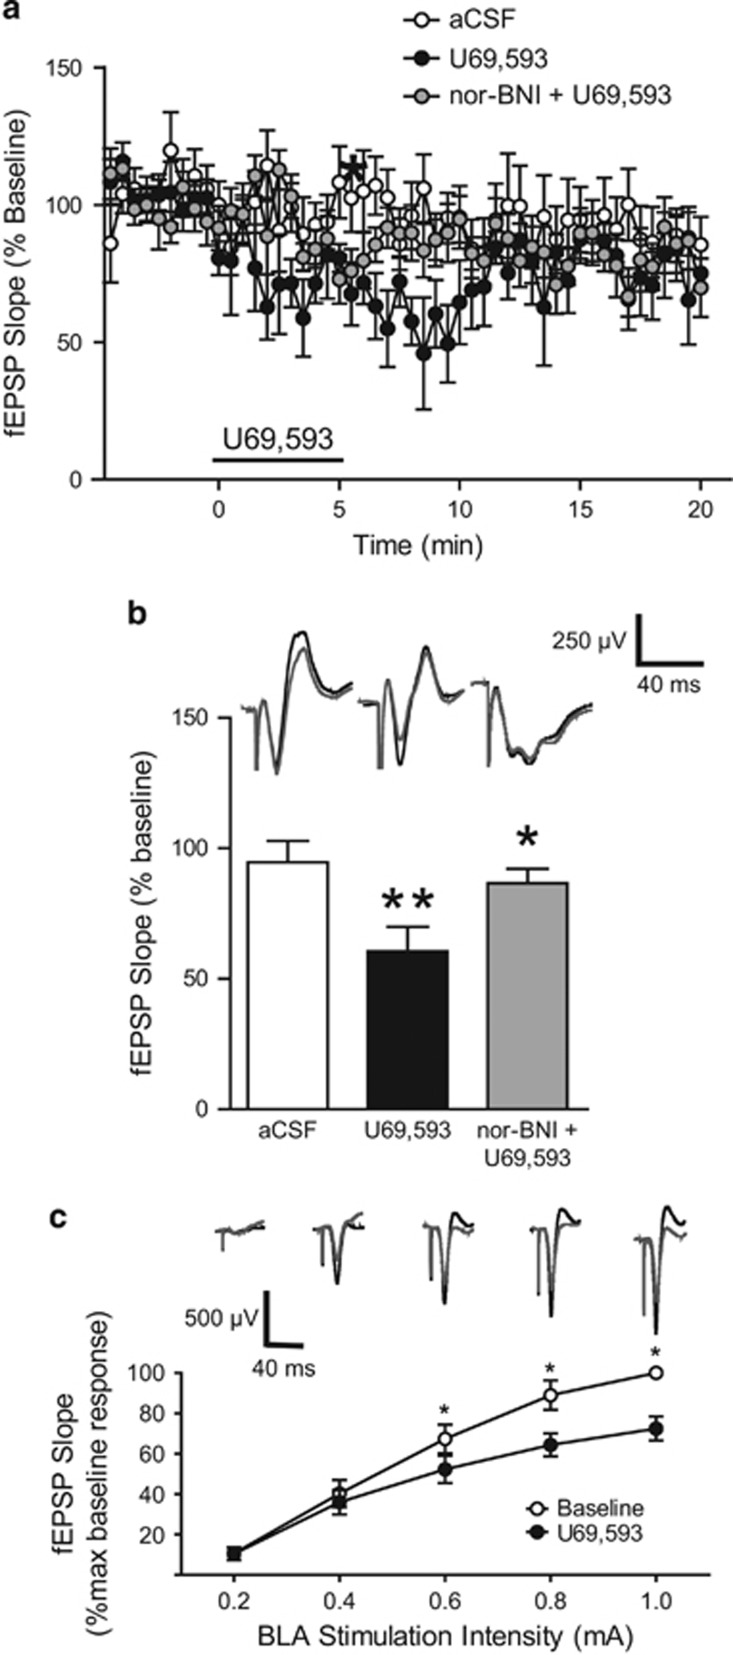
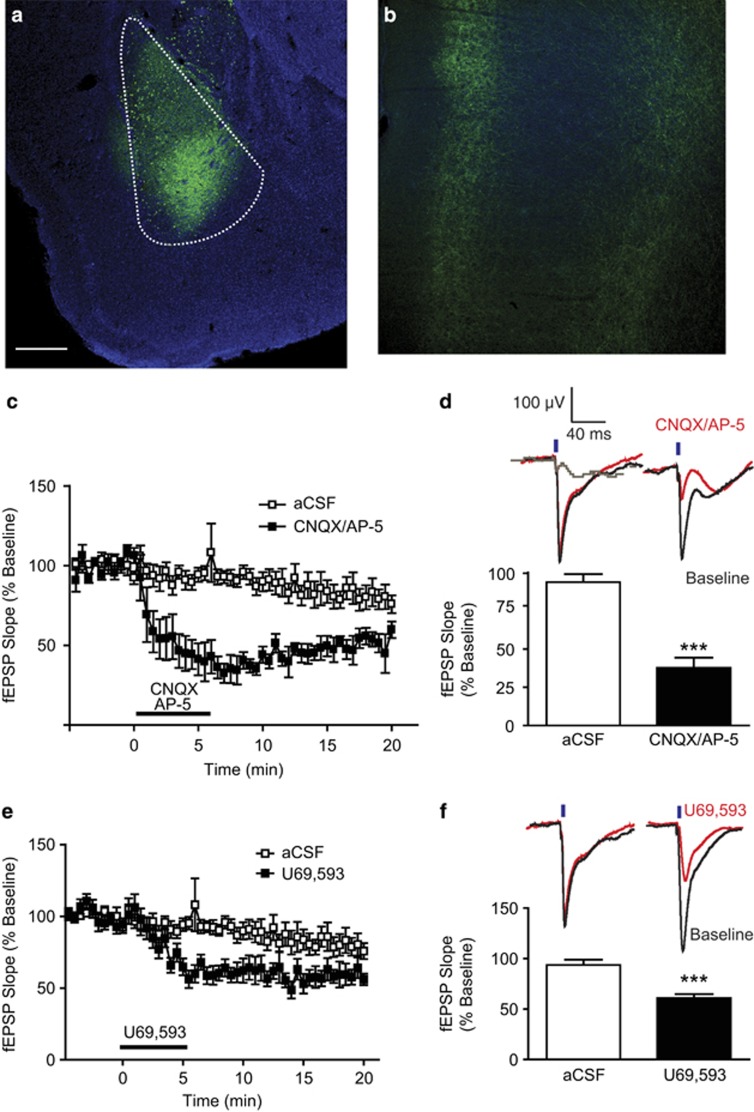
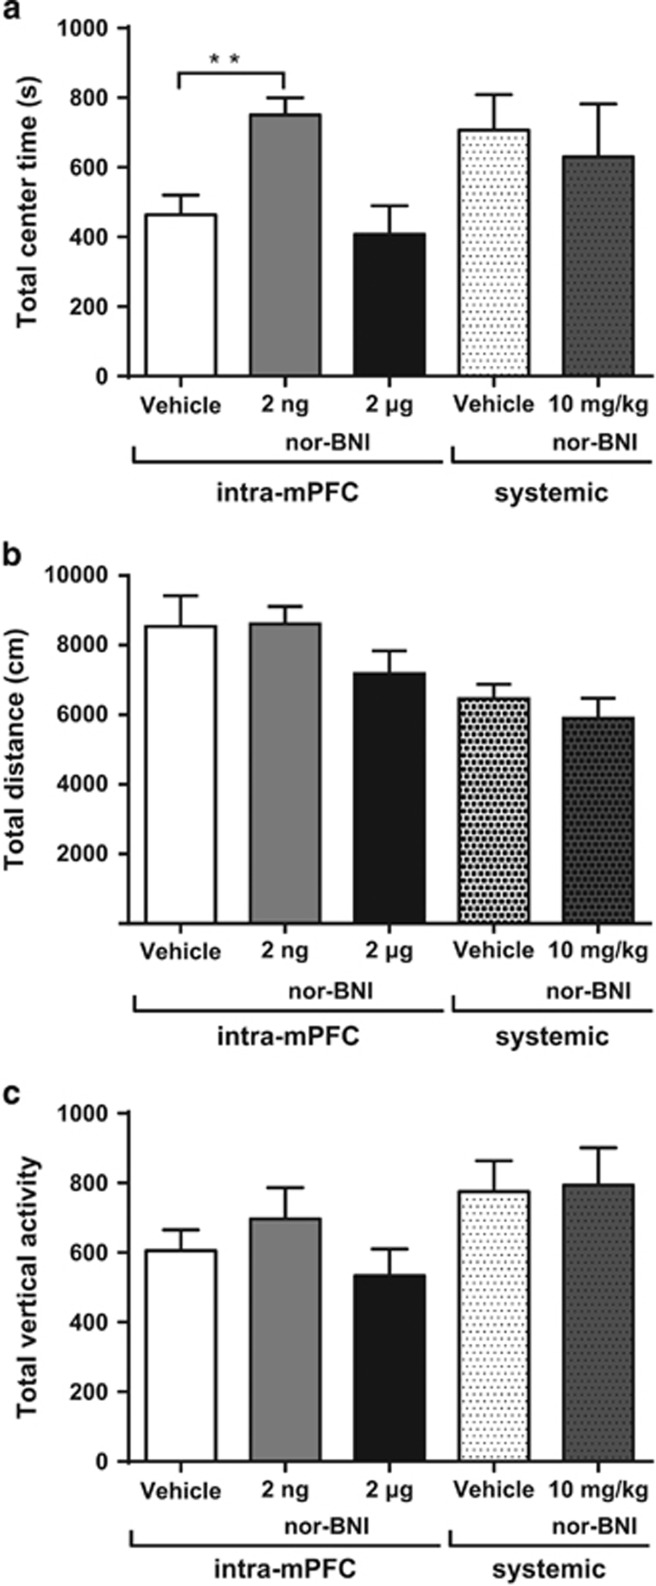
Kappa opioid receptors (KORs) have been implicated in anxiety and stress, conditions that involve activation of projections from the basolateral amygdala (BLA) to the medial prefrontal cortex (mPFC). Although KORs have been studied in several brain regions, their role on mPFC physiology and on BLA projections to the mPFC remains unclear. Here, we explored whether KORs modify synaptic inputs from the BLA to the mPFC using in vivo electrophysiological recordings with electrical and optogenetic stimulation. Systemic administration of the KOR agonist U69,593 inhibited BLA-evoked synaptic responses in the mPFC without altering hippocampus-evoked responses. Intra-mPFC U69,593 inhibited electrical and optogenetic BLA-evoked synaptic responses, an effect blocked by the KOR antagonist nor-BNI. Bilateral intra-mPFC injection of the KOR antagonist nor-BNI increased center time in the open field test, suggesting an anxiolytic effect. The data demonstrate that mPFC KORs negatively regulate glutamatergic synaptic transmission in the BLA-mPFC pathway and anxiety-like behavior. These findings provide a framework whereby KOR signaling during stress and anxiety can regulate the flow of emotional state information from the BLA to the mPFC.
Figures
Similar articles
-
Prefrontal cortical kappa-opioid receptor modulation of local neurotransmission and conditioned place aversion.Neuropsychopharmacology. 2013 Aug;38(9):1770-9. doi: 10.1038/npp.2013.76. Epub 2013 Mar 29. Neuropsychopharmacology. 2013. PMID: 23542927 Free PMC article.
-
Age-dependent regulation of GABA transmission by kappa opioid receptors in the basolateral amygdala of Sprague-Dawley rats.Neuropharmacology. 2017 May 1;117:124-133. doi: 10.1016/j.neuropharm.2017.01.036. Epub 2017 Feb 3. Neuropharmacology. 2017. PMID: 28163104 Free PMC article.
-
Stress-Induced Reinstatement of Nicotine Preference Requires Dynorphin/Kappa Opioid Activity in the Basolateral Amygdala.J Neurosci. 2016 Sep 21;36(38):9937-48. doi: 10.1523/JNEUROSCI.0953-16.2016. J Neurosci. 2016. PMID: 27656031 Free PMC article.
-
Regulation of conditioned responses of basolateral amygdala neurons.Physiol Behav. 2002 Dec;77(4-5):489-93. doi: 10.1016/s0031-9384(02)00909-5. Physiol Behav. 2002. PMID: 12526988 Review.
-
Amygdala-prefrontal interactions in (mal)adaptive learning.Trends Neurosci. 2015 Mar;38(3):158-66. doi: 10.1016/j.tins.2014.12.007. Epub 2015 Jan 9. Trends Neurosci. 2015. PMID: 25583269 Free PMC article. Review.
Cited by
-
Role of the Prefrontal Cortex in Pain Processing.Mol Neurobiol. 2019 Feb;56(2):1137-1166. doi: 10.1007/s12035-018-1130-9. Epub 2018 Jun 6. Mol Neurobiol. 2019. PMID: 29876878 Free PMC article. Review.
-
Contribution of Dynorphin and Orexin Neuropeptide Systems to the Motivational Effects of Alcohol.Handb Exp Pharmacol. 2018;248:473-503. doi: 10.1007/164_2018_100. Handb Exp Pharmacol. 2018. PMID: 29526023 Free PMC article.
-
Opioid Receptor-Mediated Regulation of Neurotransmission in the Brain.Front Mol Neurosci. 2022 Jun 15;15:919773. doi: 10.3389/fnmol.2022.919773. eCollection 2022. Front Mol Neurosci. 2022. PMID: 35782382 Free PMC article. Review.
-
Opioid modulation of prefrontal cortex cells and circuits.Neuropharmacology. 2024 May 1;248:109891. doi: 10.1016/j.neuropharm.2024.109891. Epub 2024 Feb 27. Neuropharmacology. 2024. PMID: 38417545 Free PMC article. Review.
-
The projection from dorsal medial prefrontal cortex to basolateral amygdala promotes behaviors of negative emotion in rats.Front Neurosci. 2024 Jan 24;18:1331864. doi: 10.3389/fnins.2024.1331864. eCollection 2024. Front Neurosci. 2024. PMID: 38327845 Free PMC article.
References
-
- Bacon SJ, Headlam AJ, Gabbott PL, Smith AD (1996). Amygdala input to medial prefrontal cortex (mPFC) in the rat: a light and electron microscope study. Brain Res 720: 211–219. - PubMed
-
- Bals-Kubik R, Ableitner A, Herz A, Shippenberg TS (1993). Neuroanatomical sites mediating the motivational effects of opioids as mapped by the conditioned place preference paradigm in rats. J Pharmacol Exp Ther 264: 489–495. - PubMed
-
- Bazov I, Kononenko O, Watanabe H, Kuntic V, Sarkisyan D, Taqi MM et al (2013). The endogenous opioid system in human alcoholics: molecular adaptations in brain areas involved in cognitive control of addiction. Addict Biol 18: 161–169. - PubMed
Publication types
MeSH terms
Substances
Grants and funding
LinkOut - more resources
Full Text Sources
Other Literature Sources
