. 2015 Jul 1;26(13):2505-18.
doi: 10.1091/mbc.E14-12-1627. Epub 2015 May 13.

Interaction of CK1δ with γTuSC ensures proper microtubule assembly and spindle positioning

Affiliations

Interaction of CK1δ with γTuSC ensures proper microtubule assembly and spindle positioning

Yutian Peng et al. Mol Biol Cell. .

Abstract

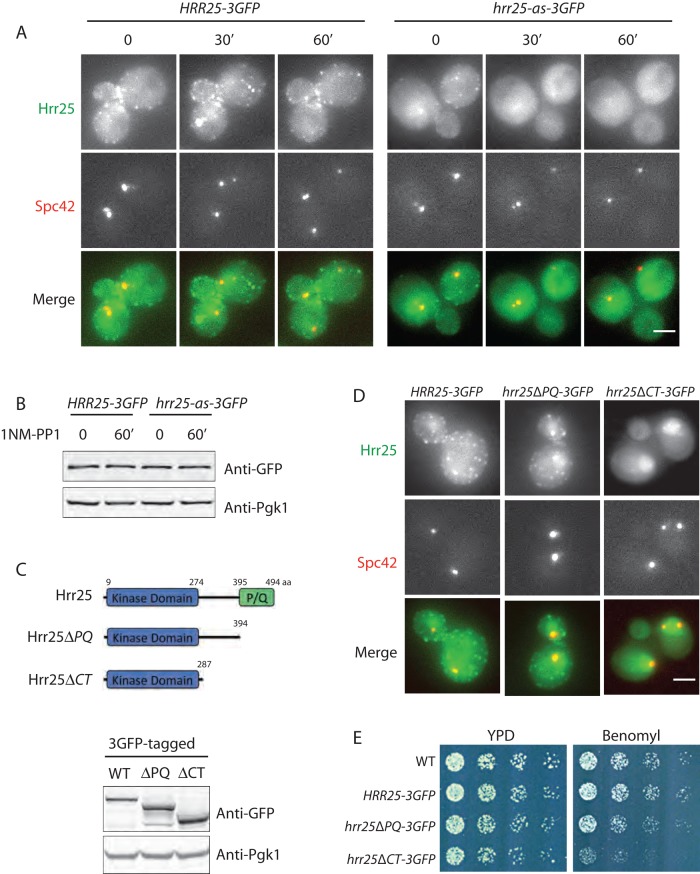
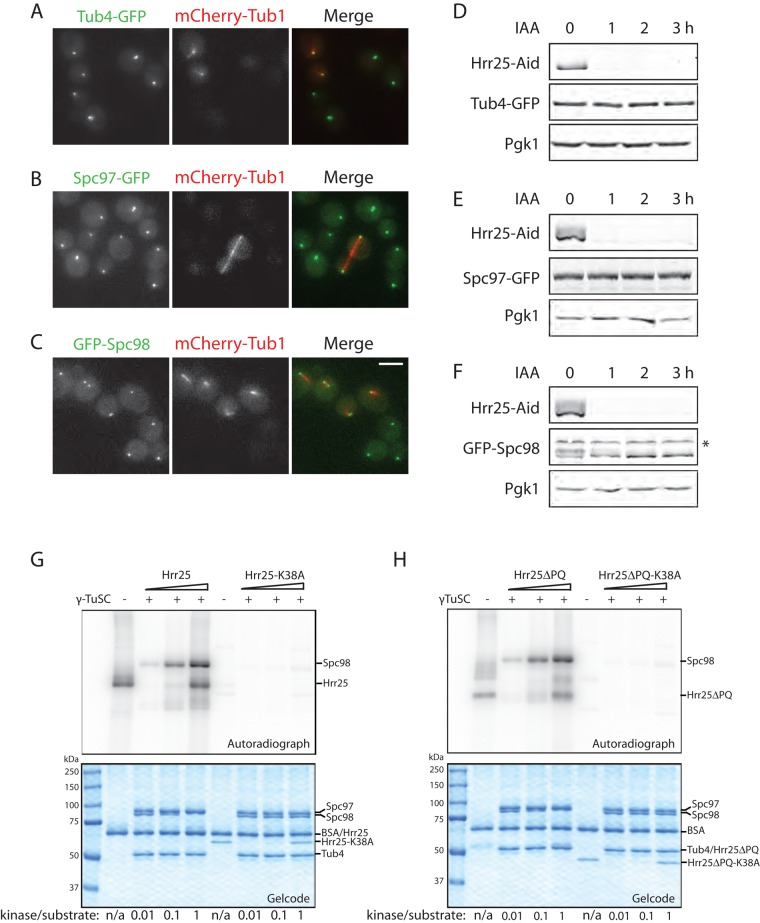
Casein kinase 1δ (CK1δ) family members associate with microtubule-organizing centers (MTOCs) from yeast to humans, but their mitotic roles and targets have yet to be identified. We show here that budding yeast CK1δ, Hrr25, is a γ-tubulin small complex (γTuSC) binding factor. Moreover, Hrr25's association with γTuSC depends on its kinase activity and its noncatalytic central domain. Loss of Hrr25 kinase activity resulted in assembly of unusually long cytoplasmic microtubules and defects in spindle positioning, consistent with roles in regulation of γTuSC-mediated microtubule nucleation and the Kar9 spindle-positioning pathway, respectively. Hrr25 directly phosphorylated γTuSC proteins in vivo and in vitro, and this phosphorylation promoted γTuSC integrity and activity. Because CK1δ and γTuSC are highly conserved and present at MTOCs in diverse eukaryotes, similar regulatory mechanisms are expected to apply generally in eukaryotes.


Figures

FIGURE 1:
FIGURE 1:
Hrr25 is targeted to three distinct cellular structures by three specific proteins/protein complexes. (A) Hrr25-TAP was purified, and the indicated Hrr25-associated proteins were identified by mass spectrometry. Red lines represent the interactions identified in this study, and black lines represent the interactions reported previously. A complete list of Hrr25-associated proteins is provided in Supplemental Table S4. (B) Maximum intensity Z-projection of Hrr25-3GFP in wild-type, ede1Δ, cyk3Δ, and ede1Δ cyk3Δ cells. Scale bar, 2 μm. (C) Maximum intensity Z-projections of Hrr25-3GFP with a kinetochore protein (Mtw1-RFP) or a SPB protein (Spc42-mCherry) in ede1Δ cells. Scale bar, 2 μm. (D) Immuno–electron micrograph (EM) of Hrr25-3GFP location. Two sections of the same cell are shown. Hrr25-3GFP location was identified by immunolabeling using a GFP antibody and a colloidal gold-conjugated secondary antibody. The immuno-EM labeling of nine cells expressing Hrr25-GFP was evaluated from two or three sections per cell that included one or both of the SPBs and part of the nucleus. Of 122 gold particles on the cells, 28 were on the inner plaque of the SPB, with only two particles on other parts of the SPB. There were 70 particles in the nucleus and 22 particles in the cytoplasm. All of this signal likely reports the location of Hrr25-GFP because the conditions and anti-GFP reagents used in this experiment give nearly no background signal on cells lacking GFP. Of importance, the high number of particles over the small area of the inner plaque clearly suggests that the SPB inner plaque is the major cellular location of Hrr25. MT, microtubules; NE, nuclear envelope; SPB, spindle pole body. Scale bar, 100 nm. (E, F) The indicated auxin-inducible degron (AID) cells were treated with 0.1 mM auxin for 30 min at 25°C. Cells were collected and subjected to immunoblotting (E) and imaging (F). Maximum intensity Z-projections of Hrr25-3GFP in wild-type or ede1Δ cells are shown. Scale bars, 2 μm.
FIGURE 2:
FIGURE 2:
Hrr25 localization at spindle pole bodies depends on its kinase activity and noncatalytic C-terminus. (A) Cells expressing Hrr25-3GFP and Spc42-mCherry or Hrr25-as-3GFP and Spc42-mCherry from their respective endogenous genomic loci were treated with 35 μM 1NM-PP1 (or an equal volume of dimethyl sulfoxide) at 25°C. Maximum intensity Z-projections of representative cells are shown. Scale bar, 2 μm. (B) HRR25-3GFP and hrr25-as-3GFP cells were treated as described. Whole-cell protein extracts were analyzed by immunoblotting. (C) Whole-cell protein extracts from cells expressing HRR25-3GFP, hrr25ΔPQ-3GFP, and hrr25ΔCT-3GFP were analyzed by immunoblotting. (D) Maximum intensity Z-projections of Hrr25-3GFP, Hrr25ΔPQ-3GFP, and Hrr25ΔCT-3GFP with Spc42-mCherry. Representative cells are shown. Scale bar, 2 μm. (E) Equal numbers of indicated cells were grown on YPD or YPD containing benomyl (10 μg/ml) plates at 25°C.
FIGURE 3:
FIGURE 3:
Loss of Hrr25 kinase activity results in long cytoplasmic microtubules in G1 phase. (A) Equal numbers of wild-type and HRR25-AID cells were grown on the indicated YPD supplemented plates at 25°C. Benomyl, 15 μg/ml; auxin, 0.1 mM. (B) Equal numbers of wild-type, HRR25, and hrr25-as cells were grown on the indicated YPD supplemented plates at 25°C. Benomyl, 15 μg/ml; 1NM-PP1, 200 nM. (C) HRR25 and hrr25-as cells expressing GFP-Tub1 and Spc42-mCherry were synchronized with α-factor and then released into medium containing 35 μM 1NM-PP1 at 25°C. The cells were imaged at 1 h after release. Maximum intensity Z-projections are presented. Scale bar, 2 μm. (D) The lengths of cytoplasmic microtubules in HRR25 and hrr25-as cells were measured. Averages (black bars) from 20 cells are presented for each strain. Error bars represent SEM.
FIGURE 4:
FIGURE 4:
Hrr25 functions in the Kar9 spindle-positioning pathway. (A) Genetic interactions of HRR25, TUB4, SPC97, and SPC98 with spindle-positioning pathways. Red represents negative genetic interaction, green represents no genetic interaction, and gray represents an interaction not tested. (B) The indicated cells expressing GFP-Tub1 were arrested in 0.1 M hydroxyurea and released into medium containing 35 μM 1NM-PP1 at 25°C. Spindle-positioning defects (both SPBs are present in the mother cells at the late anaphase) were scored at 2 h after release and are presented as percentage of total cells with normal spindle positioning. n = 216, 194, 373, and 367 cells for HRR25 dyn1Δ, hrr25-as dyn1Δ, HRR25 kar9Δ, and hrr25-as kar9Δ, respectively.
FIGURE 5:
FIGURE 5:
Hrr25 phosphorylation of γTuSC in vivo and in vitro. (A) Cells expressing Hrr25-Aid and Tub4-GFP were mixed with cells expressing Tub4-GFP and mCherry-Tub1. The mixed cells were then treated with 1 mM auxin for 3 h and imaged. Maximum intensity Z-projections of representative cells are presented. (B) Cells expressing Hrr25-Aid and Spc97-GFP were mixed with cells expressing Spc97-GFP and mCherry-Tub1. The mixed cells were treated and imaged as in A. (C) Cells expressing Hrr25-Aid and GFP-Spc98 were mixed with cells expressing GFP-Spc98 and mCherry-Tub1. The mixed cells were treated and imaged as in A. Scale bar, 2 μm. (D) Cells expressing Hrr25-Aid and Tub4-GFP were treated with 1 mM auxin at 25°C and collected at the indicated time points for immunoblotting. (E) Cells expressing Hrr25-Aid and Spc97-GFP were treated and subjected to immunoblotting as in D. (F) Cells expressing Hrr25-Aid and GFP-Spc98 were treated and subjected to immunoblotting as in D. *Nonspecific band. (G) γTuSC (2.5 pmol) was incubated with 0, 0.025, 0.25, or 2.5 pmol of Hrr25 or Hrr25-K38A in the presence of [γ32P]ATP at room temperature for 30 min. Phosphorylation was analyzed by autoradiography after SDS–PAGE. (H) The same in vitro kinase assays described in G were performed using Hrr25ΔPQ or Hrr25ΔPQ-K38A.
FIGURE 6:
FIGURE 6:
Hrr25 stimulates γTuSC-mediated microtubule assembly in vitro at low concentrations (25 and 12.5 nM), whereas both Hrr25 and Hrr25-K38A stimulate microtubule assembly at high concentrations (100 and 50 nM). (A) γTuSC (His-tagged) was mixed and incubated with Hrr25ΔPQ or K38AΔPQ (Strep-His-tagged) for 1 h at room temperature in the absence or presence of ATP and MgCl2. Strep-Tactin magnetic beads were added to the protein mixtures and continued to incubate at room temperature for 1 h. The total input (I) and unbound proteins (U) were analyzed by SDS–PAGE and Gelcode blue staining. Kinase:γTuSC indicates the molar ratio of kinase vs. γTuSC. Note that Hrr25ΔPQ ran at the same molecular weight as Tub4. Spc98 demonstrated an upward electrophoretic shift in the presence but not in the absence of ATP. (B) Pig brain tubulin (16 μM) and γTuSC-Spc1101-401 (100 nM γTuSC) were incubated at 30°C for 20 min with no kinase or with the indicated concentrations of Hrr25ΔPQ or K38AΔPQ. Additional control reactions included tubulin incubated with Hrr25ΔPQ or K38AΔPQ in the absence of γTuSC-Spc1101-401. The resulting microtubules were fixed, centrifuged onto coverslips, and visualized by immunofluorescence. Representative images are shown. Scale bar, 20 μm. (C) Microtubules assembled in the assays described in A were quantified. Microtubules in 10 fields were counted for each condition. The mean number of microtubules is shown for each condition (n = 4–7 for nucleation assays with no kinase or 12.5–100 nM kinase; n = 2 for control assays without γTuSC-Spc1101-401). Error bars represent SEM. Two-tailed t tests suggest significant differences in nucleation activity between the γTuSC-Spc1101-401 complex alone and γTuSC-Spc1101-401 with Hrr25ΔPQ (p ≤ 0.15, 12.5 nM; p ≤ 0.06, 25 nM; p ≤ 0.04, 50 nM; p ≤ 0.02, 100 nM) or γTuSC-Spc1101-401 with K38AΔPQ (p ≤ 0.0004, 50 nM; p ≤ 0.02, 100 nM).
FIGURE 7:
FIGURE 7:
Mutation of Hrr25 phosphorylation sites on yeast γ-tubulin support a role in γTuSC regulation in vivo. (A) Side (left) and plus-end views (middle) of a pseudoatomic model of the yeast γ-tubulin ring complex with two enlarged, laterally interacting γ-tubulins (right; Kollman et al., 2015). γ-Tubulins, orange; Spc97/98, gray; GTP-binding residues, navy. Hrr25 phosphorylation sites of interest are highlighted on the γ-tubulins: dark green (S58) indicates the Hrr25 phosphorylation site on the H1-S2 loop. Purple (S71 and S74) indicates the phosphorylation sites on the plus end of γ-tubulin, where it interacts with α-tubulin. Cyan (S208) indicates the phosphorylation site on helix 6. Green (S277, Y279, S290, S291, Y292) indicates phosphorylation sites that reside between γ-tubulin monomers. (B) TUB4-AID cells expressing tub4Δ, wild-type TUB4, or tub4 phosphomutants were grown on YPD medium containing auxin (0.5 mM) or auxin with the indicated concentrations of benomyl at 25°C. (C) TUB4-AID cells expressing tub4Δ, wild-type TUB4, or tub4 phosphomutants along with GFP-Spc98 and mCherry-Tub4 were treated with 0.5 mM auxin for 1 h at 25°C before imaging. Maximum intensity Z-projections of representative cells are presented. Scale bar, 2 μm.

Similar articles

Cited by

References

    1. Aldaz H, Rice LM, Stearns T, Agard DA. Insights into microtubule nucleation from the crystal structure of human gamma-tubulin. Nature. 2005;435:523–527. - PubMed
    1. Alvarado-Kristensson M, Rodriguez MJ, Silio V, Valpuesta JM, Carrera AC. SADB phosphorylation of gamma-tubulin regulates centrosome duplication. Nat Cell Biol. 2009;11:1081–1092. - PubMed
    1. Andersen JS, Wilkinson CJ, Mayor T, Mortensen P, Nigg EA, Mann M. Proteomic characterization of the human centrosome by protein correlation profiling. Nature. 2003;426:570–574. - PubMed
    1. Bahtz R, Seidler J, Arnold M, Haselmann-Weiss U, Antony C, Lehmann WD, Hoffmann I. GCP6 is a substrate of Plk4 and required for centriole duplication. J Cell Sci. 2012;125:486–496. - PubMed
    1. Behrend L, Stoter M, Kurth M, Rutter G, Heukeshoven J, Deppert W, Knippschild U. Interaction of casein kinase 1 delta (CK1delta) with post-Golgi structures, microtubules and the spindle apparatus. Eur J Cell Biol. 2000;79:240–251. - PubMed

Publication types

MeSH terms