. 2015 Jul 1;26(13):2491-504.
doi: 10.1091/mbc.E14-12-1619. Epub 2015 May 13.

A novel tropomyosin isoform functions at the mitotic spindle and Golgi in Drosophila

Affiliations

A novel tropomyosin isoform functions at the mitotic spindle and Golgi in Drosophila

Lauren M Goins et al. Mol Biol Cell. .

Abstract

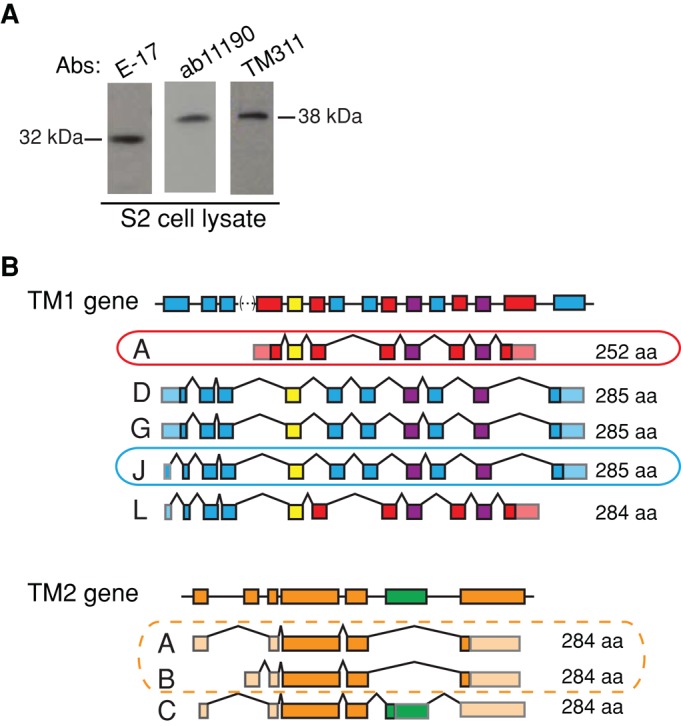
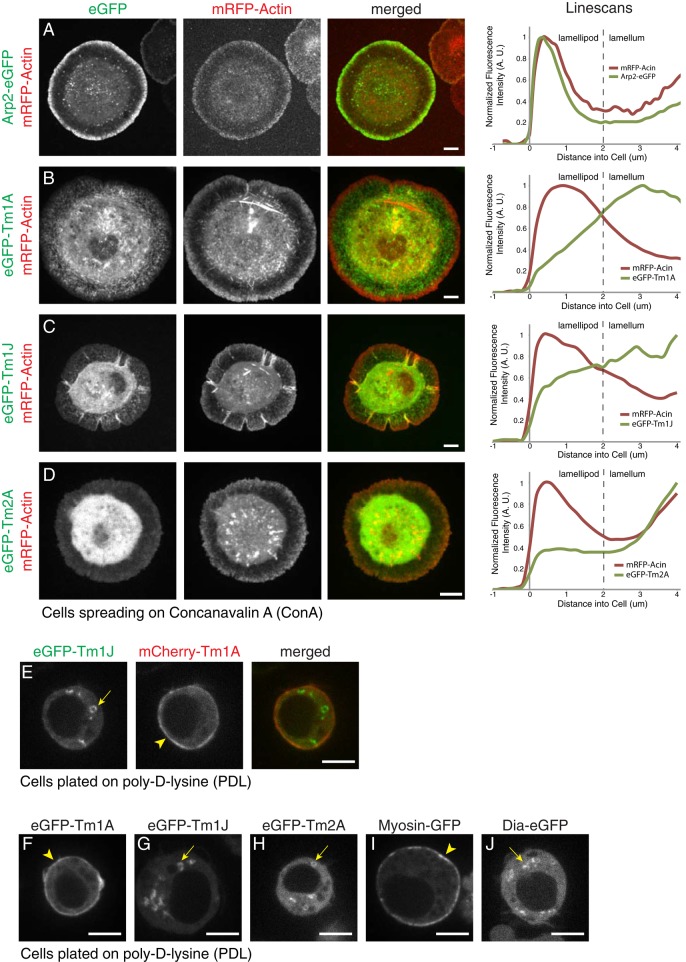
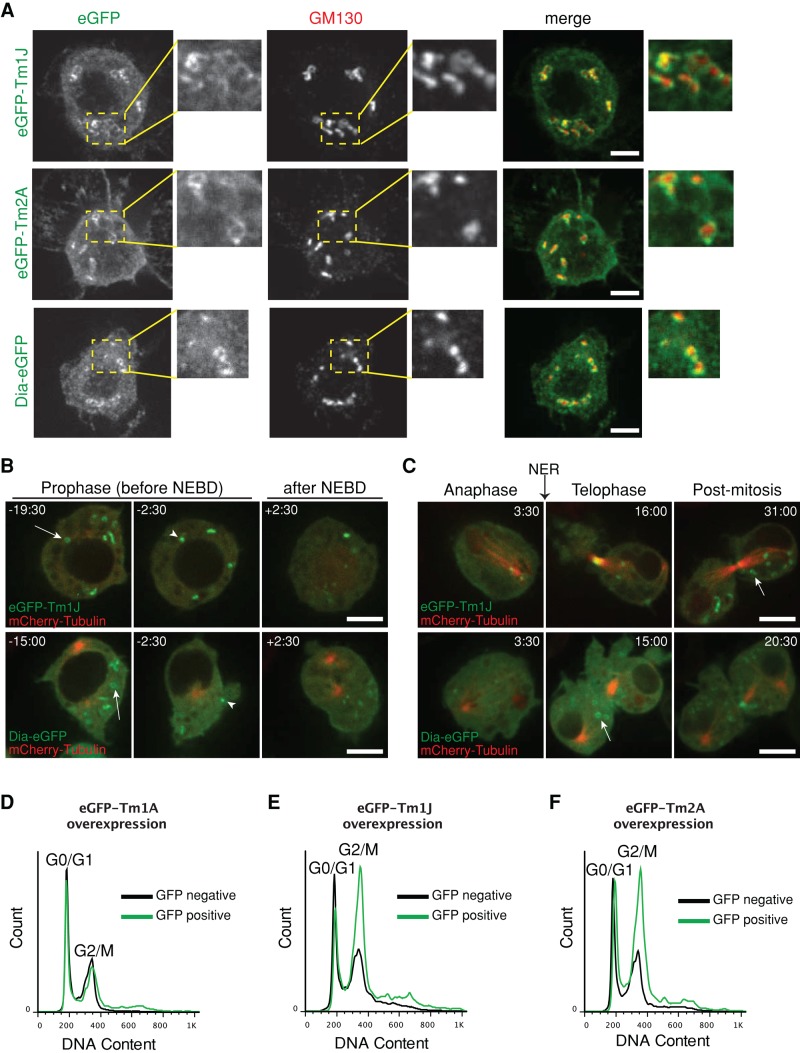
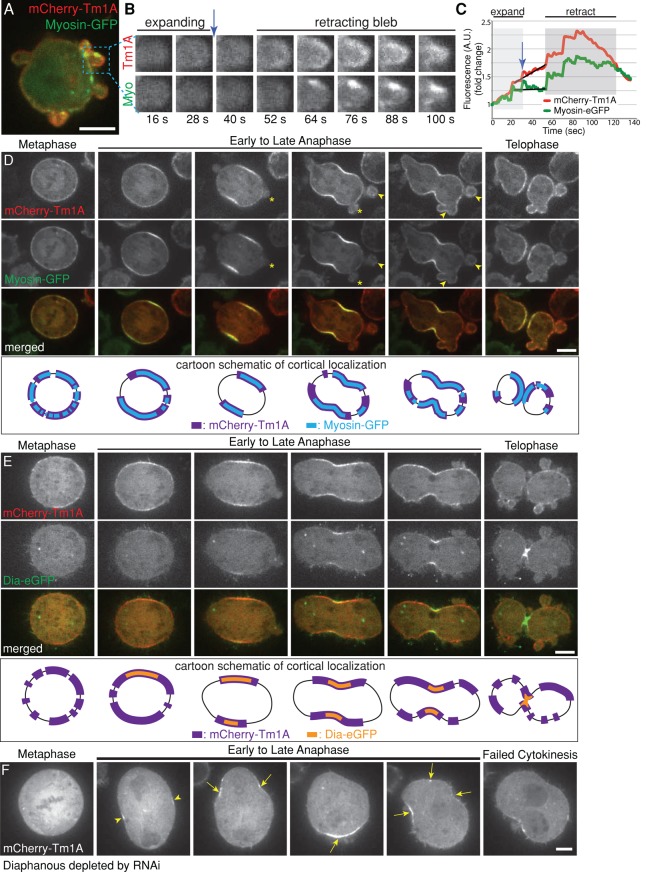
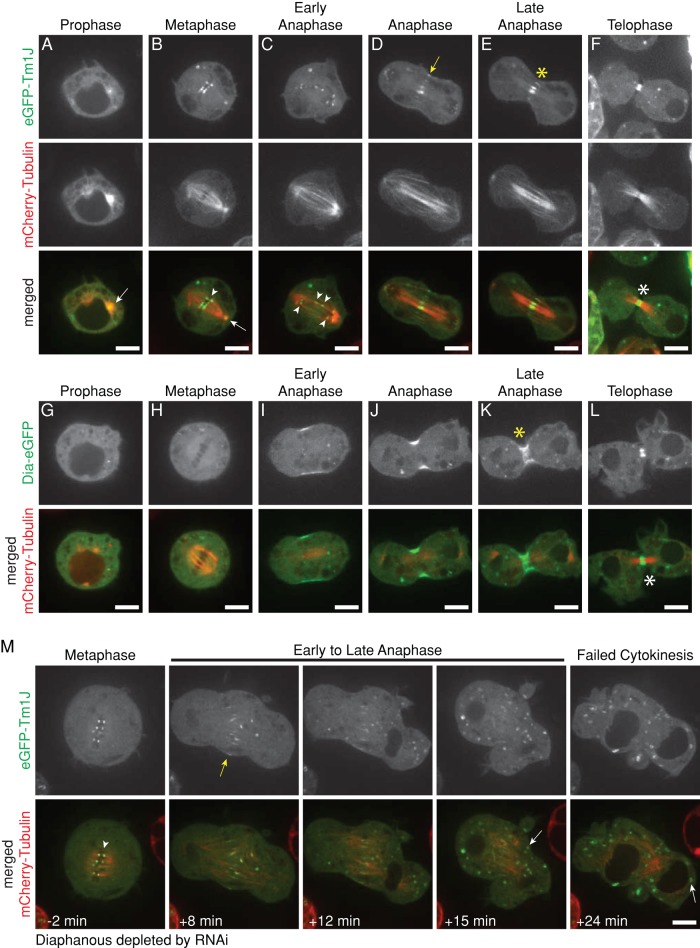
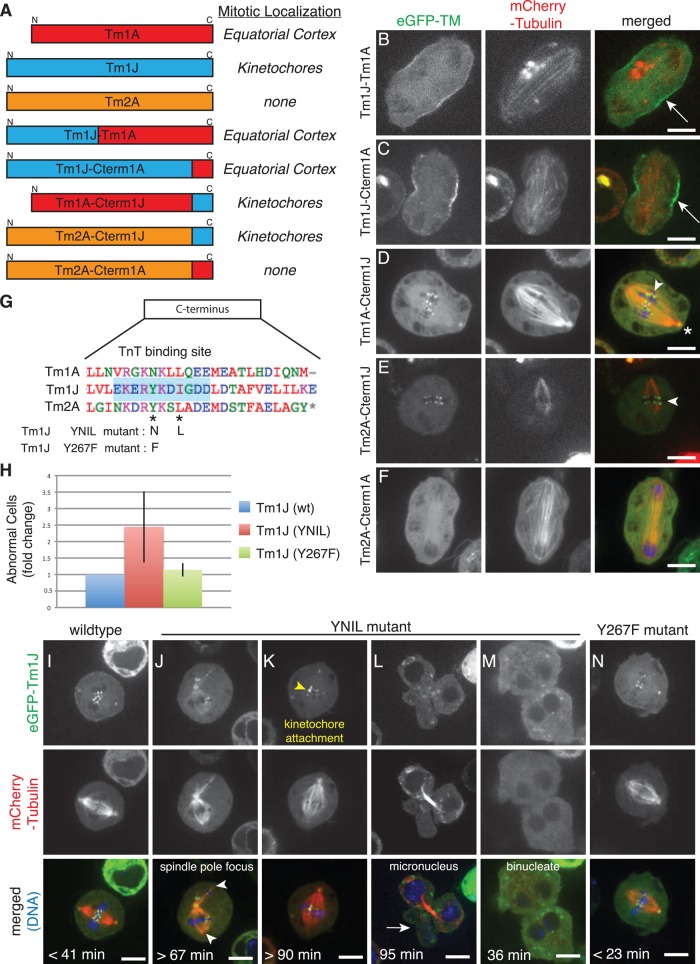
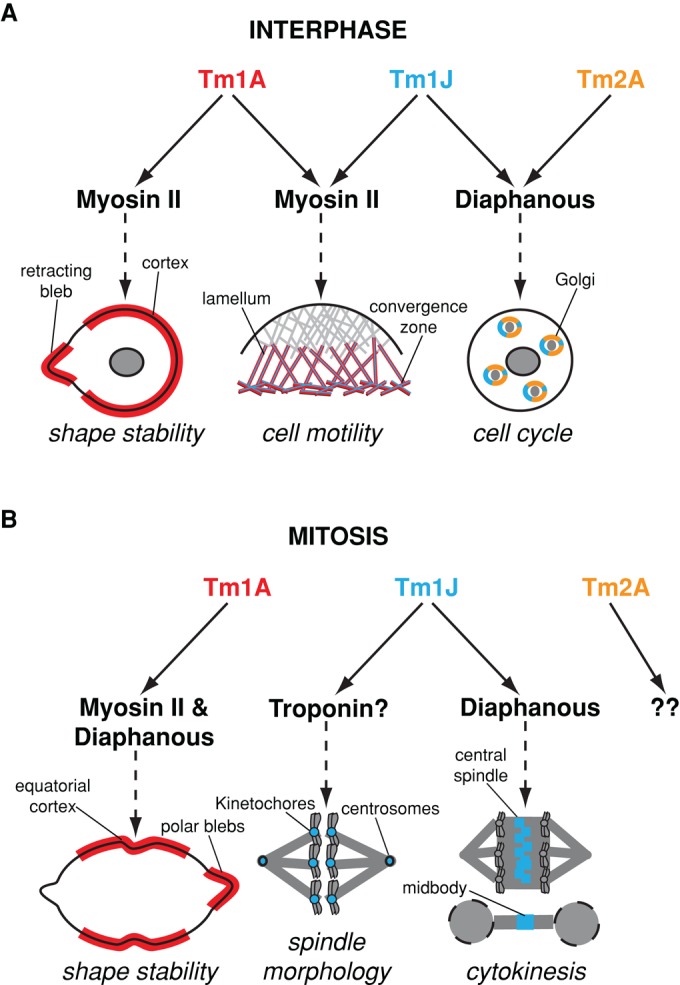
Most eukaryotic cells express multiple isoforms of the actin-binding protein tropomyosin that help construct a variety of cytoskeletal networks. Only one nonmuscle tropomyosin (Tm1A) has previously been described in Drosophila, but developmental defects caused by insertion of P-elements near tropomyosin genes imply the existence of additional, nonmuscle isoforms. Using biochemical and molecular genetic approaches, we identified three tropomyosins expressed in Drosophila S2 cells: Tm1A, Tm1J, and Tm2A. The Tm1A isoform localizes to the cell cortex, lamellar actin networks, and the cleavage furrow of dividing cells--always together with myosin-II. Isoforms Tm1J and Tm2A colocalize around the Golgi apparatus with the formin-family protein Diaphanous, and loss of either isoform perturbs cell cycle progression. During mitosis, Tm1J localizes to the mitotic spindle, where it promotes chromosome segregation. Using chimeras, we identified the determinants of tropomyosin localization near the C-terminus. This work 1) identifies and characterizes previously unknown nonmuscle tropomyosins in Drosophila, 2) reveals a function for tropomyosin in the mitotic spindle, and 3) uncovers sequence elements that specify isoform-specific localizations and functions of tropomyosin.


Figures

FIGURE 1:
FIGURE 1:
Drosophila S2 cells express three tropomyosin isoforms: Tm1A, Tm1J, and Tm2A/B. (A) Western blots show that at least two tropomyosin isoforms are present in S2 cell lysates: one 32 kDa in size and one 38 kDa in size. Three commercial antibodies were used: E-17 (goat; Santa Cruz Biotechnology), ab11190 (rabbit; Abcam), and TM311 (mouse; Sigma-Aldrich). (B) Schematic of Drosophila Tm1 and Tm2 gene structures. Predicted splice variants producing tropomyosin isoforms of 32 or 38 kDa in size (i.e., “canonical”) are displayed below and are based on FlyBase (FB2008_09, Dmel Release 5.12). Left, splice variant name. Right, amino acid length. Circled isoforms were confirmed through various methods (details in Supplemental Figure S1).
FIGURE 2:
FIGURE 2:
Tm1A and Tm1J colocalize in spreading cells but do not colocalize in nonspreading cells. (A–D) Live-cell imaging of S2 cells spreading on ConA with mRFP-actin (red), a marker of the lamellipod, and eGFP-tagged proteins (green): Arp2 (A), Tm1A (B), Tm1J (C), and Tm2A (D). Arp2 localizes to the lamellipod with mRFP-actin, whereas Tm1A and Tm1J both localize to the lamellum and are excluded from the lamellipod. Tm2A shows no significant localization. Right, normalized average fluorescence intensity line scans. (E) Coexpression of eGFP-Tm1J (green) and mCherry-Tm1A (red) in S2 cells on PDL show that in the same cell, Tm1A localizes to the cortex, whereas Tm1J localizes to cytoplasmic ring-like structures. (F–J) Live-cell imaging of interphase S2 cells on PDL with eGFP-tagged proteins: Tm1A, Tm1J, Tm2A, myosin-II, and Diaphanous (Dia). Tm1A (F) and myosin-II (I) colocalize to the cortex (arrowheads), whereas Tm1J (G), Tm2A (H), and Dia (J) localize to cytoplasmic ring-like structures (arrows). mCherry-α-tubulin was coexpressed (not shown) to verify that cells were in interphase. See also Supplemental Figure S2.
FIGURE 3:
FIGURE 3:
Tm1J, Tm2A, and Diaphanous localize to cytoplasmic rings surrounding the Golgi in a cell cycle–dependent manner. (A) The ring-shaped patterns of tropomyosin isoforms, eGFP-Tm1J and eGFP-Tm2A, and Dia-eGFP encircle the immunofluorescence cis-Golgi marker, GM130 (red). Areas outlined by yellow dashed box in left-hand images are enlarged in the right-hand images. (B) eGFP-Tm1J and Dia-eGFP rings (arrows) localize to the Golgi in late G2 phase but during prophase begin to disassemble (arrowheads) minutes before nuclear envelope breakdown (NEBD) at the onset of mitosis and fully disperse after NEBD. Times indicated are relative to NEBD. See also Supplemental Figure 3 Videos 1 and 2. (C) At the end of mitosis, eGFP-Tm1J and Dia-eGFP rings (arrows) reform at the Golgi during telophase after the nuclear envelope reforms (NER). Times indicated are relative to the onset of anaphase. (D–F) Cell cycle analysis using flow cytometry shows that overexpression of eGFP-tagged Golgi-related TMs Tm1J (E) or Tm2A (F) but not Tm1A (D) causes an increase in the population of cells in G2/M phase. After >24 h of induction at 1 mM CuSO4, S2 cells were fixed and stained with propidium iodide (a DNA marker). Graphs depict histograms of DNA content of GFP-negative (black) and GFP-positive (green) cells (displayed as overlays).
FIGURE 4:
FIGURE 4:
Tm1A colocalizes with myosin-II but only partially overlaps with Diaphanous in the cleavage furrow, where Diaphanous is required for retention, but not recruitment, of Tm1A. (A–C) During interphase, mCherry-Tm1A and myosin-GFP localize to retracting, but not expanding, blebs at the cell periphery. See also Supplemental Figure 4 Video 1. (B) Zoomed-in single-color frames from time-lapse imaging. (C) Graph of total fluorescence intensity in the example bleb over time during bleb expansion (light gray) and bleb retraction (darker gray). (D) During mitosis, Tm1A and myosin-II colocalize at the equatorial cortex (arrow) during early anaphase and to retracting blebs (arrowhead), but not expanding blebs (asterisks), at the cell poles during late anaphase and telophase. Bottom, cartoon schematic illustrating localization of Tm1A (purple) and myosin (blue) in corresponding upper images. See also Supplemental Figure 4 Video 2. (E) During metaphase, Tm1A localizes to the cortex before Dia. As the cell progresses through mitosis, Tm1A occupies a larger, expanding region of the cortex around the periphery of the cell, whereas in contrast, Dia occupies a smaller region in the middle of the cell that seems to concentrate at the site of cleavage furrow ingression. Bottom, schematic diagram illustrating differential localizations of Tm1A (purple) and Dia (orange). See also Supplemental Figure 4 Video 3. (F) Dia is required for retention, not recruitment, of Tm1A to the equatorial cortex during anaphase. mCherry-Tm1A in a dividing cell after depletion of Dia with RNAi. Tm1A still initially localizes to the equatorial cortex (arrowheads), but it does not remain there. As the cell proceeds through anaphase, Tm1A localizes to sites of contraction (arrows) around the periphery of the cell during shape instability. See also Supplemental Figure 4 Video 4.
FIGURE 5:
FIGURE 5:
Tm1J localizes to centrosomes, kinetochores, the central spindle, and midbody during mitosis and requires Diaphanous for localization to the central spindle during anaphase. (A–F) eGFP-Tm1J localizes to the spindle during mitosis. Tm1J is at the centrosomes (arrow) during prophase (A); at kinetochores (arrowhead) and centrosomes (arrow) during metaphase (B); remains associated with separating kinetochores (arrowheads) during early anaphase (C); shifts to the spindle midzone (yellow arrow) and the central spindle (yellow asterisk) during anaphase (D) and late anaphase (E); and becomes tightly focused on the microtubule bundle at the midpoint of the central spindle (white asterisk) during telophase (F). Representative images from two different cells. See also Supplemental Figure 5 Video 1. (G–L) Dia-eGFP localizes to the cleavage furrow during early anaphase (I). However, during late anaphase (K) and telophase (L), Dia localizes to the central spindle (yellow asterisk) and midbody (white asterisk), respectively, similar to Tm1J localization. (M) Diaphanous is required for Tm1J localization to the central spindle and midpoint in dividing cells but not for Tm1J localization to kinetochores or Golgi. After Diaphanous is depleted by RNAi, eGFP-Tm1J still localizes to kinetochores (arrowhead) during metaphase and the spindle midzone (yellow arrow) during early anaphase but does not localize to the central spindle or midpoint during late anaphase. Tm1J instead relocates from the spindle midzone directly to Golgi (white arrows) during late anaphase. Times indicated are relative to anaphase onset. See also Supplemental Figure 5 Video 2.
FIGURE 6:
FIGURE 6:
The C-terminus determines mitotic localization of tropomyosin isoforms, and mutational analysis shows that Tm1J participates in chromosome segregation and spindle morphology during mitosis. (A–F) Protein sequences in the C-terminus determine the localization of TM isoforms during mitosis. (A) Left, names and diagrams of TM isoform chimera constructs imaged during mitosis. Right, chart of results indicating whether each TM chimera localizes to “kinetochores” during metaphase, the “equatorial cortex” during anaphase, or no significant localization (“none”). (B–F) Images of dividing S2 cells expressing the indicated TM chimera tagged with eGFP (left) or mCherry-tubulin (middle) and merged images (eGFP, green; tubulin, red). Tm1J-Tm1A (B) and Tm1J-Cterm1A (C) both localize to the equatorial cortex (arrows). Tm1A-Cterm1J (D) and Tm2A-Cterm1J (E) both localize to kinetochores (arrowheads) and centrosomes (asterisk), whereas Tm2A-Cterm1A (F) shows no significant localization. (G) Alignments of the C-terminal regions of all three nonmuscle TM isoforms show that Tm1J, but not Tm1A or Tm2A, contains a consensus binding site for troponin T (blue shaded box). The “YNIL” mutant mutates two of the amino acids of this binding site, from Y267 to N and I270 to L, and has been shown to decrease binding to troponin T, whereas “Y267F” mutates Y267 to F. (H) Expression of the Tm1J YNIL mutation leads to an increase in the percentage of abnormal mitoses relative to cells expressing wild-type Tm1J, but expression of Tm1J-Y267F does not. (I–N) Representative images of dividing S2 cells expressing Tm1J wild type (I), YNIL mutant (J–M), or Y267F mutant (N). Supplemental Figure 6 Video 1 depicts cell shown in J. Hoechst 33258 was used to visualize DNA (blue). Time from NEBD to anaphase onset is noted in bottom left corner. Descriptions of mutant phenotypes are indicated on specific example cells.
FIGURE 7:
FIGURE 7:
Model of Drosophila tropomyosin functions throughout the cell cycle. (A) During interphase, Tm1A colocalizes with myosin-II to the cell cortex and retracting membrane blebs, where they function to maintain cortical contractility and shape stability. In spreading cells, Tm1A and Tm1J localize with myosin-II to the lamellum and convergence zone, two networks previously shown to be important for cell motility (Salmon et al., 2002). Tm1J also colocalizes with Tm2A and Diaphanous to actin networks surrounding Golgi ministacks. There they help maintain Golgi architecture and, in so doing, influence cell cycle progression by preventing premature exit from G2 phase into mitosis. (B) During mitosis, Tm1A and myosin-II (Dean et al., 2005) initially colocalize to the equatorial cortex independent of Diaphanous but are maintained at the equator through a Diaphanous-dependent mechanism. Mislocalization of Tm1A causes shape instability and cytokinesis failure. Tm1J, on the other hand, localizes to the mitotic spindle. During metaphase, Tm1J localizes to kinetochores and centrosomes and may function with the troponin regulatory complex to influence spindle morphology, anaphase progression, and chromosome segregation. During anaphase, through a Diaphanous-dependent mechanism, Tm1J localization shifts to the central spindle and midbody, two structures previously shown to be important for cytokinesis (Giansanti et al., 1998).

Similar articles

Cited by

References

    1. Basi GS, Boardman M, Storti RV. Alternative splicing of a Drosophila tropomyosin gene generates muscle tropomyosin isoforms with different carboxy-terminal ends. Mol Cell Biol. 1984;4:2828–2836. - PMC - PubMed
    1. Belin BJ, Cimini BA, Blackburn EH, Mullins RD. Visualization of actin filaments and monomers in somatic cell nuclei. Mol Biol Cell. 2013;24:982–994. - PMC - PubMed
    1. Belin BJ, Goins LM, Mullins RD. Comparative analysis of tools for live imaging of actin network architecture. BioArchitecture. 2015 (in press) - PMC - PubMed
    1. Bettencourt-Dias M, Goshima G. RNAi in Drosophila S2 cells as a tool for studying cell cycle progression. Methods Mol Biol. 2009;545:39–62. - PubMed
    1. Blanchoin L, Pollard TD, Hitchcock-DeGregori SE. Inhibition of the Arp2/3 complex-nucleated actin polymerization and branch formation by tropomyosin. Curr Biol. 2001;11:1300–1304. - PubMed

Publication types