. 2015 Jun 26;290(26):16383-92.
doi: 10.1074/jbc.M115.650127. Epub 2015 May 13.

Light-induced Changes in the Dimerization Interface of Bacteriophytochromes

Affiliations

Light-induced Changes in the Dimerization Interface of Bacteriophytochromes

Heikki Takala et al. J Biol Chem. .

Abstract

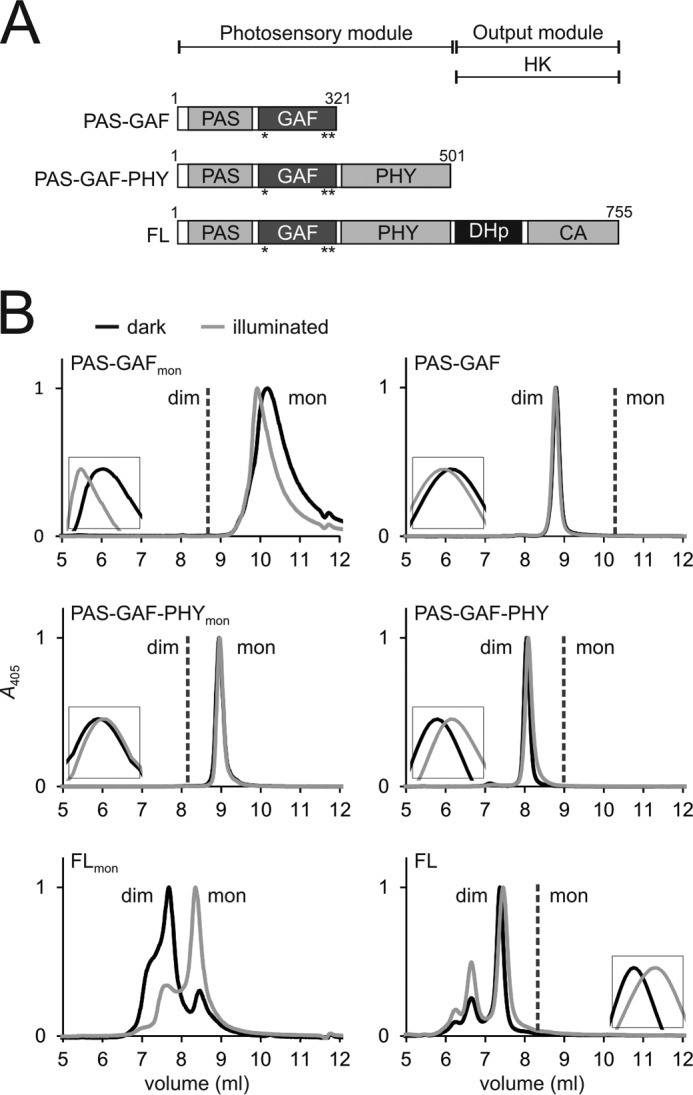
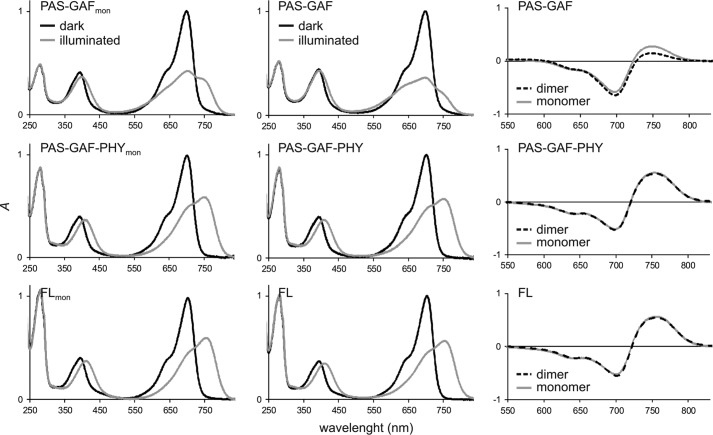
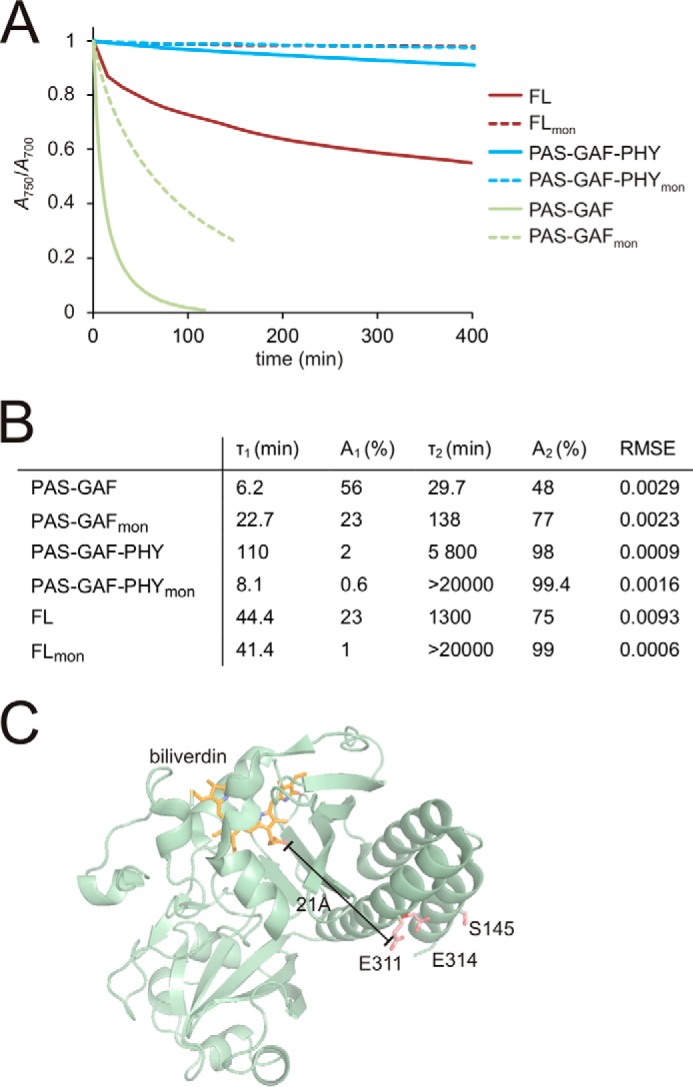
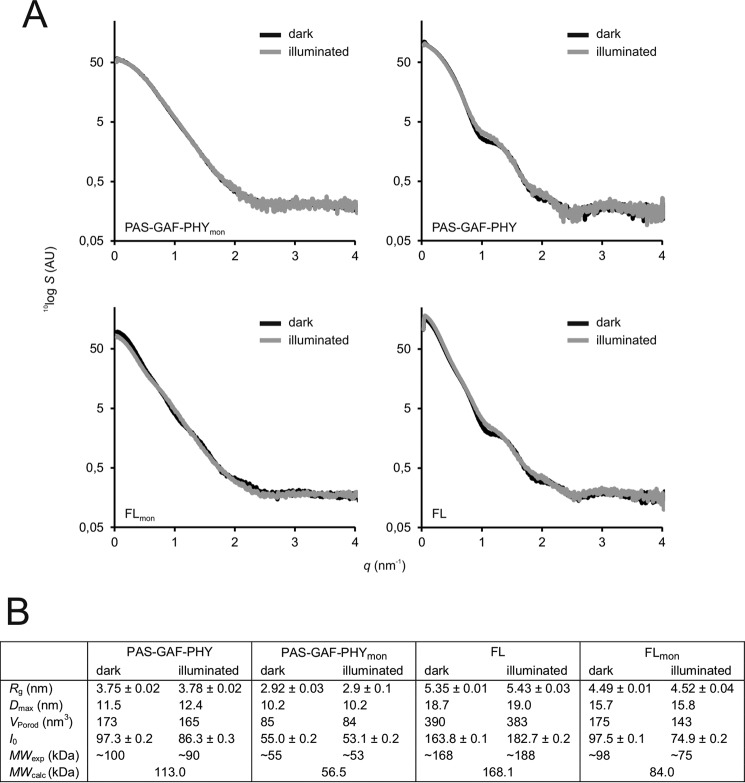
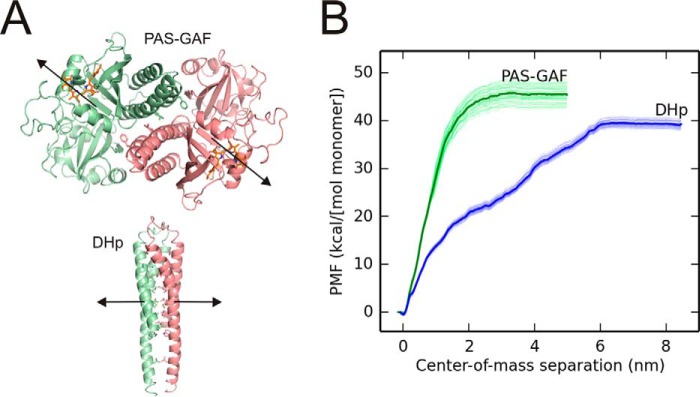
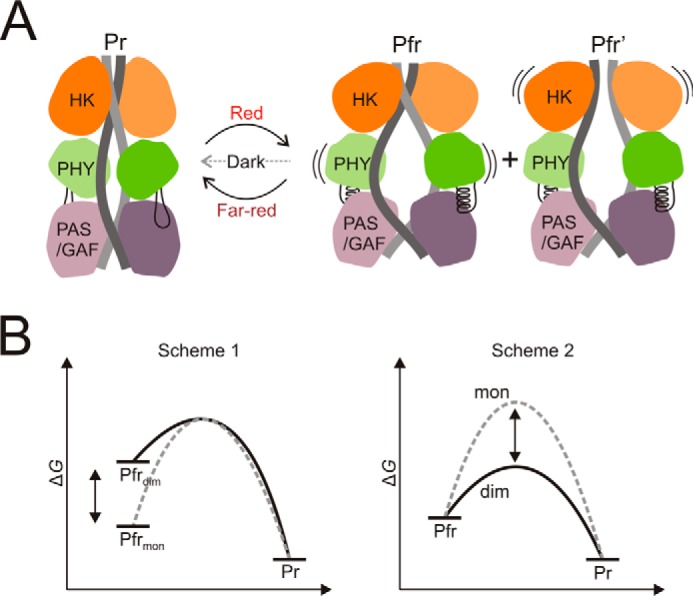
Phytochromes are dimeric photoreceptor proteins that sense red light levels in plants, fungi, and bacteria. The proteins are structurally divided into a light-sensing photosensory module consisting of PAS, GAF, and PHY domains and a signaling output module, which in bacteriophytochromes typically is a histidine kinase (HK) domain. Existing structural data suggest that two dimerization interfaces exist between the GAF and HK domains, but their functional roles remain unclear. Using mutational, biochemical, and computational analyses of the Deinococcus radiodurans phytochrome, we demonstrate that two dimerization interfaces between sister GAF and HK domains stabilize the dimer with approximately equal contributions. The existence of both dimerization interfaces is critical for thermal reversion back to the resting state. We also find that a mutant in which the interactions between the GAF domains were removed monomerizes under red light. This implies that the interactions between the HK domains are significantly altered by photoconversion. The results suggest functional importance of the dimerization interfaces in bacteriophytochromes.

Keywords: cell signaling; dimerization; high performance liquid chromatography (HPLC); histidine kinase; molecular dynamics; mutagenesis; photoreceptor; phytochrome; protein conformation; x-ray scattering.


Figures

FIGURE 1.
FIGURE 1.
Domain organization and size-exclusion analysis of the phytochrome constructs. A, schematic presentation of the phytochrome fragment used. Mutated residues are indicated as asterisks (*). CA, catalytic ATP binding domain). B, the size exclusion of the monomer mutants is shown in the left panels, and the wild-type constructs are shown in the right panels (28). To consider exclusively holoproteins, the retentions are plotted at a 405-nm wavelength. Samples in the dark (Pr) state are plotted as black lines; the illuminated (Pfr-like) samples are plotted as gray lines. Insets show each retention peak in higher magnification. Whether the construct elutes as monomers (mon) or dimers (dim) is indicated in the figure. The calculated molecular masses are 65 kDa (PAS-GAF-PHYmon) and 220/116 kDa (FLmon). The size of PAS-GAFmon has not been approximated because the sample eluted outside the optimal resolution range of the column. The elution profiles verify that the PAS-GAF-PHY mutant is exclusively monomeric. However, the full-length mutant elutes as a monomer/dimer mixture. The Pr state favors dimers and the Pfr state monomers. Note that the dimeric (28) and monomeric proteins were run at slightly different buffer conditions causing a slight drift of the retention peaks.
FIGURE 2.
FIGURE 2.
Absorption spectra of the phytochrome constructs. The left and middle panels show the absorption spectra of the monomer mutants (left) and their wild-type counterparts (middle). Dark (Pr) sample spectra are plotted as black lines, and illuminated (Pfr or Pfr-like) sample spectra are plotted as gray lines. The wild-type fragment spectra (17, 28) and the PAS-GAFmon spectra (42) are published elsewhere and are shown here for comparison. The PAS-GAF-PHY and full-length mutants show almost identical spectra with their wild-type counterparts, whereas the PAS-GAF spectra of the illuminated state are different. The right panels show the Pfr-minus-Pr difference spectra of all six constructs. The difference spectra show that the wild-type and mutant spectra are almost identical in the case of PAS-GAF-PHY and full-length phytochrome, whereas they differ in PAS-GAF fragments.
FIGURE 3.
FIGURE 3.
A, thermal (dark) reversion of the phytochrome constructs. To demonstrate the qualitative differences in the dark reversion, the absorption ratio of A750 and A700 values was normalized to 1 in saturating red light illumination and to 0 after illumination with far-red light. The dimeric wild-type fragments and the monomerizing mutants are shown as solid and dotted lines, respectively. The PAS-GAFmon reverts more slowly to the Pr state than its wild-type counterpart. For PAS-GAF-PHYmon and FLmon dark reversion is absent. B, table of dark reversion time constants (τn). Satisfactory fits were obtained by using a sum of two decay components. The obtained values for dimers closely resembled the previously reported ones (28). An, decay amplitude; RMSE, root mean square error. C, distance between mutated residues and the chromophore. The distance between the biliverdin chromophore (orange) and the mutated residues (red) is indicated. The crystal structure of PAS-GAFmon (PDB code 4IJG; Ref. 64) was used for the figure.
FIGURE 4.
FIGURE 4.
SAXS of the phytochrome constructs. A, scattering of the phytochrome fragments (S) as a function of scattering angle (q) is plotted on a logarithmic scale. Dark (Pr) state samples are plotted as black lines; illuminated (mostly Pfr) state samples are plotted in gray lines. The scattering data of PAS-GAF-PHY is from Takala et al. (11). B, structural parameters calculated from the SAXS scattering. Rg, radius of gyration; Dmax, maximum particle dimension; VPorod, Porod volume; I0, forward scattering. The molecular weights (MWexp) were estimated from the I0 of BSA using the formula MWexp ≈ MW(BSA) × [I0(sample)/I0(BSA)], where MW(BSA) = 66 kDa. Theoretical molecular weights (MWcalc) were calculated from the protein sequence (58).
FIGURE 5.
FIGURE 5.
Free energy calculations of the separation of the PAS-GAF and DHp fragments. A, the domain models used for the molecular dynamics simulations, based on crystal structures of D. radiodurans PAS-GAF fragment (PDB entry 4Q0J; Ref. 12) and a DHp fragment from Thermotoga maritima histidine kinase domain (PDB entry 2C2A; Ref. 24). Each monomer is shown in green or red, the approximate direction of the pulling is shown as arrows. The three residues of the PAS-GAF fragment that are mutated in PAS-GAFmon as well as the interacting hydrophobic residues between the DHp helices are presented as sticks. B, the PMF is plotted as a function of the center of mass separation. The separation energies of the PAS-GAF fragment are shown in green and DHp fragment in blue. The thin lines show 50 independent curves from bootstrap analysis. The total binding energies of the both interfaces are approximately similar, although the shapes of the plotted curves differ from each other.
FIGURE 6.
FIGURE 6.
Model scheme of phytochrome dimerization and dark reversion energetics. A, after red light illumination the refolding of the PHY tongue region causes PHY domains to separate and the dimer to open (11, 12). The opening motion along with the two dimerization interfaces creates strain in the protein. This strain is increased by structural changes upon red light illumination, thus facilitating dark reversion. Note that the alternative Pfr form with separated HK domains is denoted as Pfr′, in accordance with Burgie et al. (12). B, hypothetical free energy schemes of dark reversion. Scheme 1, the Pfr state energy of the monomer (mon) and the dimer (dim) differ; Scheme 2, the energies of the transition state for back reversion differ.

References

    1. Quail P. H. (2002) Phytochrome photosensory signalling networks. Nat. Rev. Mol. Cell Biol. 3, 85–93 - PubMed
    1. Rockwell N. C., Su Y. S., Lagarias J. C. (2006) Phytochrome structure and signaling mechanisms. Annu. Rev. Plant Biol. 57, 837–858 - PMC - PubMed
    1. Karniol B., Vierstra R. D. (2003) The pair of bacteriophytochromes from Agrobacterium tumefaciens are histidine kinases with opposing photobiological properties. Proc. Natl. Acad. Sci. U.S.A. 100, 2807–2812 - PMC - PubMed
    1. Krieger A., Molina I., Oberpichler I., Michael N., Lamparter T. (2008) Spectral properties of phytochrome Agp2 from Agrobacterium tumefaciens are specifically modified by a compound of the cell extract. J. Photochem. Photobiol. B. 93, 16–22 - PubMed
    1. Zienicke B., Molina I., Glenz R., Singer P., Ehmer D., Escobar F. V., Hildebrandt P., Diller R., Lamparter T. (2013) Unusual spectral properties of bacteriophytochrome Agp2 result from a deprotonation of the chromophore in the red-absorbing form Pr. J. Biol. Chem. 288, 31738–31751 - PMC - PubMed

Publication types

MeSH terms

LinkOut - more resources