. 2015 Jun 26;290(26):16281-91.
doi: 10.1074/jbc.M114.617746. Epub 2015 May 13.

Specific Activation of the Plant P-type Plasma Membrane H+-ATPase by Lysophospholipids Depends on the Autoinhibitory N- and C-terminal Domains

Affiliations

Specific Activation of the Plant P-type Plasma Membrane H+-ATPase by Lysophospholipids Depends on the Autoinhibitory N- and C-terminal Domains

Alex Green Wielandt et al. J Biol Chem. .

Abstract

Eukaryotic P-type plasma membrane H(+)-ATPases are primary active transport systems that are regulated at the post-translation level by cis-acting autoinhibitory domains, which can be relieved by protein kinase-mediated phosphorylation or binding of specific lipid species. Here we show that lysophospholipids specifically activate a plant plasma membrane H(+)-ATPase (Arabidopsis thaliana AHA2) by a mechanism that involves both cytoplasmic terminal domains of AHA2, whereas they have no effect on the fungal counterpart (Saccharomyces cerevisiae Pma1p). The activation was dependent on the glycerol backbone of the lysophospholipid and increased with acyl chain length, whereas the headgroup had little effect on activation. Activation of the plant pump by lysophospholipids did not involve the penultimate residue, Thr-947, which is known to be phosphorylated as part of a binding site for activating 14-3-3 protein, but was critically dependent on a single autoinhibitory residue (Leu-919) upstream of the C-terminal cytoplasmic domain in AHA2. A corresponding residue is absent in the fungal counterpart. These data indicate that plant plasma membrane H(+)-ATPases evolved as specific receptors for lysophospholipids and support the hypothesis that lysophospholipids are important plant signaling molecules.

Keywords: H+-ATPase; lysophospholipid; plasma membrane; post-transcriptional regulation; proton pump.


Figures

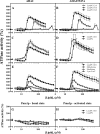
FIGURE 1.
FIGURE 1.
Activation of the PM H+-ATPase by DDM and lyso-PC 16:0 depends on the presence of intact terminal domains. The ATPase activities of membranes isolated from cells expressing either WT AHA2 (●); a variant with an N-terminal truncation (aha2ΔN10; gray circles); a variant with a C-terminal truncation encompassing the entire regulatory domain (aha2Δ92; ○); or variants with three, 25, or 30 amino acids removed from the C terminus (aha2Δ3/25/30; ▴, gray triangles, and ▵, respectively) were analyzed with increasing concentrations of DDM (A and B) or lyso-PC (C, D, E, and F) ±1.5% DDM. Concentrations of DDM refer to concentrations in the preincubation mixture with a membrane protein concentration of 5 mg/ml. The mixture was diluted to 0.4 mg/ml protein and mixed 1:1 with 1 mg/ml dioleoylphosphatidylcholine before assaying the ATPase activity at 30 °C with 3 mm ATP. LysoPC refers to the concentration directly in the assay. An activity of 100% corresponds to the specific activity at 3 mm ATP without lyso-PC (see Table 2 for quantification) (n = 3–5 biological replicates; ±S.E. (error bars)).
FIGURE 2.
FIGURE 2.
Lysophospholipid activation of PM H+-ATPase. The ability of lysophospholipids and their analogues to activate the ATP hydrolytic activity of the wild-type plant PM H+-ATPase AHA2 (A, C, and E), a T947A mutant (B, D, and F), and the yeast plasma membrane PM H+-ATPase Pma1p (G and H) was tested at 3 mm ATP. For wild-type AHA2 and the T947A mutant, 0.3 μg of microsomal membrane protein was used per sample, and for Pma1p, 0.15 μg of protein from purified yeast plasma membranes expressing Pma1p as the only H+-ATPase was used. An activity of 100% corresponds to the specific activity at 3 mm ATP without lipid. For quantification of AHA2 and T947A kinetic parameters, see Table 2. Specific activity at 3 mm ATP for Pma1p in the basal state was 2.3 ± 0.05 μmol of Pi/mg/min and in the activated state was 9.6 ± 0.23 μmol of Pi/mg/min. A and B, test of the effect of acyl chain length of lyso-PC on wild-type AHA2 and T947A (lyso-PC 12:0, ○; lyso-PC 14:0, gray circles; lyso-PC 16:0, ●). C and D, test of the lysophospholipid headgroup on the wild type and T947A (lyso-PC 16:0, ●; lyso-PG 16:0, gray circles). E and F, test of the glycerol backbone on the wild type and T947A (lyso-PC 16:0, ●; miltefosine 16:0, gray circles; edelfosine 18:0, ○; 1-hexadecyl-2-hydroxy-sn-glycero-3-phosphocholine (Lyso FosC) 16:0, ◐). G and H, test of the lysophospholipid headgroup on Pma1p (lyso-PC 16:0, ●; lyso-PG 16:0, gray circles) (n = 2–3 biological replicates; ±S.E. (error bars)).
FIGURE 3.
FIGURE 3.
N- and C-terminal deletions activate the plant PM H+-ATPase in a yeast growth assay. A yeast strain with the native PM H+-ATPase placed under a galactose-inducible promoter was transformed with plasmids bearing wild-type or mutant plant PM H+-ATPases under the native promoter. Growth was assayed on minimal medium plates with either glucose or galactose at the given pH values and recorded after 3 days. Droplets contained initially around 103 cells.
FIGURE 4.
FIGURE 4.
Point mutations of Leu-919 activate the plant PM H+-ATPase in a yeast growth assay and in vitro. A, AHA2 C-terminal single, double, or triple mutants from purified microsomes were assayed with increasing concentrations of lyso-PC 16:0. WT (●), L919A (○), L919A,L922A (gray circles), L919A,T947A (◐), and L919A,L922A,T947A (■). A total of 0.3 μg of microsomes was used per sample, and 100% activity corresponds to the specific activity at 3 mm ATP without lyso-PC (see Table 2 for quantification) (n = 3 biological replicates; ± S.E. (error bars)). B, a yeast strain with the native H+-ATPase placed under a galactose-inducible promoter was transformed with plasmids bearing wild-type plant H+-ATPases or the L919A mutant under the yeast pma1 promoter. Growth was assayed on minimal medium plates with either glucose or galactose at the given pH values and recorded after 3 days.
FIGURE 5.
FIGURE 5.
Working model for lyso-PC activation of the plant PM H+-ATPase. A, alignment of fungal S. cerevisiae Pma1p with Arabidopsis AHA2 and tobacco PMA2 C-terminal regions with the structure of PMA2 indicated below (predicted in the case of Region I). Autoinhibitory Regions I and II are indicated by blue boxes. AHA2 residues Leu-919 and Leu-922, which play opposing roles in autoinhibition, and the phosphorylation site Thr-947 are indicated. Asterisks below sequence indicate full conservation in plants; asterisks above sequence indicate full conservation across species; colons indicate conservation between groups of strongly similar properties; periods indicate conservation between groups of weakly similar properties. B, known structural elements involved in the regulation of the plant PM H+-ATPase. A, actuator domain; N, nucleotide-binding domain; P, phosphorylation domain. Left, the structure of lyso-PC 16:0 is inserted for size comparison with the PM H+-ATPase. How lyso-PC interacts with the core PM H+-ATPase and/or terminal domains is not known. Middle, a ribbon model of the crystal structure of a truncated AHA2 PM H+-ATPase (residues 12–844) (Protein Data Bank code 3B8C) is shown. The terminal modeled residues are highlighted, and the cytosolic domains are noted. In the crystal structure, AMPPCP is present as a non-hydrolyzable ATP analogue. Right, attached with a dotted line to the core structure is a homology model of the 50 C-terminal residues of AHA2 based on the crystal structure of the corresponding region of PMA2 in complex with 14-3-3 protein (Protein Data Bank code 2O98). How the C-terminal domain interacts with the core protein is not known. C, space-filling structure of the homology model of the 50 C-terminal residues of AHA2 shown in B with key amino acid residues indicated. The position of truncations corresponding to Δ25 and Δ30 are shown. Leu-919 and Leu-922 are seen on the same face of the α-helix constituting Region II (in cyan). Electrostatic potential as determined by PyMOL is shown as a surface: white, no charge; blue, positive charge; red, negative charge. Region II has a hydrophobic patch (left side of the helix). The α-helix in yellow is part of the 14-3-3-binding site and has a partially hydrophobic surface (top), which in the basal non-activated state might be docked in a hydrophobic environment, such as the membrane, to protect Thr-947 from phosphorylation.

Similar articles

Cited by

References

    1. Palmgren M. G. (2001) Plant plasma membrane H+-ATPases: powerhouses for nutrient uptake. Annu. Rev. Plant Physiol. Plant Mol. Biol. 52, 817–845 - PubMed
    1. Axelsen K. B., Palmgren M. G. (1998) Evolution of substrate specificities in the P-type ATPase superfamily. J. Mol. Evol. 46, 84–101 - PubMed
    1. Palmgren M. G., Nissen P. (2011) P-type ATPases. Annu. Rev. Biophys. 40, 243–266 - PubMed
    1. Traaseth N. J., Shi L., Verardi R., Mullen D. G., Barany G., Veglia G. (2009) Structure and topology of monomeric phospholamban in lipid membranes determined by a hybrid solution and solid-state NMR approach. Proc. Natl. Acad. Sci. U.S.A. 106, 10165–10170 - PMC - PubMed
    1. Sahoo S. K., Shaikh S. A., Sopariwala D. H., Bal N. C., Periasamy M. (2013) Sarcolipin protein interaction with sarco(endo)plasmic reticulum Ca2+ ATPase (SERCA) is distinct from phospholamban protein, and only sarcolipin can promote uncoupling of the SERCA pump. J. Biol. Chem. 288, 6881–6889 - PMC - PubMed

Publication types

MeSH terms

Substances