. 2015 May 13;7(287):287ra74.
doi: 10.1126/scitranslmed.aaa8038.

Functional inflammatory profiles distinguish myelin-reactive T cells from patients with multiple sclerosis

Affiliations

Functional inflammatory profiles distinguish myelin-reactive T cells from patients with multiple sclerosis

Yonghao Cao et al. Sci Transl Med. .

Abstract

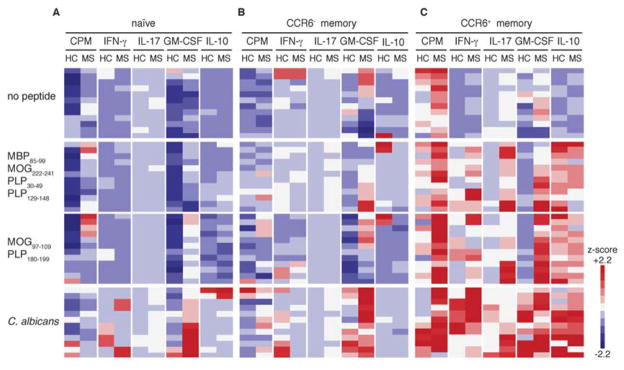
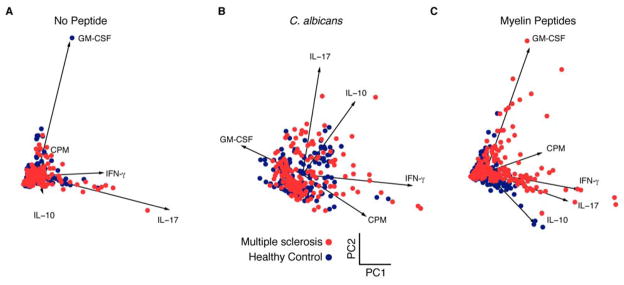
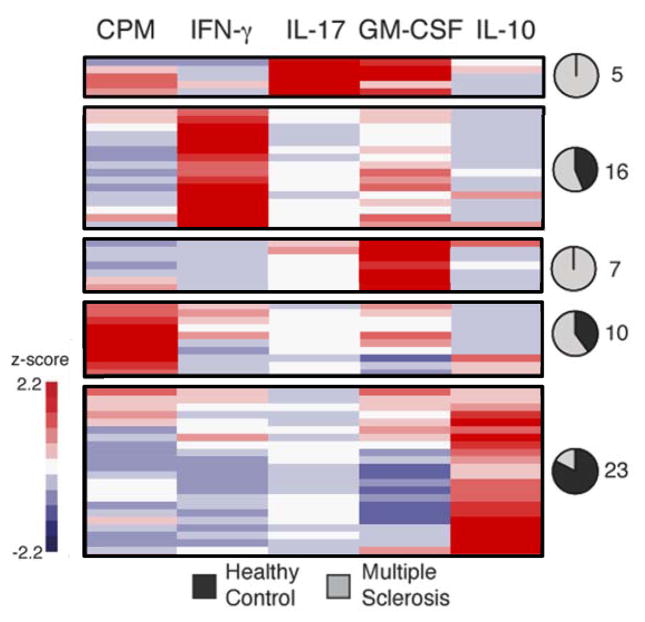
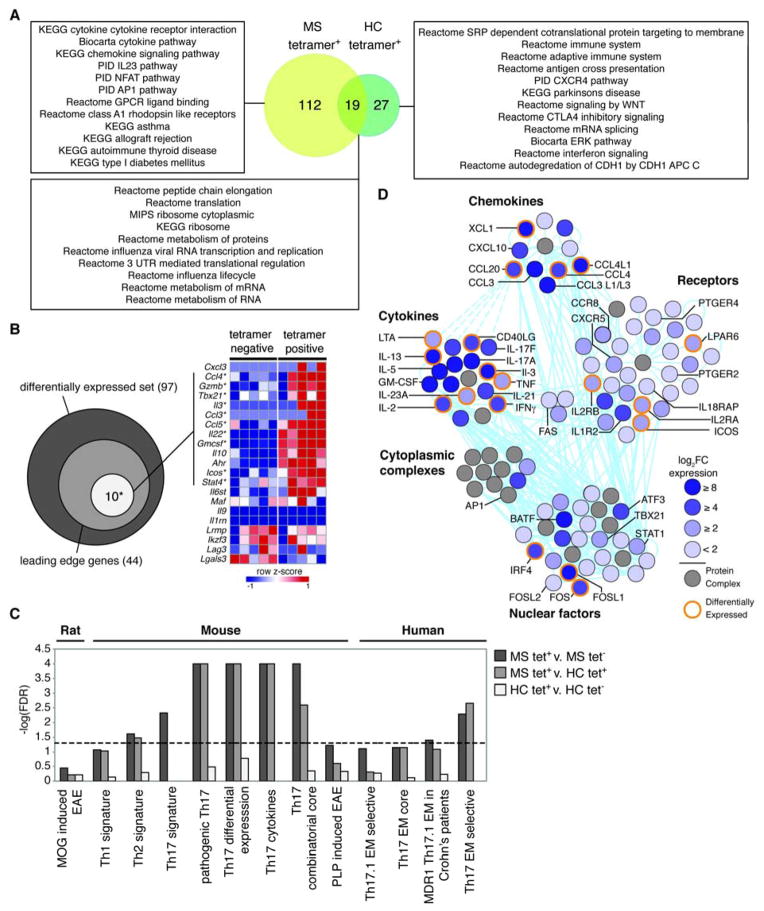
Myelin-reactive T cells have been identified in patients with multiple sclerosis (MS) and healthy subjects with comparable frequencies, but the contribution of these autoreactive T cells to disease pathology remains unknown. A total of 13,324 T cell libraries generated from blood of 23 patients and 22 healthy controls were interrogated for reactivity to myelin antigens. Libraries derived from CCR6(+) myelin-reactive T cells from patients with MS exhibited significantly enhanced production of interferon-γ (IFN-γ), interleukin-17 (IL-17), and granulocyte-macrophage colony-stimulating factor (GM-CSF) compared to healthy controls. Single-cell clones isolated by major histocompatibility complex/peptide tetramers from CCR6(+) T cell libraries also secreted more proinflammatory cytokines, whereas clones isolated from controls secreted more IL-10. The transcriptomes of myelin-specific CCR6(+) T cells from patients with MS were distinct from those derived from healthy controls and, notably, were enriched in T helper cell 17 (TH17)-induced experimental autoimmune encephalitis gene signatures, and gene signatures derived from TH17 cells isolated other human autoimmune diseases. These data, although not causal, imply that functional differences between antigen-specific T cells from MS and healthy controls are fundamental to disease development and support the notion that IL-10 production from myelin-reactive T cells may act to limit disease progression or even pathogenesis.


Conflict of interest statement

Competing Interests: The authors declare no competing financial interests.

Figures

Fig. 1
Fig. 1. Phenotypic analysis of oligoclonal libraries of myelin-reactive CD4+ T cells from a patient with MS and a healthy control subject
Heatmap comparing functional responses of (A) Naïve, (B), CCR6 memory, and (C) CCR6+ memory CD4+ T cells cultured with irradiated autologous monocytes with or without myelin peptides (MBP85-99, MOG222-241, PLP30-49 and PLP129), or (MOG97-109 and PLP180-199) or C. albicans. Proliferation was measured by 3H-thymidine incorporation on day 5, and culture supernatants were measured on day 7 by ELISA for IFN-γ, IL-17, GM-CSF and IL-10. Data show one representative experiment (out of 13) and were z-score normalized for each parameter. Each bar per column represents one oligoclonal library.
Fig. 2
Fig. 2. Principal component analysis of functional phenotypes of myelin-reactive CCR6+ memory CD4+ T cells
Scatterplots show measured penta-dimensional responses (proliferation, IFN-γ, IL-17, GM-CSF and IL-10) for individual amplified T cell libraries (each dot) projected onto the first two principal components. Analysis is shown for (A) no peptide, (B) C. albicans, and (C) myelin peptides from thirteen healthy subjects and thirteen MS patients. Projections of the vectors for each data class are also shown and annotated for reference. Statistically significant p-values of myelin-reactive T cells for IL-17 (p < 0.0001), GM-CSF (p = 0.0114), IFN-γ (p < 0.0001), IL-10 (p = 0.0005) and proliferation (p < 0.0001).
Fig. 3
Fig. 3. Single-cell clonal analysis of myelin-reactive CCR6+ memory CD4+ T cells in HLA-DR4+ patients with MS and healthy control subjects
Tetramer-sorted single cell clones (n = 144) were stimulated with DR4 myelin peptides (MOG97-109 and PLP180-199) to verify the specificity. Heatmap shows functional profiles of individual clones measured on day 5 after stimulation. Data were z-score normalized within a given parameter, and organized by hierarchical clustering. Clusters that separated in the dendrogram by a distance metric of 3 are shown in each box, and pie charts indicate proportion of clones within a given cluster derived from healthy (black) or MS (grey) subjects. The numbers next the pie charts refer to the clones classified into each proportion. Clones that did not respond after re-stimulation (42 healthy control and 41 MS clones) are not shown here, but did cluster together.
Fig. 4
Fig. 4. Gene expression analysis of myelin-reactive CCR6+ memory T cells in HLA-DR4+ patients with MS and healthy subjects
CCR6+ memory CD4+ T cells from healthy subjects (n= 3) and MS patients (n = 5) were amplified by PHA and IL-2, scored for proliferation upon restimulation, and sorted as myelin tetramer+ and tetramer cells for RNA sequencing. (A) Gene sets enriched in the MS tetramer+ samples (yellow), healthy control (HC) tetramer+ samples (green), or both as determined by GSEA (FDR < 0.05). Representative gene sets from each category are shown. (B) Venn diagram summarizes the overlap of genes with the core pathologic EAE set (white), and the total genes in the leading edge (light grey), within the differentially expressed gene set reported by Lee et al (dark grey) (16). The heatmap (right) shows the z-score normalized log2FPKM values for the indicated genes in MS tetramer+ or tetramer samples. Genes that are bold with asterisk are contained within the leading edge gene set. (C) −log(FDR) values of GSEA results for gene sets indicated. FDR values that were reported as zero were set to 4 for display purposes (pathogenic Th17, Th17 differential expression, Th17 cytokines, and Th17 combinatorial core). Dashed line shows FDR > 0.05. (D) A network representation of molecules enriched in MS tetramer+ samples. The color of each molecule shows fold change of MS tetramer+ relative to MS tetramer as indicated by the key. Solid (direct) or dashed (indirect) cyan lines denote known molecular interactions. Select molecules are labeled and molecules highlighted in orange were differentially expressed.

References

    1. McFarland HF, Martin R. Multiple sclerosis: a complicated picture of autoimmunity. Nat Immunol. 2007;8:913–919. - PubMed
    1. Goverman J. Autoimmune T cell responses in the central nervous system. Nat Rev Immunol. 2009;9:393–407. - PMC - PubMed
    1. Nylander A, Hafler DA. Multiple sclerosis. J Clin Invest. 2012;122:1180–1188. - PMC - PubMed
    1. International Multiple Sclerosis Genetics Consortium. Risk alleles for multiple sclerosis identified by a genomewide study. N Engl J Med. 2007;357:851–862. - PubMed
    1. International Multiple Sclerosis Genetics Consortium, Wellcome Trust Case Control Consortium. Genetic risk and a primary role for cell-mediated immune mechanisms in multiple sclerosis. Nature. 2011;476:214–219. - PMC - PubMed

Publication types