Case Reports
. 2015 Jul 9;126(2):257-61.
doi: 10.1182/blood-2014-07-584664. Epub 2015 May 13.

Inducing iron deficiency improves erythropoiesis and photosensitivity in congenital erythropoietic porphyria

Affiliations
Case Reports

Inducing iron deficiency improves erythropoiesis and photosensitivity in congenital erythropoietic porphyria

Daniel N Egan et al. Blood. .

Abstract

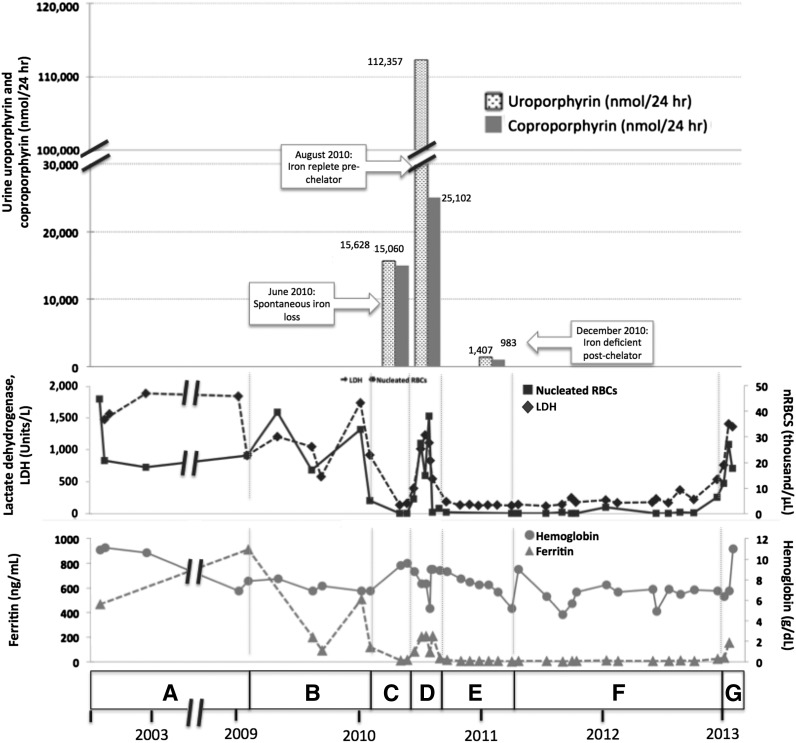
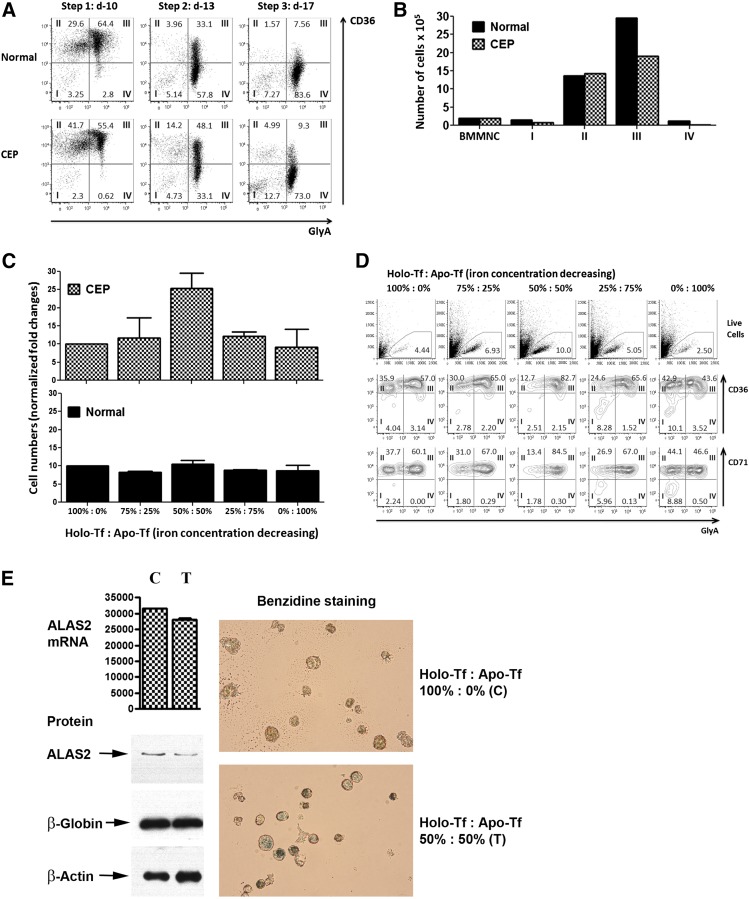
Congenital erythropoietic porphyria (CEP) is an autosomal recessive disorder of heme synthesis characterized by reduced activity of uroporphyrinogen III synthase and the accumulation of nonphysiologic isomer I porphyrin metabolites, resulting in ineffective erythropoiesis and devastating skin photosensitivity. Management of the disease primarily consists of supportive measures. Increased activity of 5-aminolevulinate synthase 2 (ALAS2) has been shown to adversely modify the disease phenotype. Herein, we present a patient with CEP who demonstrated a remarkable improvement in disease manifestations in the setting of iron deficiency. Hypothesizing that iron restriction improved her symptoms by decreasing ALAS2 activity and subsequent porphyrin production, we treated the patient with off-label use of deferasirox to maintain iron deficiency, with successful results. We confirmed the physiology of her response with marrow culture studies.


Figures

Figure 1
Figure 1
Correlation of clinical and laboratory findings in patient 1. (A) A female of Alaskan Native descent (patient 1) was diagnosed with CEP at 12 months of age after presenting with red urine, discolored teeth, and blisters. A younger sister (patient 2) would also later be diagnosed with CEP. Genetic testing revealed compound heterozygosity for previously described C73R and A104V mutations in UROS. Since childhood, disease complications included chronic hemolysis and severe photosensitivity with scarring, which were managed with sun avoidance and supportive measures including blood transfusions. Patient 1 underwent laparoscopic splenectomy in February 2002 at the age of 25 years. Baseline laboratory parameters include an LDH that ranged from 906 to 1885 U/L (reference range, 80-190 U/L), nucleated red blood cells (nRBCs) between 17.1 and 44.9 × 10³ cells/μL (reference, 0.0 × 10³ cells/μL), and a reticulocyte count of 195 billion cells/L (reference, 20-65 billion cells/L), reflecting chronic hemolysis. The hemoglobin level ranged from 6.9 to 10.9 g/dL (reference range, 11.5-15.5 g/dL), and the patient’s ferritin level was 470 ng/mL in 2002 (reference range, 10-180 ng/mL). Laboratory values are provided in detail in supplemental Table 1. (B) In February 2009, the ferritin level increased to 910 ng/mL as a result of blood transfusions. Deferasirox was administered to treat iron overload and was discontinued after ferritin level decreased to 93 ng/mL in September 2009. The ferritin level increased again to 508 ng/mL by January 2010. (C) In May 2010, a spontaneous reduction in serum ferritin level to 13 ng/mL was noted and was attributed to occult gastrointestinal (GI) bleeding. Concurrently, the patient reported a dramatic improvement in photosensitivity and a normalization in urine color. Markers of hemolysis also improved, as shown, with a reduction in LDH level to 138 U/L and a marked reduction in circulating nRBCs to 0.2 × 10³ cells/μL. Hemoglobin level increased from 6.9 to 9.4. Reticulocyte count decreased to 55 billion cells/L (data not shown). Quantitative analysis of urine porphyrins demonstrated uroporphyrin at 15 628 nmol/24 hours and coproporphyrin at 15 060 nmol/24 hours. Prior values are not available for comparison, and full data regarding the porphyrin fractions are available in supplemental Table 2. (D) Resolution of GI bleeding was accompanied by a rise in serum ferritin level to 208 ng/mL and a concordant worsening of photosensitivity and darkening of urine color. Similarly, LDH level increased to 540 U/L, reticulocyte count increased markedly to 163 billion cells/L, and nRBCs increased to 4.3 × 10³ cells/μL. Repeat quantitative analysis of urine porphyrins at this time demonstrated a significant increase in both uroporphyrin (112 357 nmol/24 hours) and coproporphyrin (25 102 nmol/24 hours). (E) In August 2010, based on the correlation between iron status, laboratory parameters, and photosensitivity, we initiated a trial of deferasirox to induce and maintain an iron-deficient state. Deferasirox was initially dosed at 500 mg daily and then in November 2010 was adjusted to 500 mg 3 times weekly to target a ferritin level range of 10 to 15 ng/mL. With deferasirox, the serum ferritin level dropped to 16 ng/mL over 2 months, and the patient again reported an improvement in her quality of life with reduced photosensitivity. As further evidence of the efficacy of deferasirox, an impressive reduction in uroporphyrin to 1470 nmol/24 hours and coproporphyrin to 983 nmol/24 hours was seen on repeat quantitative analysis of urine porphyrins 4 months after chelation began. In addition, total (unfractionated) urine porphyrins decreased from 108 364 μg/24 hours in June 2010 to 5896.3 μg/24 hours in December 2010. Concurrently, LDH normalized to a level of 135 U/L, reticulocyte count decreased to 47 billion/L, nRBCs remained between 0.14 and 0.68 × 10³ cells/μL, and hemoglobin level remained between 6.8 and 9.0 g/dL without transfusional support. (F) In April 2011, patient 1 developed recurrent upper GI bleeding, deferasirox was discontinued, and red blood cell transfusions were administered. Over the ensuing 2 years, numerous repeat endoscopies showed persistent gastric erosions and ulcerations despite ongoing use of a proton pump inhibitor. As a result of the ongoing iron losses, ferritin level remained <15 ng/mL, and there was continued control of CEP symptoms and stabilization of laboratory markers of hemolysis. (G) In January 2013, the patient’s serum ferritin increased abruptly, consistent with resolution of GI bleeding. Her photosensitivity suddenly worsened, accompanied by a rise in LDH level to 1403 U/L, nRBCs to 6.4 × 10³ cells/μL, and reticulocytes to 118 billion cells/L. Although not known to be a complication of CEP, the patient developed liver disease. Workup, including liver biopsy, failed to discern its etiology. This contributed to a delay in restarting deferasirox when her iron levels began to increase again. In early 2013, at age 35, the patient died of complications of liver failure, hepatorenal syndrome, and hemolysis after enjoying nearly 3 years of reduced symptom severity and a considerable improvement in her quality of life. Microscopic examination of the liver at the time of autopsy demonstrated areas of marked sinusoidal congestion and dilatation containing aggregates of erythroid precursors consistent with diffuse intrasinusoidal extramedullary hematopoiesis. Extensive patchy fibrosis was present, without regenerative nodules or cirrhosis. Importantly, there was no evidence of polarizable material to suggest porphyrin metabolite accumulation. Sadly, the patient’s sister (patient 2) also died, in 2011, from sudden cardiac death in the setting of pulmonary hypertension. A similar trial of chelation was not initiated in her case because she was unable to obtain insurance coverage for the off-label use of deferasirox. Patient 2’s clinical course is further described in supplemental Appendix 1.
Figure 2
Figure 2
Erythroid cell growth and maturation of CEP and normal bone marrow. (A) Flow cytometric profiles of control and CEP marrow cells cultured in standard iron-replete conditions (100% holo-Tf [holo-transferrin]; 8.54-9.52 μM iron). Although the erythroid cells from CEP patient 2 fully matured from stages I to IV (defined by the sequential gain of CD36 and then GlyA expression and the subsequent loss of CD36 expression), there were lower percentages of erythroid cells in stage III on day 10 (55.4% vs 64.4% in control cultures) and in stage IV on days 13 and 17 (33.1% and 73.0% vs 57.8% and 83.6%, respectively). Similar results were also seen in the studies of marrow cells from CEP patient 1 (supplemental Figure 1A). (B) Absolute numbers of erythroid cells in cultures containing 100% holo-Tf. Cultures of marrow cells from CEP patient 2 at day 10 have fewer cells than control cultures. This is mainly due to the decreased numbers of erythroid cells in stage III (19.0 × 10⁵ vs 29.6 × 10⁵), suggesting that CEP erythroid cells die when transiting to or in stage III. All cultures were initiated (day 0) with 2.0 × 10⁶ bone marrow mononuclear cells. Similar results were also seen in marrow culture studies of CEP patient 1 (supplemental Figure 1B). (C) Total number of CEP erythroid cells on culture day 10 in media containing different ratios of holo-Tf to apo-Tf, as stated in Study design. The number of erythroid cells in cultures containing 100% holo-Tf was arbitrarily designated as 10 so that data from CEP patients 1 and 2 could be combined and both increases and decreases reported. Maximal erythroid growth occurred with 50% holo-Tf /50% apo-Tf. In this condition of partial iron restriction, there was a 2.5 ± 0.4-fold increase in the numbers of erythroid cells vs 0.9 ± 0.5- to 1.2 ± 0.1-fold changes in the other conditions. In contrast, the numbers of normal erythroid cells on culture day 10 did not change significantly when iron delivery is restricted. (D) Iron restriction also improves the erythroid maturation of CEP marrow cells. On culture day 10, a greater proportion of CEP patient 2’s cells were GlyA+ (stages III and IV) in the cultures containing 50% holo-Tf /50% apo-Tf compared with the other iron conditions (84.9% vs 47.1-67.2%). Comparable results were seen on culture days 13 and 17 (data not shown). Marrow culture studies of CEP patient 1 yielded similar data (supplemental Figure 1C). In contrast, the numbers of normal erythroid cells on culture day 10 progressively decreased when iron delivery was restricted (supplemental Figure 1D). (E) Expression of ALAS2 mRNA and protein in CEP cells during erythroid differentiation. With iron restriction (50% holo-Tf/ 50% apo-Tf; lane T), there is a slight reduction in ALAS2 mRNA (as normalized to β-actin) on culture day 10 (28.1 × 10³ vs 31.6 × 10³ in 100% holo-Tf; lane C; P = .21). More importantly, iron restriction dramatically reduces the amount of ALAS2 protein, confirming its primary effect on the translation of ALAS2 RNA to protein. On culture day 10, the intensity of ALAS2 (normalized to β-actin) in 50% holo-Tf/50% apo-Tf (lane T) is 43.1% of the intensity of ALAS2 in 100% holo-Tf (lane C). Globin protein is similar under both iron conditions. Also, CEP cells cultured in 50% holo-Tf/50% apo-Tf fully hemoglobinize as shown here by benzidine stains and in supplemental Figure 1E by Wright-Giemsa stains from culture day 13. These studies only used marrow from patient 2, as insufficient cells were available from patient 1.

Comment in

  • Iron and erythropoietic porphyrias.
    Minder EI, Barman-Aksözen J. Minder EI, et al. Blood. 2015 Jul 9;126(2):130-2. doi: 10.1182/blood-2015-05-646737. Blood. 2015. PMID: 26160187 No abstract available.

References

    1. Layer G, Reichelt J, Jahn D, Heinz DW. Structure and function of enzymes in heme biosynthesis. Protein Sci. 2010;19(6):1137–1161. - PMC - PubMed
    1. Thomas C, Ged C, Nordmann Y, et al. Correction of congenital erythropoietic porphyria by bone marrow transplantation. J Pediatr. 1996;129(3):453–456. - PubMed
    1. Zix-Kieffer I, Langer B, Eyer D, et al. Successful cord blood stem cell transplantation for congenital erythropoietic porphyria (Gunther’s disease). Bone Marrow Transplant. 1996;18(1):217–220. - PubMed
    1. Harada FA, Shwayder TA, Desnick RJ, Lim HW. Treatment of severe congenital erythropoietic porphyria by bone marrow transplantation. J Am Acad Dermatol. 2001;45(2):279–282. - PubMed
    1. Ged C, Moreau-Gaudry F, Richard E, Robert-Richard E, de Verneuil H. Congenital erythropoietic porphyria: mutation update and correlations between genotype and phenotype. Cell Mol Biol (Noisy-le-grand) 2009;55(1):53–60. - PubMed

Publication types

MeSH terms