. 2015 May 13;35(19):7521-37.
doi: 10.1523/JNEUROSCI.4794-14.2015.

Dysregulated RNA-Induced Silencing Complex (RISC) Assembly within CNS Corresponds with Abnormal miRNA Expression during Autoimmune Demyelination

Affiliations

Dysregulated RNA-Induced Silencing Complex (RISC) Assembly within CNS Corresponds with Abnormal miRNA Expression during Autoimmune Demyelination

Przemysław Lewkowicz et al. J Neurosci. .

Abstract

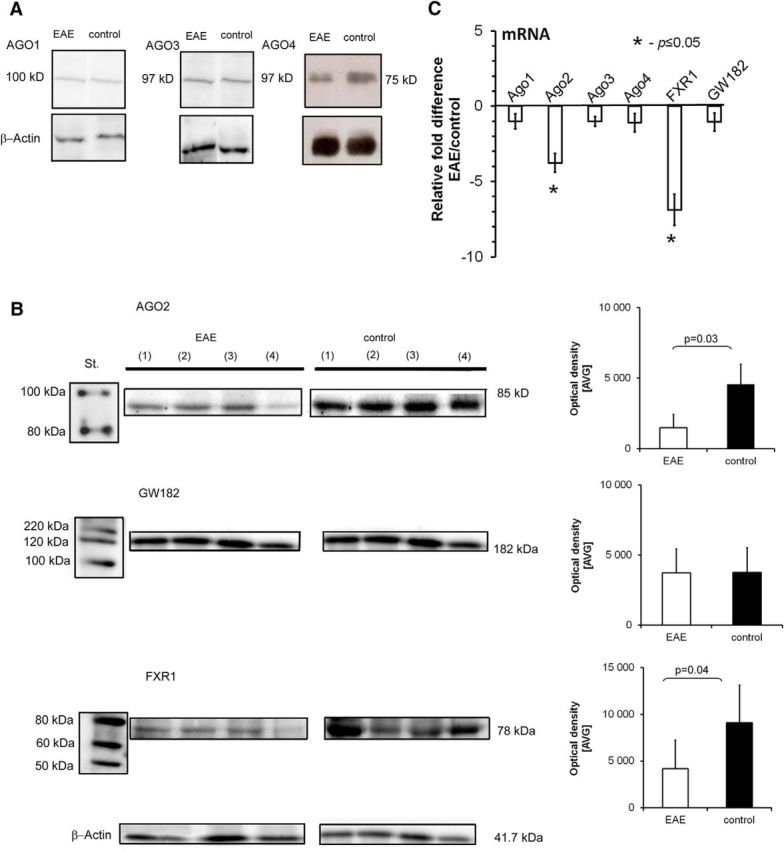
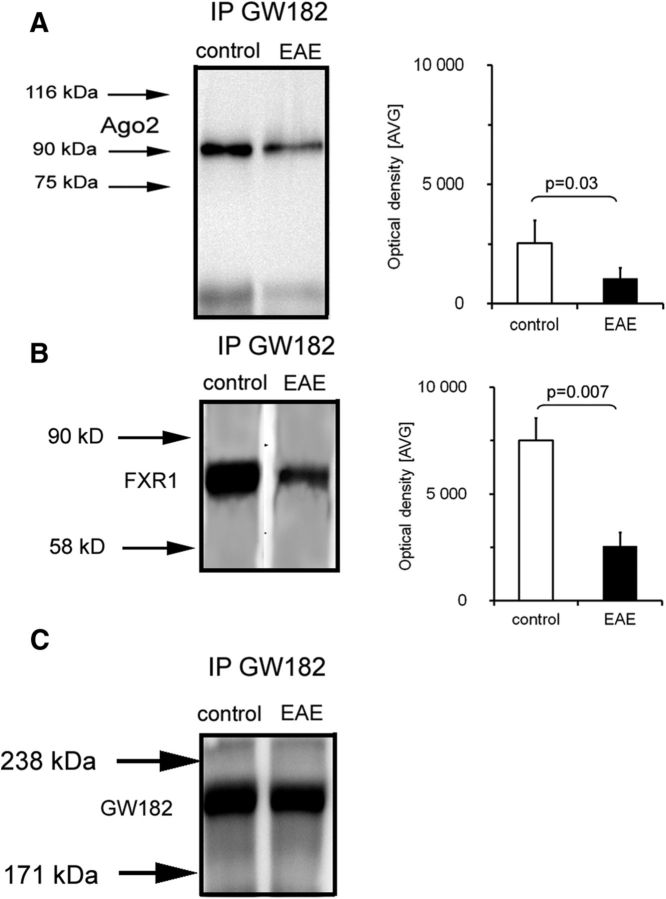
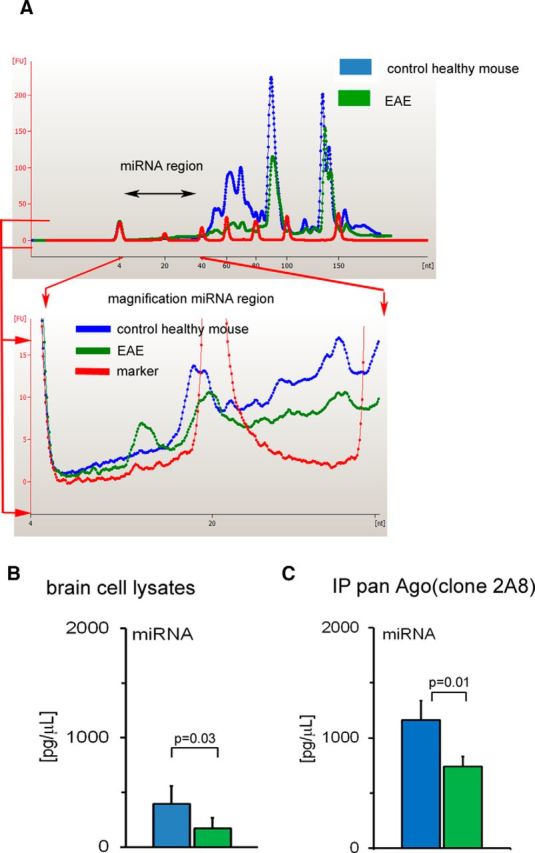
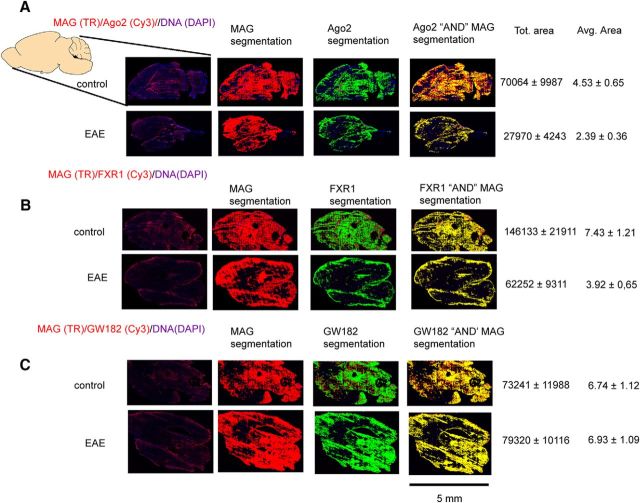
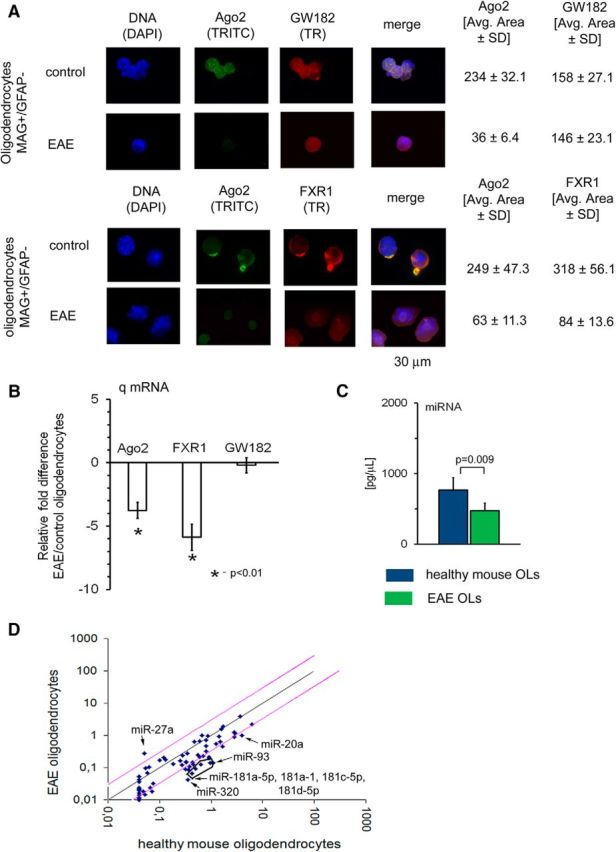
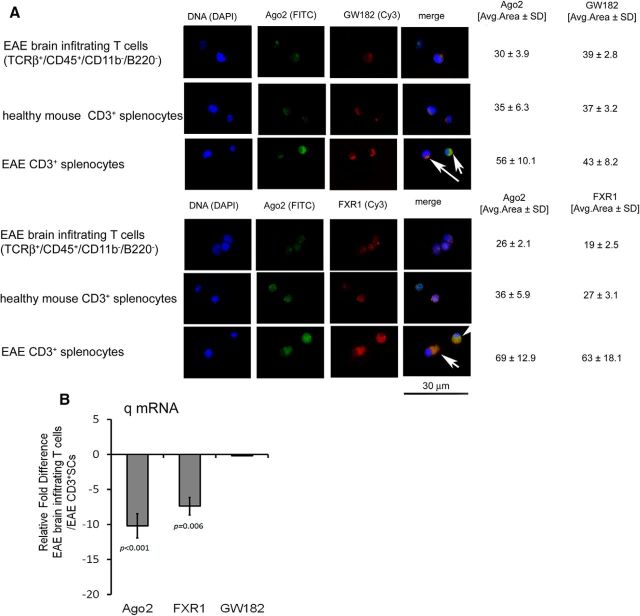
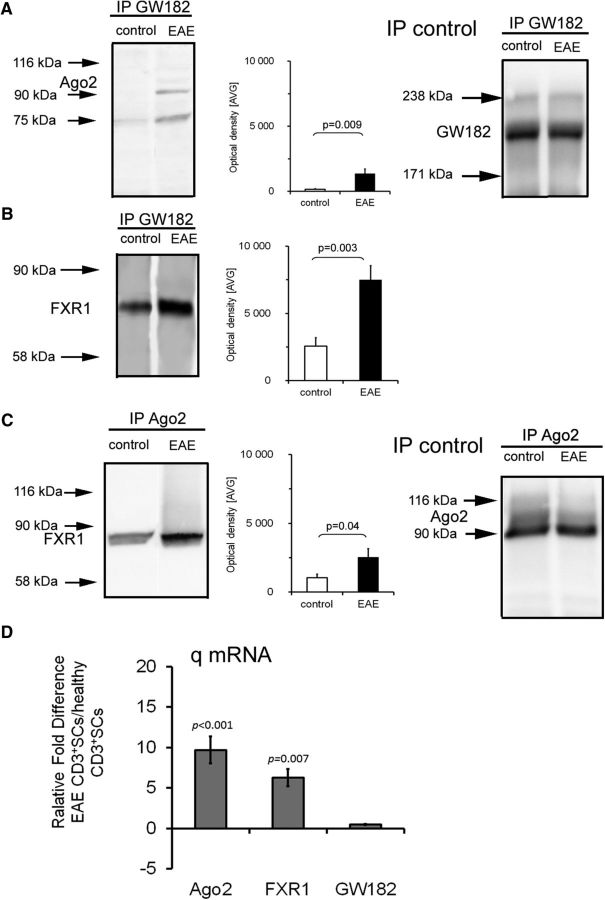
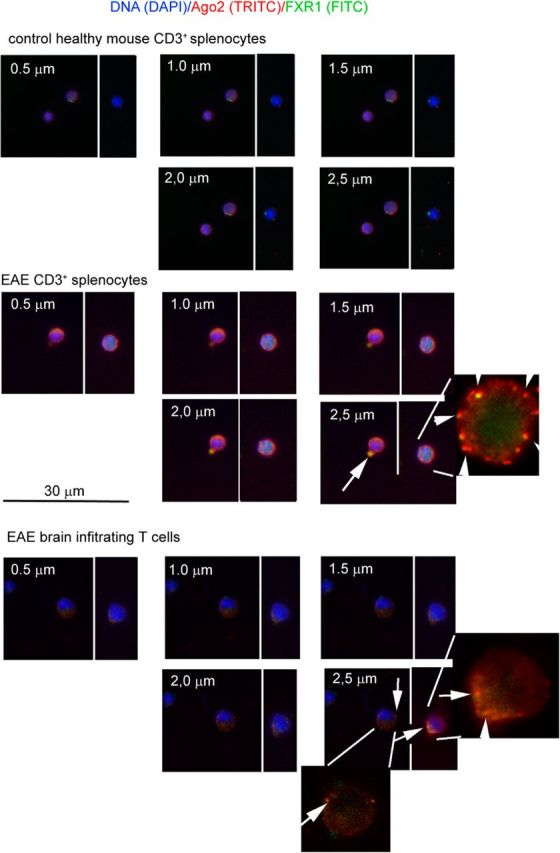
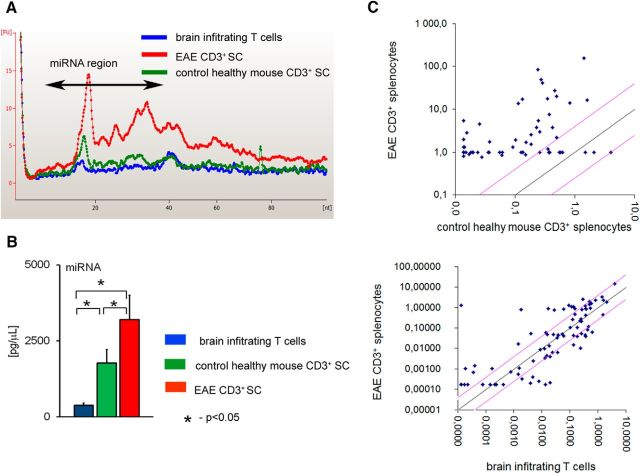
MicroRNAs (miRNAs) associate with Argonaute (Ago), GW182, and FXR1 proteins to form RNA-induced silencing complexes (RISCs). RISCs represent a critical checkpoint in the regulation and bioavailability of miRNAs. Recent studies have revealed dysregulation of miRNAs in multiple sclerosis (MS) and its animal model, experimental autoimmune encephalomyelitis (EAE); however, the function of RISCs in EAE and MS is largely unknown. Here, we examined the expression of Ago, GW182, and FXR1 in CNS tissue, oligodendrocytes (OLs), brain-infiltrating T lymphocytes, and CD3(+)splenocytes (SCs) of EAE mic, and found that global RISC protein levels were significantly dysregulated. Specifically, Ago2 and FXR1 levels were decreased in OLs and brain-infiltrating T cells in EAE mice. Accordingly, assembly of Ago2/GW182/FXR1 complexes in EAE brain tissues was disrupted, as confirmed by immunoprecipitation experiments. In parallel with alterations in RISC complex content in OLs, we found downregulation of miRNAs essential for differentiation and survival of OLs and myelin synthesis. In brain-infiltrating T lymphocytes, aberrant RISC formation contributed to miRNA-dependent proinflammatory helper T-cell polarization. In CD3(+) SCs, we found increased expression of both Ago2 and FXR1 in EAE compared with nonimmunized mice. Therefore, our results demonstrate a gradient in expression of miRNA between primary activated T cells in the periphery and polarized CNS-infiltrating T cells. These results suggest that, in polarized autoreactive effector T cells, miRNA synthesis is inhibited in response to dysregulated RISC assembly, allowing these cells to maintain a highly specific proinflammatory program. Therefore, our findings may provide a mechanism that leads to miRNA dysregulation in EAE/MS.

Keywords: Ago proteins; EAE; RISC; miRNA.


Figures

Figure 1.
Figure 1.
Ago2 and FXR1 downregulation in brain lysates from EAE mice compared with control healthy mice. A, Examples of Western blot analysis for Ago1, Ago3, and Ago4. B, Western blot analysis for Ago2, GW 182, and FXR1 in whole-brain protein lysates. Each value represents data for brain lysates isolated from four EAE and four control mice. Histograms show average optical density ± SD. C, mRNA expression in whole-brain lysates. Data represent the mean of relative mRNA expression (EAE/control) ± SD from four independent experiments (five mice per experiment).
Figure 2.
Figure 2.
Coimmunoprecipitation of Ago2 and FXR1 with GW182 in brain lysates of EAE and control healthy mice. A, Decreased Ago2 coexpression in GW182 complex in the EAE brain compared with control mice. B, Decreased FXR1 coexpression in GW182 complex in the brain in EAE compared with control mice. Ago2 and FXR1 were normalized to GW182. C, Expression of GW182 in control and EAE brain tissue. Histograms depict optical density of the area under each band's peak ± SD taken from four independent experiments (four mice per experiment).
Figure 3.
Figure 3.
Downregulation of miRNAs in EAE whole-brain lysates. A, miRNA-containing region (magnified at bottom) was defined arbitrarily ranging from 10 to 40 nt. Data are presented as the mean of miRNA concentration ± SD from four experiments. miRNA was normalized to total mRNA levels. B, Diminished global miRNA expression in EAE brain. C, Diminished global miRNA expression in coimmunoprecipitates with Ago proteins (pan Ago). The bars represent a mean expression ± SD from four independent experiments (four mice per experiment).
Figure 4.
Figure 4.
Whole-brain IHC analysis of Ago2, FXR1, and GW182 in EAE compared with control healthy mice. A, Ago2 expression was decreased in EAE brain (green) and in MAG-positive cells versus healthy mice brain (yellow in merge images). B, FXR1 expression was decreased in EAE brain (green color) and in MAG-positive cells (yellow color) versus healthy mice brain. C, Expression of GW182 was not different in EAE versus healthy mice in whole-brain and in MAG-positive cells. Frozen 6 μm sagittal cross-sections of whole brain were prepared, scanned, and the final image prepared from a montage of at least 250 single images. Average fluorescence (average area) and total fluorescence intensity (Tot. Area) were analyzed using an electronic fluorescence autosegmentation system (BD Biosciences AttoVision software). The isotype control and secondary antibody incubated without the first Ab were negative.
Figure 5.
Figure 5.
Decreased expression of Ago2 and FXR1 and the deficient formation of Ago2/GW182 and Ago2/FXR1 complexes in EAE OLs. A, ICC analysis of Ago2/GW182 (top) and Ago2/FXR1 (bottom) in ex vivo isolated OLs. Yellow areas on the merged images indicate colocalization of Ago2 with GW182 and Ago2 with FXR1. The isotype control and secondary antibody incubated without the first Ab were negative. Numerical data from four independent experiments are presented as a sum of the fluorescence regions of all segments divided by the number of segments (average area). B, mRNA for Ago2, GW182, and FXR1 relative expression in EAE compared with healthy OL lysates. Data represent the mean of relative mRNA expression ± SD from four independent experiments. C, Diminished global miRNA levels in EAE compared with healthy OLs. The bars represent the mean amount of miRNA from four independent experiments (four mice per experiment). D, Differential expression of 86 miRNAs in EAE OLs versus OLs isolated from healthy mice. The pink lines indicate thresholds of at least 3-fold upregulation or downregulation of respective miRNA levels. Data are representative of three independent experiments.
Figure 6.
Figure 6.
Decreased expression of Ago2 and FXR1 in brain-infiltrating T lymphocytes in EAE and deficiency formation of Ago2/GW182 and Ago2/FXR1 complexes. A, ICC analysis of Ago2/GW182 (top) and Ago2/FXR1 (bottom) proteins in EAE brain-infiltrating T cells and CD3+ SCs from EAE and healthy mice. Yellow areas on merged images (arrows) indicate colocalization of Ago2 with GW182 and Ago2 with FXR1. The isotype control and secondary antibody incubated without the first Ab were negative. Numerical data from four independent experiments are presented as a sum of the fluorescence regions of all segments divided by the number of segments (average area). B, mRNA for Ago2, FXR1, and GW182 expression in EAE brain-infiltrating T cells compared with EAE CD3+ SCs. Data represent the mean of relative mRNA expression ± SD from four independent experiments (four mice per experiment).
Figure 7.
Figure 7.
Coimmunoprecipitation of Ago2, GW182, and FXR1 in CD3+ SCs of EAE and control healthy mice. A, Increased Ago2 expression in Ago2/GW182 complexes. B, Increased FXR1 expression in FXR1/GW182 complexes. C, Increased FXR1 expression in FXR1/Ago2 complexes in EAE CD3+ SCs versus control CD3+ SCs. Ago2 and FXR1 Western blots were normalized to GW182 (right top) and for FXR1/Ago2 immunoprecipitation to Ago2 (right bottom). Data are presented as the intensity of optical density of the area under each band's peak ± SD. Each bar represents mean data from four independent experiments (four mice per experiment). D, mRNA for Ago2, FXR1, and GW182 in EAE CD3+ SCs compared with control healthy mouse CD3+ SCs. Data represent the mean of relative mRNA expression ± SD from four independent experiments (four mice per experiment).
Figure 8.
Figure 8.
Confocal microscopy analysis of FXR1 with Ago2 in EAE CD3+ SCs and EAE brain-infiltrating T lymphocytes compared with CD3+ SCs from healthy mice. Arrows highlight more intense formation of Ago2/FXR1 complexes (yellow color) in EAE CD3+ SCs compared with healthy CD3+ SCs or brain-infiltrating T cells. To better visualize colocalization of FXR1 with Ago2, three representative merged cells without DNA signal were magnified.
Figure 9.
Figure 9.
Upregulation of global miRNA level in EAE CD3+ SCs and downregulation of global miRNA level in EAE brain-infiltrating T cells. A, miRNA region defined arbitrarily (range 10–40 nt). Data from one of four experiments performed is shown. B, Average global miRNA concentration ± SD in EAE CD3+ SCs versus control healthy mouse CD3+ SCs and brain-infiltrating T cells. C, miRNA profiling of control healthy mouse CD3+ SCs, EAE CD3+ SCs, and brain-infiltrating T cells. The majority of analyzed miRNAs are overexpressed in EAE CD3+ SCs compared with healthy control mouse SCs (top) and the majority of miRNA from brain-infiltrating T cells showed decreased expression compared with EAE CD3+ SCs (bottom).

Similar articles

Cited by

References

    1. Bhattacharyya SN, Filipowicz W. Argonautes and company: sailing against the wind. Cell. 2007;128:1027–1028. doi: 10.1016/j.cell.2007.02.033. - DOI - PubMed
    1. Boudreau RL, Jiang P, Gilmore BL, Spengler RM, Tirabassi R, Nelson JA, Ross CA, Xing Y, Davidson BL. Transcriptome-wide discovery of microRNA binding sites in human brain. Neuron. 2014;81:294–305. doi: 10.1016/j.neuron.2013.10.062. - DOI - PMC - PubMed
    1. Breving K, Esquela-Kerscher A. The complexities of microRNA regulation: mirandering around the rules. Int J Biochem Cell Biol. 2010;42:1316–1329. - PubMed
    1. Bronevetsky Y, Villarino AV, Eisley CJ, Barbeau R, Barczak AJ, Heinz GA, Kremmer E, Heissmeyer V, McManus MT, Erle DJ, Rao A, Ansel KM. T cell activation induces proteasomal degradation of Argonaute and rapid remodeling of the microRNA repertoire. J Exp Med. 2013;210:417–432. doi: 10.1084/jem.20111717. - DOI - PMC - PubMed
    1. Budde H, Schmitt S, Fitzner D, Opitz L, Salinas-Riester G, Simons M. Control of oligodendroglial cell number by the miR-17-92 cluster. Development. 2010;137:2127–2132. doi: 10.1242/dev.050633. - DOI - PubMed

Publication types

MeSH terms

LinkOut - more resources