. 2015 May 13;35(19):7587-99.
doi: 10.1523/JNEUROSCI.0652-15.2015.

Neurons forming optic glomeruli compute figure-ground discriminations in Drosophila

Affiliations

Neurons forming optic glomeruli compute figure-ground discriminations in Drosophila

Jacob W Aptekar et al. J Neurosci. .

Abstract

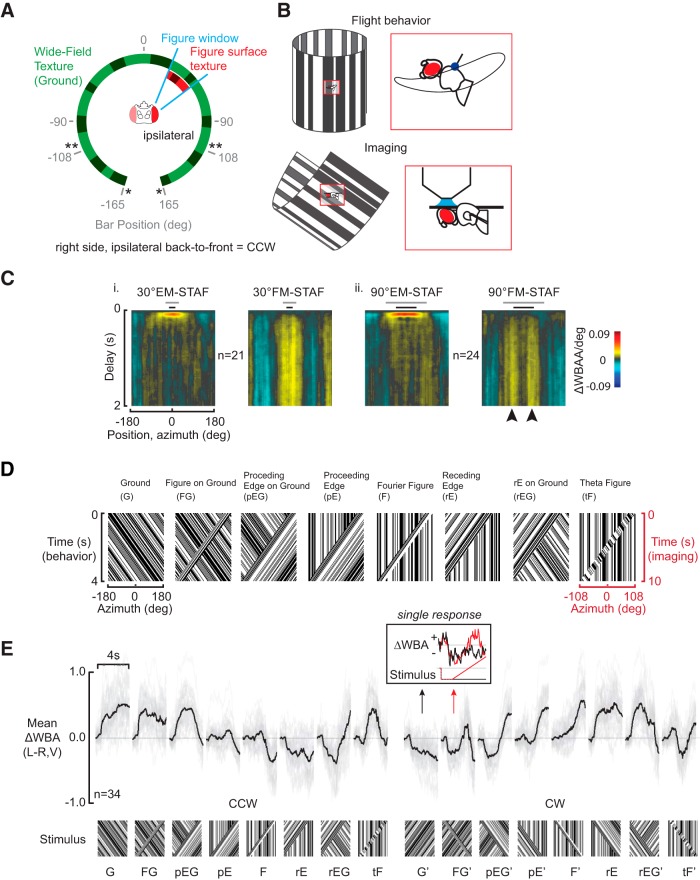
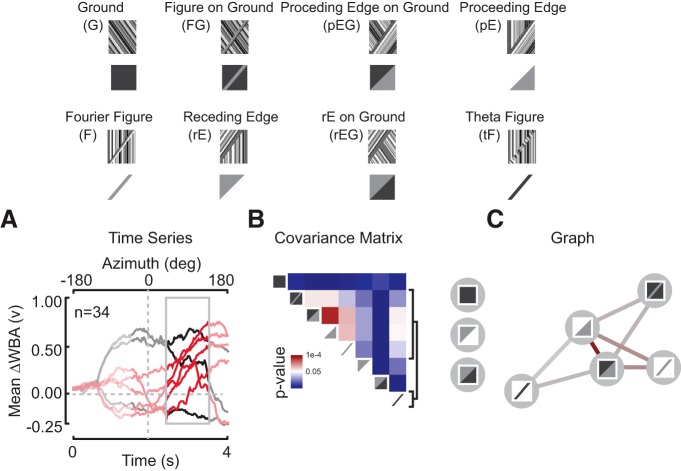
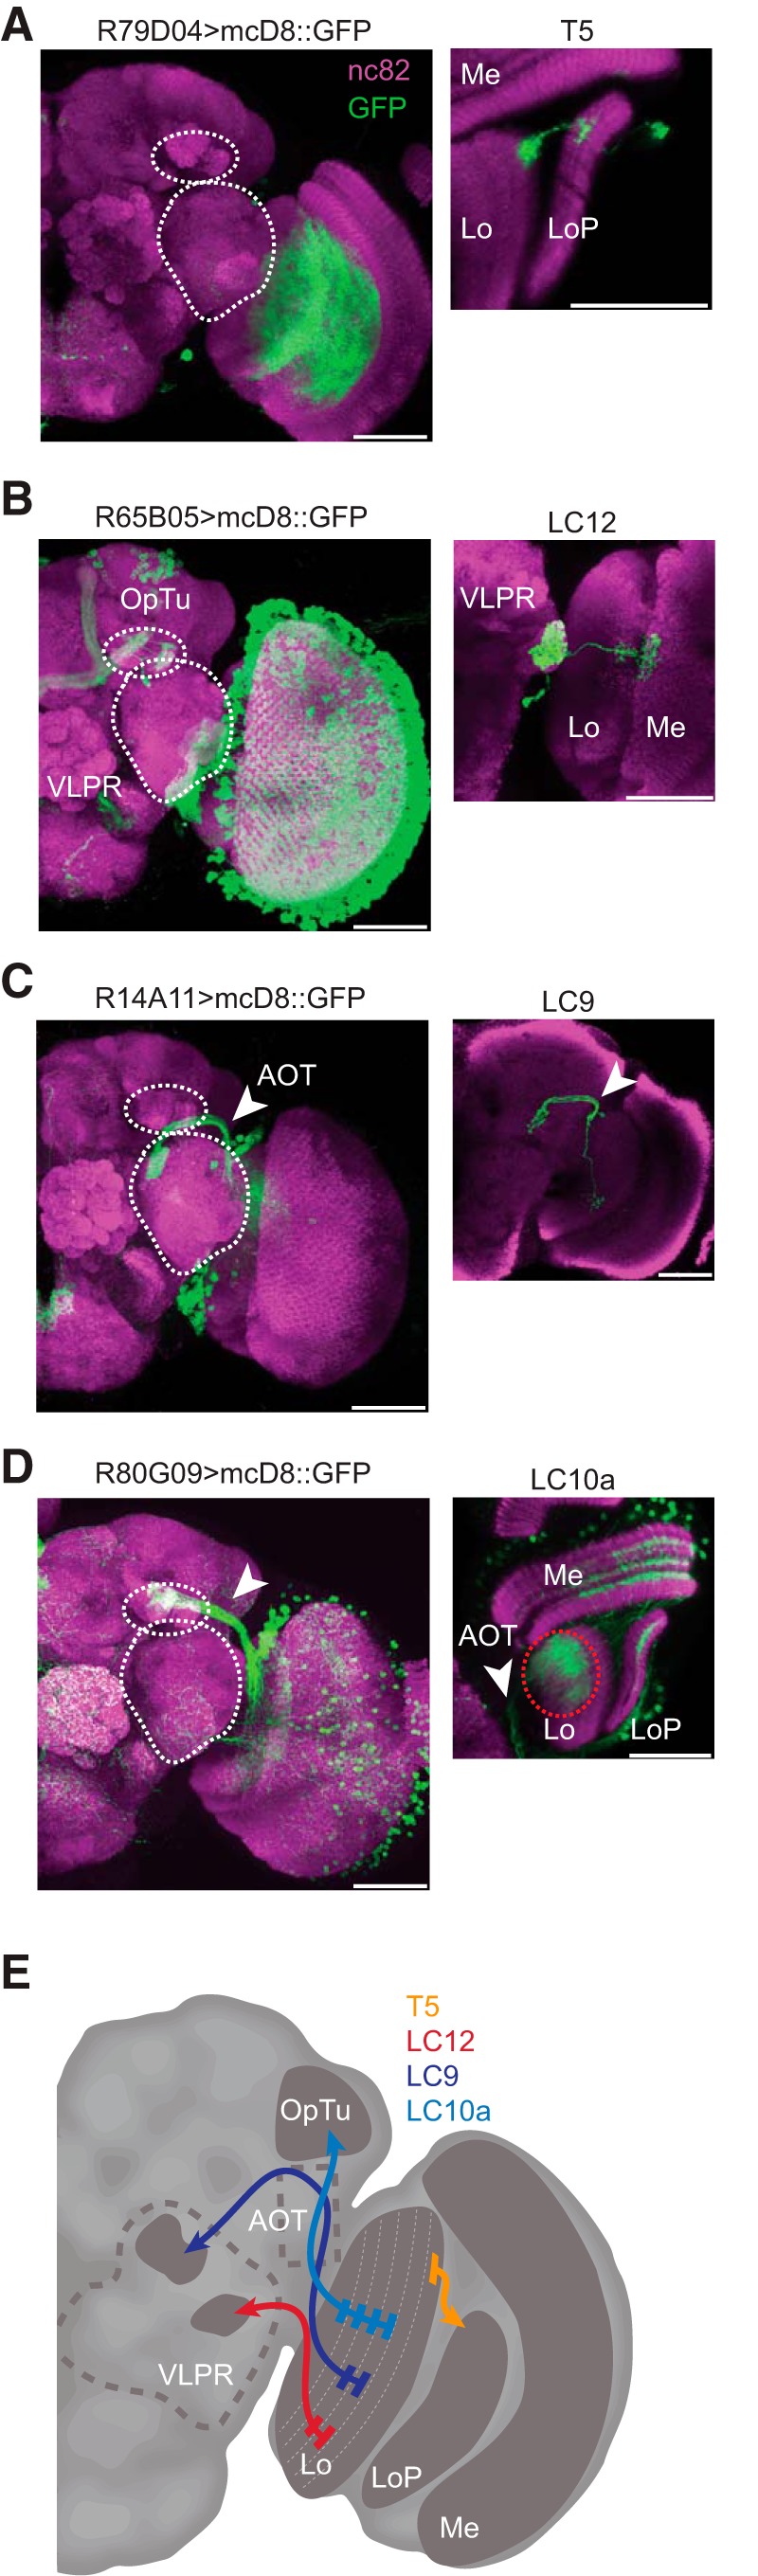
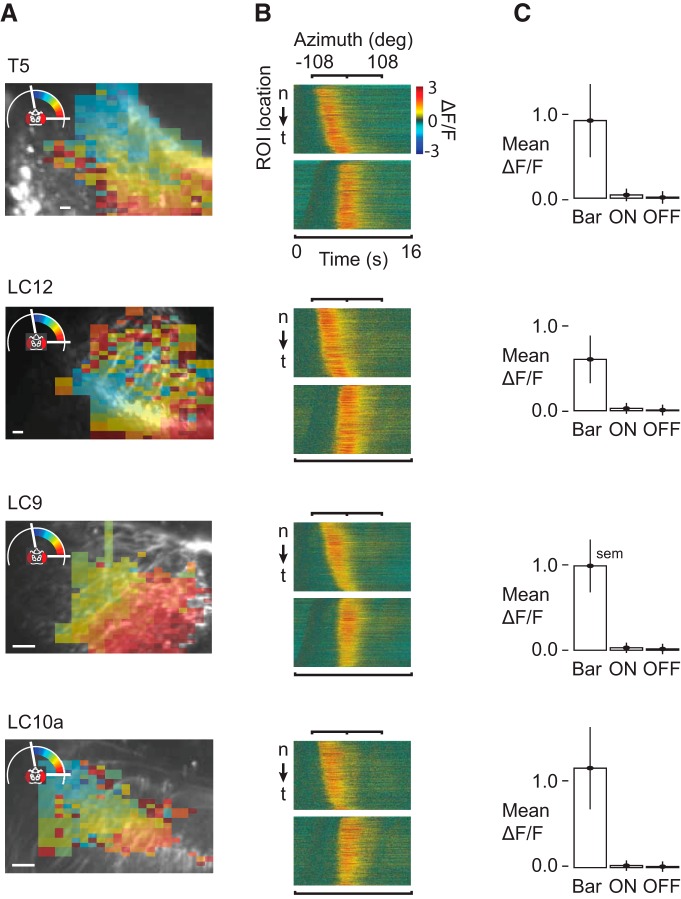
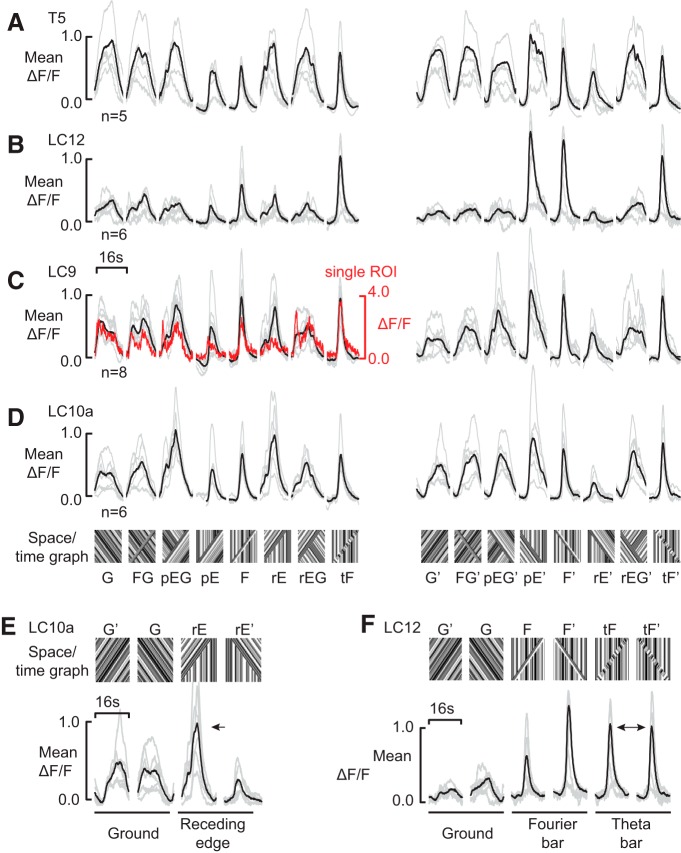
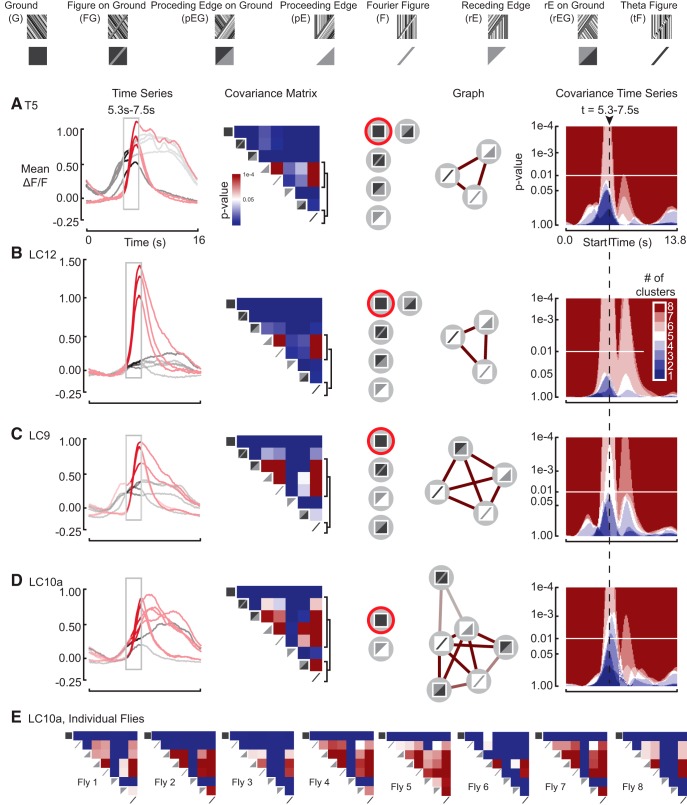
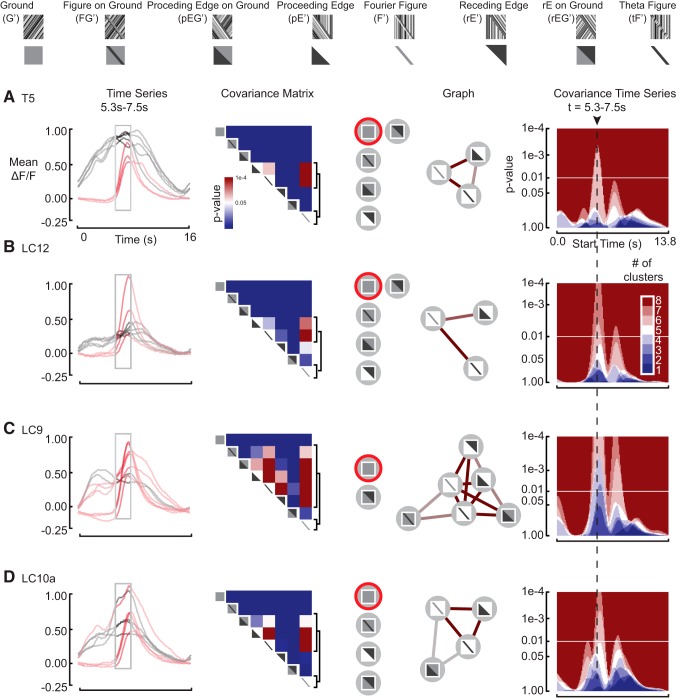
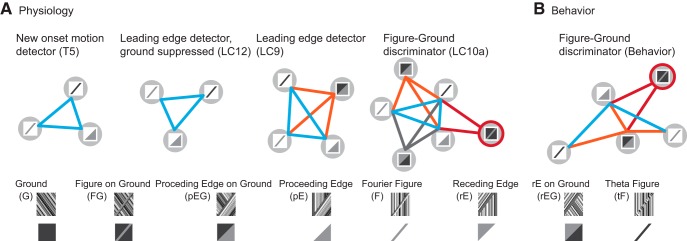
Many animals rely on visual figure-ground discrimination to aid in navigation, and to draw attention to salient features like conspecifics or predators. Even figures that are similar in pattern and luminance to the visual surroundings can be distinguished by the optical disparity generated by their relative motion against the ground, and yet the neural mechanisms underlying these visual discriminations are not well understood. We show in flies that a diverse array of figure-ground stimuli containing a motion-defined edge elicit statistically similar behavioral responses to one another, and statistically distinct behavioral responses from ground motion alone. From studies in larger flies and other insect species, we hypothesized that the circuitry of the lobula--one of the four, primary neuropiles of the fly optic lobe--performs this visual discrimination. Using calcium imaging of input dendrites, we then show that information encoded in cells projecting from the lobula to discrete optic glomeruli in the central brain group these sets of figure-ground stimuli in a homologous manner to the behavior; "figure-like" stimuli are coded similar to one another and "ground-like" stimuli are encoded differently. One cell class responds to the leading edge of a figure and is suppressed by ground motion. Two other classes cluster any figure-like stimuli, including a figure moving opposite the ground, distinctly from ground alone. This evidence demonstrates that lobula outputs provide a diverse basis set encoding visual features necessary for figure detection.

Keywords: feature detection; figure–ground discrimination; optomotor.


Figures

Figure 1.
Figure 1.
Figure–ground discrimination is based on an edge-detection mechanism. A, Schematic diagram of panoramic LED arena for behavioral (*) and physiology (**) experiments. Pixel spacing is 3.75°. All patterns were composed only of vertical stripes. B, Schematic diagram of fly orientation relative to flight and imaging arena. The angle of the thorax relative to the axis of the arena is ∼35° in both cases. Due to flexion of the neck, the angle of the head relative to the arena is slightly larger in the restrained imaging preparation than in the flight arena. C, STAFs for FM and sfEM for a 30° wide (Ci) and 9° wide (Cii) figure. The gray and black bars above each STAF signify the extent of the 90° and 30° bars, respectively. The lobe separation corresponds well to the separation of the two edges of the 90° bar (black arrowheads). D, Stimuli used for both behavior and physiology studies. Mirror symmetric versions of all stimuli were also used for a total of 16 experimental conditions. E, Steering responses to visual stimuli and their mirror symmetric counterparts. Means of all animals are plotted in black. Mean responses from individual flies are plotted in light gray. Inset, Raw traces for the ground (black) and figure–ground (red); N = 34 flies.
Figure 2.
Figure 2.
Perceptual graph for Drosophila tethered, and optomotor response to figure–ground stimuli. A, Temporally aligned mean trajectories from Figure 1E for the eight counterclockwise stimulus conditions. The highlighted window corresponds to the analysis interval. The red trajectories correspond to the five stimuli that compose the linked elements of the PG at this time point. B, The covariance matrix at the specified time point. A p value of 0.05 is white. Brackets correspond to rows of the matrix that contain non-zero entries and correspond to stimuli in the perceptual graph. C, The PG for the wing steering behavior of the fly. Edges are drawn only for edges correspond to covariance values from B that are significant at a threshold set by p < 0.05. Edge color corresponds to the covariance values from B. Edge color corresponds to p value from B. Stimuli that reside outside the PG are indicated in a vertical stack.
Figure 3.
Figure 3.
Anatomy of lobula projection neurons. All confocal images indicate nc982 neuropil staining in magenta and GFP in green. Scale bars, 50 μm. A, Whole-hemisphere labeling for R79D04 Gal4 line and single-cell example (inset) of a T5 neuron. B, Whole-hemisphere labeling for R65B05 Gal4 line and single-cell example (inset) of a LC12 neuron (shown glomerular region contains projections from multiple cells but only one of them shown); white dashed circles bound the optic tubercle (OpTu) and VLPR. C, Whole-hemisphere labeling for R14A11 Gal4 line and single-cell example (inset) of a LC9 neuron (shown glomerular region contains projections from multiple cells but only one of them shown). D, Whole-hemisphere labeling for R80G09 Gal4 line. We were unable to achieve single-cell labeling in this line, yet identified the LC10a subtype based on the axonal projections being confined only to the medial part of the optic tubercle (arrowhead). E, A schematic diagram depicting the input layers of the lobula and the projection targets of each cell type imaged (Mu et al., 2012).
Figure 4.
Figure 4.
Initial physiological classification. Each cell type tiles the visual field. Responses do not vary by retinotopic location. ON and OFF responses are very small compared with figure-motion responses. Cell-types are T5, LC12, LC9, and LC10a (top-to-bottom). A, Raw image of dendritic arbors from an imaging trial for each cell type, Scale bar, 10 μm. Receptive field map of pruned ROIs from the trial depicted in the raw image with the receptive field center mapped to the color of the ROI and superimposed on the raw image. The pruned ROI mask was computed by recursively subdividing the image according to the mean luminance of each pixel (see Materials and Methods, Image processing). Average pixel size was 400–500 nm on a side. Minimum ROI size was set at 50px, or ∼4 μm on a side; n = 5 flies (T5), n = 6 flies (LC12), n = 8 flies (LC9), n = 6 flies (LC10a). B, For each cell type, the top shows the raw timing of the response of each ROI to a front-to-back Fourier bar on a stationary ground (F stimulus). The bottom for each cell type shows the same responses following temporal alignment. All data were temporally aligned before undergoing further analysis. C, Each cell type shows a large response to the onset of motion within its receptive field relative to the response to lights-ON or lights-OFF. These cell types are configured to detect motion stimuli preferentially.
Figure 5.
Figure 5.
Calcium imaging in LPNs reveals a diverse code for edge- and figure-motion. A, Mean of mean response by individual from the T5 line in black. Mean of individuals in gray. B, Mean of mean response by individual from the LC12 line in black. Mean of individuals in gray. C, Mean of mean response by individual from LC9 in black. Mean of individuals in gray. Trajectory from one exemplar ROI in red (99th percentile, ranked by the strength of the first principal component, where principal component analysis is performed on the response trajectory across all 16 stimulus conditions). D, Mean of mean response by individual from LC10a. Mean of individuals in gray. E, LC10a shows no differential activation in response to opposite directions of ground motion, but dramatic differential activation in response to opposite directions of the motion of a single receding edge. F, LC12 shows little differential activation for the two directions of ground motion, yet shows marked directional tuning to the two directions of passage of a Fourier bar, indicating a preference for back-to-front figure motion. It shows a near equal activation to the two directions of theta motion, for which the direction of motion of the figure window and the internal texture oppose.
Figure 6.
Figure 6.
PG construction for back-to-front response to the leading edges of figures and edge-type stimuli across all cell classes. A, T5 neurons are local motion detectors. Time series shows temporally aligned mean responses from Figure 4E for the eight front-to-back stimulus conditions. The highlighted window corresponds to the analysis interval, which in turn corresponds to the highlighted time point on the covariance matrix. The red trajectories correspond to the five stimuli the linked elements at this time point. For the covariance matrix at the specified time point, a p value of 0.01 is white. Brackets correspond to rows of the matrix that contain non-zero entries and correspond to stimuli in the perceptual graph. Graph shows the PG for the LPN responses of the fly. Edges are drawn only for covariance values that are significant at a threshold set by p < 0.01. Edge color corresponds to the covariance values from the covariance matrix. Covariance time series shows the number of discrete clusters in the PG as a function of the starting position of the time window. The two peaks evident in each heatmap correspond to clustering events elicited by passage of the leading and trailing edges of a figure through the receptive field of each ROI. B, LC12 neurons are ground-suppressed edge detectors. Analogous subfigure to A. C, LC9 neurons are figure–ground discriminators. Analogous subfigure to A. D, LC10a neurons are figure–ground discriminators. Analogous subfigure to A. E, Representative example of the covariance matrices at the specified time point across individual flies for the LC10a neuron subclass. The topology of the mean PG is largely preserved, even at the level of individual flies.
Figure 7.
Figure 7.
PG construction for front-to-back response to the leading edges of figures and edge-type stimuli across all cell classes. A, T5 neurons are local motion detectors. Analogous subfigure to Figure 6A. B, LC12 neurons are ground-suppressed edge detectors. Analogous subfigure to Figure 6A. C, LC9 neurons are figure–ground discriminators. Analogous subfigure to Figure 6A. D, LC10a neurons are figure–ground discriminators. Analogous subfigure to Figure 6A.
Figure 8.
Figure 8.
Topological classification of cell types and behavior. A, Back-to-front, leading edge PGs (singleton clusters excluded) across surveyed cell types. Homologous subnetworks are colored to highlight persistence across PGs at higher levels of complexity. The figure–ground stimulus is highlighted in red. Note that the red edges are not necessarily between homologous stimuli. B, PG for behavior.

References

    1. Akerboom J, Chen TW, Wardill TJ, Tian L, Marvin JS, Mutlu S, Calderón NC, Esposti F, Borghuis BG, Sun XR, Gordus A, Orger MB, Portugues R, Engert F, Macklin JJ, Filosa A, Aggarwal A, Kerr RA, Takagi R, Kracun S, et al. Optimization of a GCaMP calcium indicator for neural activity imaging. J Neurosci. 2012;32:13819–13840. doi: 10.1523/JNEUROSCI.2601-12.2012. - DOI - PMC - PubMed
    1. Albatineh AN, Niewiadomska-Bugaj M. Correcting Jaccard and other similarity indices for chance agreement in cluster analysis. Adv Data Anal Classif. 2011;5:179–200. doi: 10.1007/s11634-011-0090-y. - DOI
    1. Aptekar JW, Shoemaker PA, Frye MA. Figure tracking by flies is supported by parallel visual streams. Curr Biol. 2012;22:482–487. doi: 10.1016/j.cub.2012.01.044. - DOI - PubMed
    1. Aptekar JW, Keles MF, Mongeau JM, Lu PM, Frye MA, Shoemaker PA. Method and software for using m-sequences to characterize parallel components of higher-order visual tracking in Drosophila. Front Neural Circuits. 2014;8:130. doi: 10.3389/fncir.2014.00130. - DOI - PMC - PubMed
    1. Baccus SA, Olveczky BP, Manu M, Meister M. A retinal circuit that computes object motion. J Neurosci. 2008;28:6807–6817. doi: 10.1523/JNEUROSCI.4206-07.2008. - DOI - PMC - PubMed

Publication types

MeSH terms