Comparative Study
. 2015 Jul;53(7):2298-307.
doi: 10.1128/JCM.03076-14. Epub 2015 May 13.

Comparison of Inoculation with the InoqulA and WASP Automated Systems with Manual Inoculation

Affiliations
Comparative Study

Comparison of Inoculation with the InoqulA and WASP Automated Systems with Manual Inoculation

Antony Croxatto et al. J Clin Microbiol. 2015 Jul.

Abstract

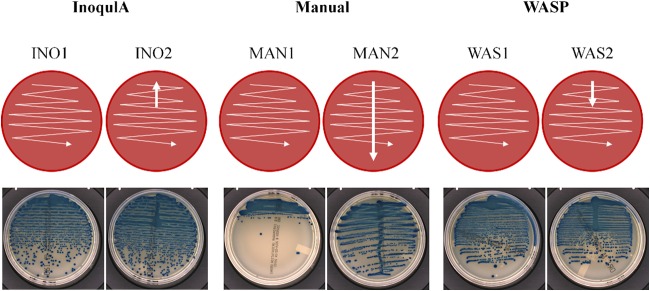
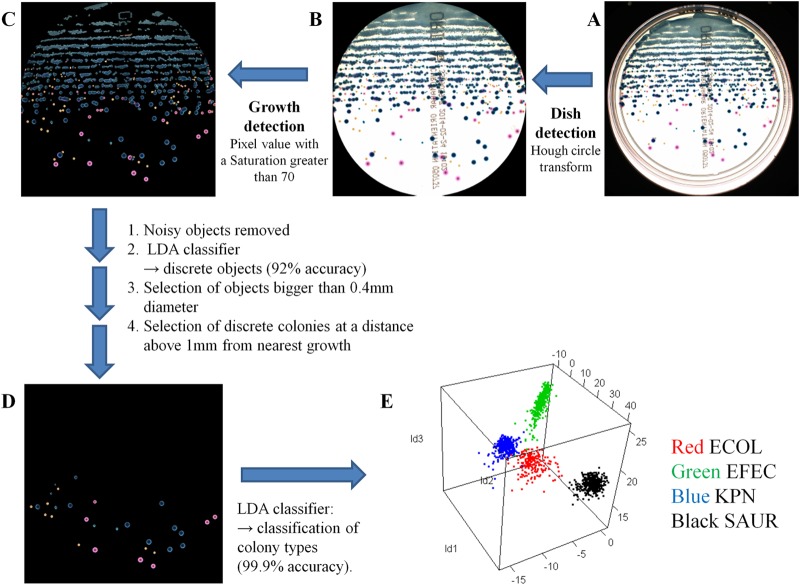
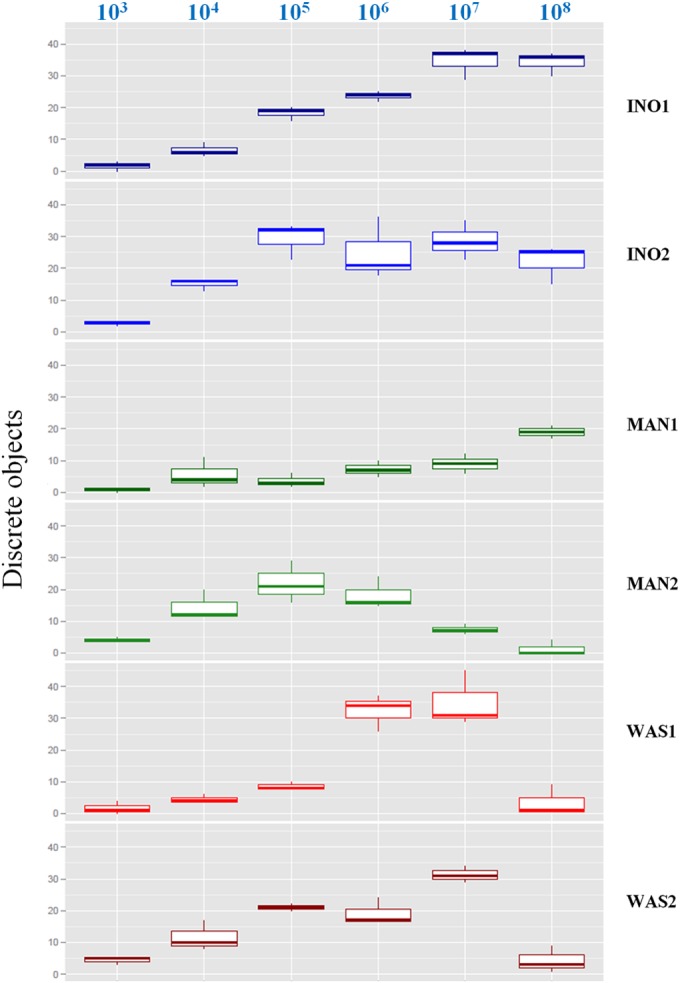
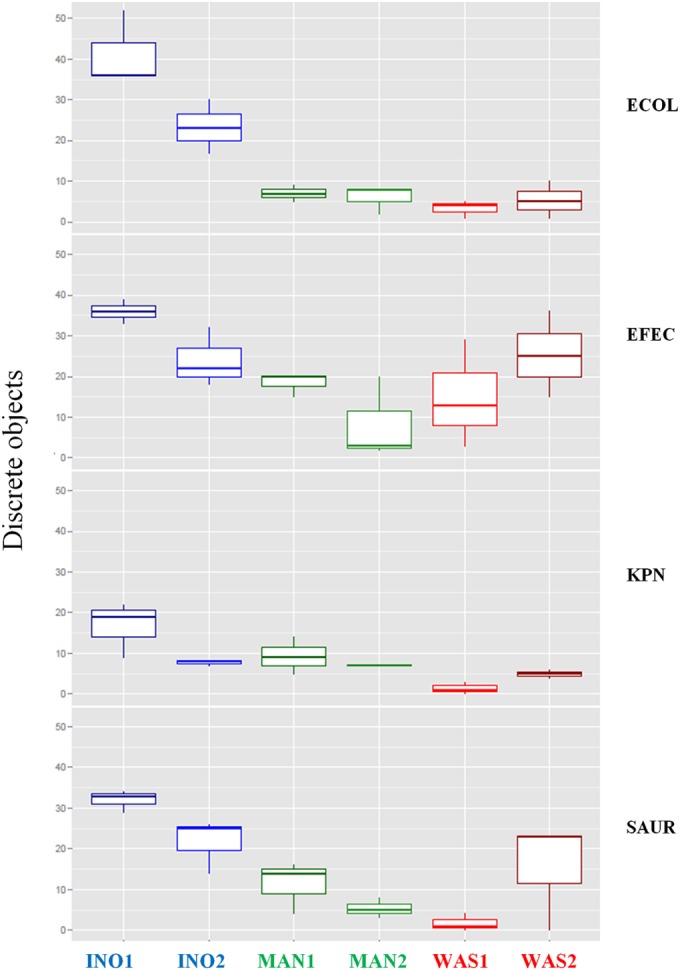
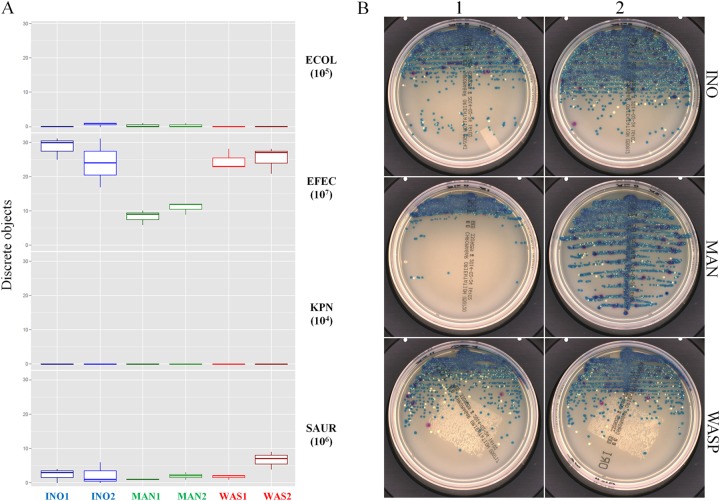
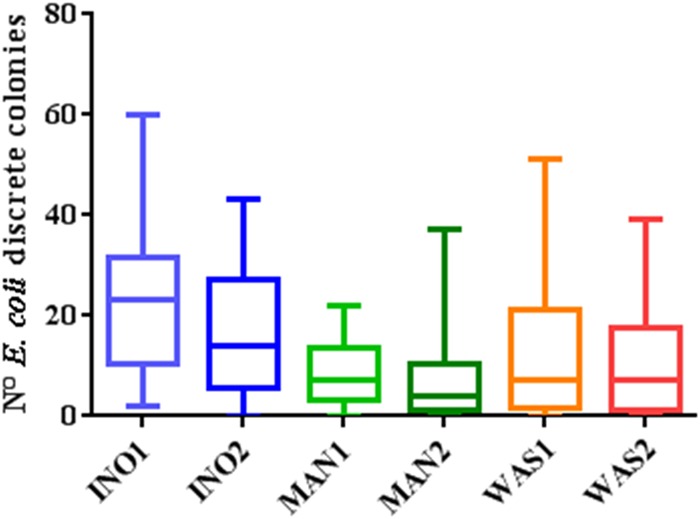
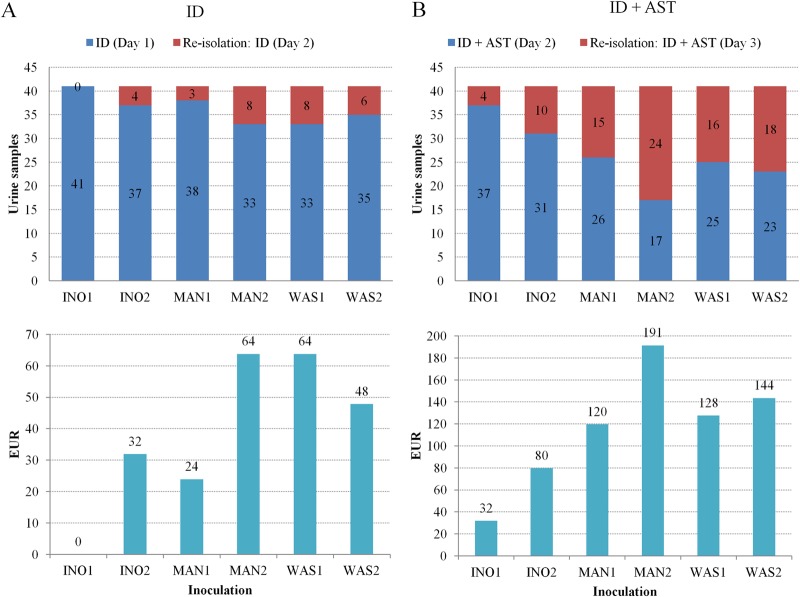
The quality of sample inoculation is critical for achieving an optimal yield of discrete colonies in both monomicrobial and polymicrobial samples to perform identification and antibiotic susceptibility testing. Consequently, we compared the performance between the InoqulA (BD Kiestra), the WASP (Copan), and manual inoculation methods. Defined mono- and polymicrobial samples of 4 bacterial species and cloudy urine specimens were inoculated on chromogenic agar by the InoqulA, the WASP, and manual methods. Images taken with ImagA (BD Kiestra) were analyzed with the VisionLab version 3.43 image analysis software to assess the quality of growth and to prevent subjective interpretation of the data. A 3- to 10-fold higher yield of discrete colonies was observed following automated inoculation with both the InoqulA and WASP systems than that with manual inoculation. The difference in performance between automated and manual inoculation was mainly observed at concentrations of >10(6) bacteria/ml. Inoculation with the InoqulA system allowed us to obtain significantly more discrete colonies than the WASP system at concentrations of >10(7) bacteria/ml. However, the level of difference observed was bacterial species dependent. Discrete colonies of bacteria present in 100- to 1,000-fold lower concentrations than the most concentrated populations in defined polymicrobial samples were not reproducibly recovered, even with the automated systems. The analysis of cloudy urine specimens showed that InoqulA inoculation provided a statistically significantly higher number of discrete colonies than that with WASP and manual inoculation. Consequently, the automated InoqulA inoculation greatly decreased the requirement for bacterial subculture and thus resulted in a significant reduction in the time to results, laboratory workload, and laboratory costs.


Figures

FIG 1
FIG 1
Manual and automated semiquantitative streaking protocols. Two manual quantitative plate inoculation patterns were performed by an experienced microbiologist with 10-μl loops in a zigzag streaking pattern (MAN1), or a central single streaking throughout the plate followed by a zigzag pattern (MAN2). Two similar automated quantitative plate inoculation patterns with the InoqulA BT and the WASP were performed in a zigzag streaking pattern (INO1 and WAS1, respectively) or a central single streaking of 20 mm followed by a zigzag pattern (INO2 and WAS2, respectively). The InoqulA INO1 pattern and the WASP WAS2 pattern were used as optimized factory-designed semiquantitative inoculation protocols. The manual MAN2 streaking approach was chosen as the conventional semiquantitative manual inoculation used in most diagnostic laboratories. The INO2 is similar to the WAS2 streaking pattern, whereas the WAS1 and MAN1 are similar to the INO1 streaking pattern.
FIG 2
FIG 2
Image analysis procedure. Image analysis was performed in 5 steps (A to E). (A) Raw image of the petri dish. (B) Surface pixels of the petri dish. (C) Pixels considered to be growth. (D) Discrete colonies. (E) Four distinct clusters produced by linear discriminant analysis. Each color represents a different bacterial species. ECOL, E. coli; EFEC, E. faecalis; KPN, K. pneumoniae; SAUR, S. aureus.
FIG 3
FIG 3
Performance of manual, InoqulA, and WASP plate inoculations at different bacterial concentrations of E. coli. Shown are box-and-whisker plots (representing the minimum, first quartile, median, third quartile, and maximum) of the number of discrete colonies following InoqulA (INO1 and INO2), manual (MAN1 and MAN2), and WASP (WAS1 and WAS2) plate inoculations of different bacterial concentrations of E. coli ranging from 103 to 108 CFU/ml (top).
FIG 4
FIG 4
Performance of manual, InoqulA, and WASP inoculations following streaking of monomicrobial samples at a concentration of 108 CFU/ml. Shown are box-and-whisker plots (representing the minimum, first quartile, median, third quartile, and maximum) of the number of discrete colonies of E. coli (ECOL), E. faecalis (EFEC), K. pneumoniae (KPN), and S. aureus (SAUR) following InoqulA (INO1 and INO2), manual (MAN1 and MAN2), and WASP (WAS1 and WAS2) plate inoculations.
FIG 5
FIG 5
Recovery of discrete colonies of each bacterial species contained in polymicrobial samples following manual and automated inoculation. Shown are box-and-whisker plots (representing the minimum, first quartile, median, third quartile, and maximum) (A) and plate images (B) of the number of discrete colonies following InoqulA (INO1 and INO2), manual (MAN1 and MAN2), and WASP (WAS1 and WAS2) plate inoculations of a polymicrobial sample containing E. faecalis at 107 CFU/ml, S. aureus at 106 CFU/ml, E. coli at 105 CFU/ml, and K. pneumoniae at 104 CFU/ml representing 1:1, 10:1, 100:1, and 1,000:1 ratios between the highest and the lowest bacterial concentrations, respectively.
FIG 6
FIG 6
Performance of manual and automated inoculation on clinical urine samples. Shown are box-and-whisker plots (representing the minimum, first quartile, median, third quartile, and maximum) of the yield of discrete colonies from 41 cloudy urine specimen clinical samples positive for E. coli obtained following inoculation of 10 μl on chromogenic agar with the InoqulA (INO1 and INO2), manual (MAN1 and MAN2), and WASP (WAS1 and WAS2) methods. A statistically significantly higher number of discrete colonies (one-way ANOVA multiple comparison, P < 0.05) was observed between the INO1 and the MAN1, MAN2, WAS1, and WAS2 inoculations.
FIG 7
FIG 7
Impact of the performance of the different manual (MAN1 and MAN2) and automated inoculation InoqulA (INO1 and INO2) and WASP (WAS1 and WAS2) systems on the time to results and laboratory costs. (A) One discrete colony was required to perform identification by MALDI-TOF MS at day 1 postinoculation. Reisolation was performed when at least one colony was not obtained, leading to a delayed time to results of 1 working day (ID report at day 2). An additional laboratory cost of 3.3 EUR (3.6 USD) per reisolation was calculated for each subculture, and the results were extrapolated to 100 samples for clarity. (B) A minimum number of 6 discrete colonies grown on BBL chromogenic agar was required (i) to perform an ID by MALDI-TOF MS and (ii) to make a bacterial suspension in 2 ml of saline solution equivalent to a 0.5 McFarland standard turbidity to complete AST at day 1 and to report the results at day 2. Thus, each sample containing <6 colonies needed reisolation, leading to a delayed time to AST results of 1 working day (AST report at day 3). Similar to identification, an additional laboratory cost of 3.3 EUR (3.6 USD) per reisolation was calculated for each subculture, and the results were extrapolated to 100 samples for simplicity.

References

    1. Greub G, Prod'hom G. 2011. Automation in clinical bacteriology: what system to choose? Clin Microbiol Infect 17:655–660. doi:10.1111/j.1469-0691.2011.03513.x. - DOI - PubMed
    1. Mischnik A, Mieth M, Busch CJ, Hofer S, Zimmermann S. 2012. First evaluation of automated specimen inoculation for wound swab samples by use of the Previ Isola system compared to manual inoculation in a routine laboratory: finding a cost-effective and accurate approach. J Clin Microbiol 50:2732–2736. doi:10.1128/JCM.05501-11. - DOI - PMC - PubMed
    1. Froment P, Marchandin H, Vande Perre P, Lamy B. 2014. Automated versus manual sample inoculations in routine clinical microbiology: a performance evaluation of the fully automated InoqulA instrument. J Clin Microbiol 52:796–802. doi:10.1128/JCM.02341-13. - DOI - PMC - PubMed
    1. Bourbeau PP, Swartz BL. 2009. First evaluation of the WASP, a new automated microbiology plating instrument. J Clin Microbiol 47:1101–1106. doi:10.1128/JCM.01963-08. - DOI - PMC - PubMed
    1. Jones G, Matthews R, Cunningham R, Jenks P. 2011. Comparison of automated processing of flocked swabs with manual processing of fiber swabs for detection of nasal carriage of Staphylococcus aureus. J Clin Microbiol 49:2717–2718. doi:10.1128/JCM.00504-11. - DOI - PMC - PubMed

MeSH terms

LinkOut - more resources