

Global regulation of heterochromatin spreading by Leo1
- PMID: 25972440
- PMCID: PMC4450266
- DOI: 10.1098/rsob.150045
Global regulation of heterochromatin spreading by Leo1
Abstract
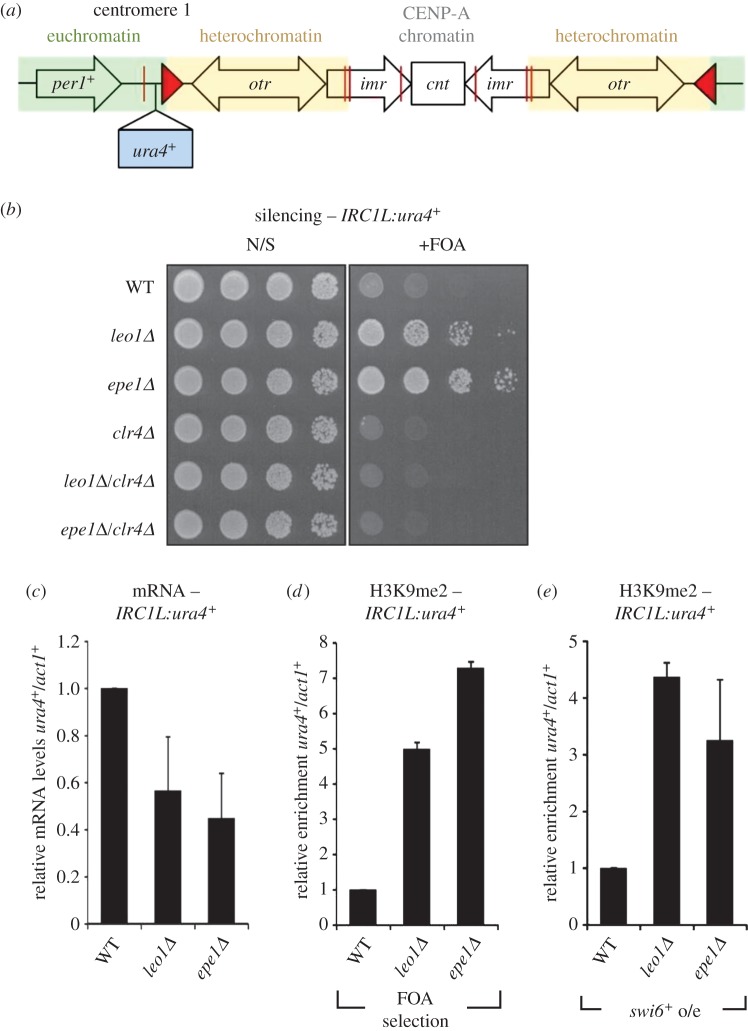
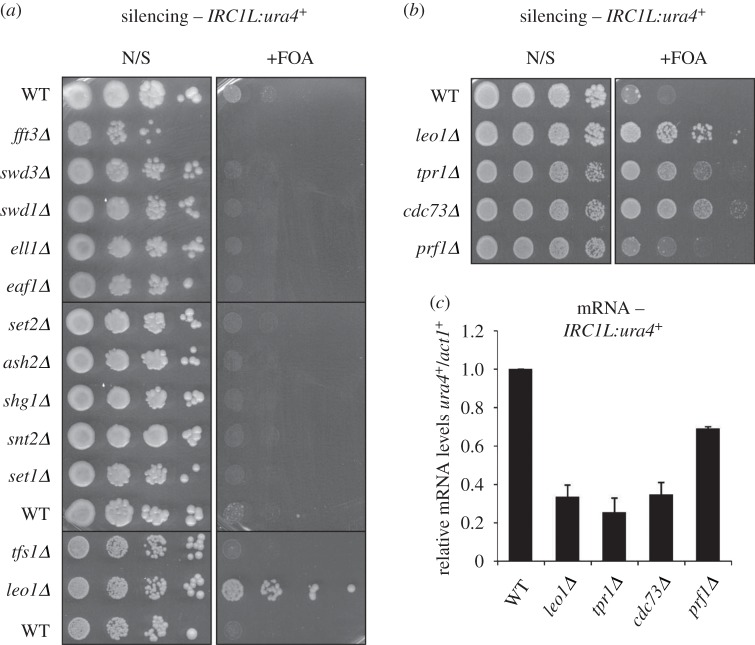
Heterochromatin plays important roles in eukaryotic genome regulation. However, the repressive nature of heterochromatin combined with its propensity to self-propagate necessitates robust mechanisms to contain heterochromatin within defined boundaries and thus prevent silencing of expressed genes. Here we show that loss of the PAF complex (PAFc) component Leo1 compromises chromatin boundaries, resulting in invasion of heterochromatin into flanking euchromatin domains. Similar effects are seen upon deletion of other PAFc components, but not other factors with related functions in transcription-associated chromatin modification, indicating a specific role for PAFc in heterochromatin regulation. Loss of Leo1 results in reduced levels of H4K16 acetylation at boundary regions, while tethering of the H4K16 acetyltransferase Mst1 to boundary chromatin suppresses heterochromatin spreading in leo1Δ cells, suggesting that Leo1 antagonises heterochromatin spreading by promoting H4K16 acetylation. Our findings reveal a previously undescribed role for PAFc in regulating global heterochromatin distribution.
Keywords: Leo1; epigenetics; fission yeast; genome regulation; heterochromatin.
Figures


Similar articles
-
Leo1 is essential for the dynamic regulation of heterochromatin and gene expression during cellular quiescence.Epigenetics Chromatin. 2019 Jul 17;12(1):45. doi: 10.1186/s13072-019-0292-7. Epigenetics Chromatin. 2019. PMID: 31315658 Free PMC article.
-
The Paf1 complex factors Leo1 and Paf1 promote local histone turnover to modulate chromatin states in fission yeast.EMBO Rep. 2015 Dec;16(12):1673-87. doi: 10.15252/embr.201541214. Epub 2015 Oct 29. EMBO Rep. 2015. PMID: 26518661 Free PMC article.
-
Epe1 recruits BET family bromodomain protein Bdf2 to establish heterochromatin boundaries.Genes Dev. 2013 Sep 1;27(17):1886-902. doi: 10.1101/gad.221010.113. Genes Dev. 2013. PMID: 24013502 Free PMC article.
-
RNAi-mediated chromatin silencing in fission yeast.Curr Top Microbiol Immunol. 2008;320:157-83. doi: 10.1007/978-3-540-75157-1_8. Curr Top Microbiol Immunol. 2008. PMID: 18268844 Review.
-
Chromosome boundary elements and regulation of heterochromatin spreading.Cell Mol Life Sci. 2014 Dec;71(24):4841-52. doi: 10.1007/s00018-014-1725-x. Epub 2014 Sep 7. Cell Mol Life Sci. 2014. PMID: 25192661 Free PMC article. Review.
Cited by
-
Post-Translational Modifications of Histones Are Versatile Regulators of Fungal Development and Secondary Metabolism.Toxins (Basel). 2022 Apr 29;14(5):317. doi: 10.3390/toxins14050317. Toxins (Basel). 2022. PMID: 35622565 Free PMC article. Review.
-
Genome-wide Screening of Regulators of Catalase Expression: ROLE OF A TRANSCRIPTION COMPLEX AND HISTONE AND tRNA MODIFICATION COMPLEXES ON ADAPTATION TO STRESS.J Biol Chem. 2016 Jan 8;291(2):790-9. doi: 10.1074/jbc.M115.696658. Epub 2015 Nov 13. J Biol Chem. 2016. PMID: 26567340 Free PMC article.
-
Unprogrammed epigenetic variation mediated by stochastic formation of ectopic heterochromatin.Curr Genet. 2020 Apr;66(2):319-325. doi: 10.1007/s00294-019-01031-4. Epub 2019 Oct 9. Curr Genet. 2020. PMID: 31598751 Review.
-
TOR complex 2 in fission yeast is required for chromatin-mediated gene silencing and assembly of heterochromatic domains at subtelomeres.J Biol Chem. 2018 May 25;293(21):8138-8150. doi: 10.1074/jbc.RA118.002270. Epub 2018 Apr 9. J Biol Chem. 2018. PMID: 29632066 Free PMC article.
-
Control of heterochromatin localization and silencing by the nuclear membrane protein Lem2.Genes Dev. 2016 Jan 15;30(2):133-48. doi: 10.1101/gad.271288.115. Epub 2016 Jan 7. Genes Dev. 2016. PMID: 26744419 Free PMC article.
References
-
- Bannister AJ, Kouzarides T. 2011. Regulation of chromatin by histone modifications. Cell Res. 21, 381–395. (doi:10.1038/cr.2011.22) - DOI - PMC - PubMed
-
- Grewal SI, Jia S. 2007. Heterochromatin revisited. Nat. Rev. Genet. 8, 35–46. (doi:10.1038/nrg2008) - DOI - PubMed
-
- Talbert PB, Henikoff S. 2006. Spreading of silent chromatin: inaction at a distance. Nat. Rev. Genet. 7, 793–803. (doi:10.1038/nrg1920) - DOI - PubMed
-
- Bannister AJ, Zegerman P, Partridge JF, Miska EA, Thomas JO, Allshire RC, Kouzarides T. 2001. Selective recognition of methylated lysine 9 on histone H3 by the HP1 chromo domain. Nature 410, 120–124. (doi:10.1038/35065138) - DOI - PubMed
-
- Lachner M, O'Carroll D, Rea S, Mechtler K, Jenuwein T. 2001. Methylation of histone H3 lysine 9 creates a binding site for HP1 proteins. Nature 410, 116–120. (doi:10.1038/35065132) - DOI - PubMed
Publication types
MeSH terms
Substances
Grants and funding
LinkOut - more resources
Full Text Sources
Other Literature Sources
Molecular Biology Databases
Research Materials
Miscellaneous
