. 2015 Aug 1;309(3):C179-89.
doi: 10.1152/ajpcell.00079.2015. Epub 2015 May 13.

Defining the roles of arrestin2 and arrestin3 in vasoconstrictor receptor desensitization in hypertension

Affiliations

Defining the roles of arrestin2 and arrestin3 in vasoconstrictor receptor desensitization in hypertension

Jonathon M Willets et al. Am J Physiol Cell Physiol. .

Abstract

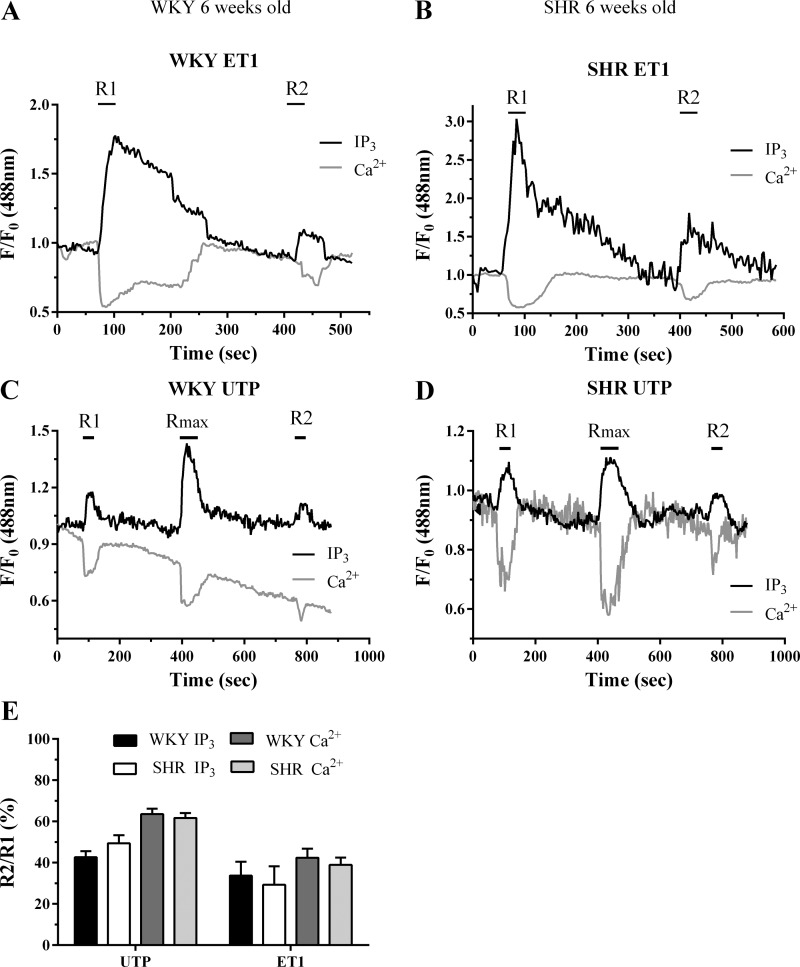
Prolonged vasoconstrictor-stimulated phospholipase C activity can induce arterial constriction, hypertension, and smooth muscle hypertrophy/hyperplasia. Arrestin proteins are recruited by agonist-occupied G protein-coupled receptors to terminate signaling and counteract changes in vascular tone. Here we determine whether the development of hypertension affects arrestin expression in resistance arteries and how such changes alter arterial contractile signaling and function. Arrestin2/3 expression was increased in mesenteric arteries of 12-wk-old spontaneously hypertensive rats (SHR) compared with normotensive Wistar-Kyoto (WKY) controls, while no differences in arrestin expression were observed between 6-wk-old SHR and WKY animals. In mesenteric artery myography experiments, high extracellular K(+)-stimulated contractions were increased in both 6- and 12-wk-old SHR animals. Concentration-response experiments for uridine 5'-triphosphate (UTP) acting through P2Y receptors displayed a leftward shift in 12-wk, but not 6-wk-old animals. Desensitization of UTP-stimulated vessel contractions was increased in 12-wk-old (but not 6-wk-old) SHR animals. Dual IP3/Ca(2+) imaging in mesenteric arterial cells showed that desensitization of UTP and endothelin-1 (ET1) responses was enhanced in 12-wk-old (but not 6-wk-old) SHR compared with WKY rats. siRNA-mediated depletion of arrestin2 for UTP and arrestin3 for ET1, reversed the desensitization of PLC signaling. In conclusion, arrestin2 and 3 expression is elevated in resistance arteries during the emergence of the early hypertensive phenotype, which underlies an enhanced ability to desensitize vasoconstrictor signaling and vessel contraction. Such regulatory changes may act to compensate for increased vasoconstrictor-induced vessel contraction.

Keywords: G protein-coupled receptor; arrestin; hypertension; phospholipase C; resistance artery; vasoconstrictor.


Figures

Fig. 1.
Fig. 1.
Increased arrestin expression in mesenteric and aortic arteries of 12-wk-old spontaneously hypertensive rats (SHR). Lysates (40 μg of protein) from the mesentery or aortae of SHR and Wistar-Kyoto (WKY) rats were subjected to SDS-PAGE separation and immunoblotting. A: representative immunoblots of mesenteric arrestin2, arrestin3, and GAPDH expression are shown from animals aged 6 or 12 wk or from cell lysates generated from SHR and WKY mesenteric smooth muscle cells (MSMC) after 7 days in culture. B: cumulative densitometric data showing means ± SE protein expression from 6-wk-old (n = 5) and 12-wk-old (n = 5) animals and 3 independent cell cultures. Statistical significance is indicated as *P < 0.05 SHR vs. WKY (unpaired t-test). C: representative immunoblots of aortic arrestin2 and arrestin3 GAPDH expression are shown from animals aged 6 or 12 wk. D: cumulative densitometric data showing means ± SE protein expression from 6-wk-old (n = 4) and 12-wk-old (n = 3) animals. AR, arrestin. Statistical significance is indicated as **P < 0.01 SHR vs. WKY (unpaired t-test).
Fig. 2.
Fig. 2.
Profile of arrestin2 and arrestin3 expression in WKY and SHR heart, bladder, and colon. Tissues were dissected free of fat and homogenized, and 40 μg of each sample were loaded onto 10% SDS-PAGE gels for separation and immunoblotting as described in materials and methods. A: representative immunoblots of arrestin2, arrestin3, and GAPDH expression in the heart, colon, and bladder of 12-wk-old WKY and SHR animals. B and C: cumulative densitometric data showing means ± SE protein expression of arrestin2 (B) and arrestin3 (C), respectively.
Fig. 3.
Fig. 3.
Comparison of contractile responses in mesenteric arteries from pre- and posthypertensive SHR and normotensive WKY rats. A: cumulative data showing third-order mesenteric arterial ring contraction (means ± SE) to K+ (60 mM) and endothelin-1 (ET1; 3 nM) for n ≥ 5 arterial preparations from at least 5 separate 6-wk-old SHR and WKY animals for each treatment. Statistical significance is indicated as *P < 0.05 SHR vs. WKY (unpaired t-test). B: concentration-dependency of UTP-stimulated contractions in SHR and WKY arteries from 6-wk-old animals (data are means ± SE for n ≥ 5 arterial preparations from at least 8 separate animals for each treatment). C: cumulative data showing the relative contractions of mesenteric arteries from 6-wk-old SHR and WKY animals (data are means ± SE for n = 7–19 arterial preparations from at least 7 separate animals for each treatment). Statistical significance is indicated as *P < 0.05 SHR vs. WKY (unpaired t-test). D: concentration-dependency of UTP-stimulated contractions in SHR and WKY arteries from 12-wk-old animals (data are means ± SE for n = 8 arterial preparations from at least 8 separate animals for each treatment). Statistical significance is indicated as *P < 0.05; **P < 0.01, SHR vs. WKY (two-way ANOVA and Bonferroni's post hoc test). E: concentration-dependency of UTP-stimulated Ca2+ signaling in MSMC prepared from 12-wk-old SHR and WKY animals. Data are means ± SE for n = 98–275 cells from at least 5 separate preparations for each animal strain. Statistical significance is indicated as **P < 0.01; ***P < 0.001, SHR vs. WKY (one-way ANOVA and Dunnett's post hoc test).
Fig. 4.
Fig. 4.
Profiling desensitization of UTP-mediated contractile responses in mesenteric arteries from pre- and posthypertensive SHR and normotensive WKY rats. Mesenteric arteries were subjected to the following desensitization protocol: 100 or 200 μM UTP (R1, for 5 min) challenge, followed by 5 min washout, prior to maximal UTP (300 or 500 μM, Rmax, 5 min) challenge, followed by a wash period of 5 min before further 100 or 200 μM UTP (R2, 5 min) exposure, for SHR or WKY vessels, respectively. Representative myograph traces are shown for arteries isolated from 6-wk-old WKY (A) and SHR (B) animals, or 12-wk-old WKY (C) or SHR (D) animals contracted with UTP. Desensitization of vessel contraction was determined as the relative change in R2 response compared with R1. Cumulative data (E) are expressed as means ± SE for the % change in R2 relative to R1; n = 7–9 vessels from ≥6 separate animals. Statistical significance is indicated as *P < 0.05 vs. WKY (unpaired t-test).
Fig. 5.
Fig. 5.
Assessment of ET1 and UTP-stimulated phospholipase C (PLC) signaling desensitization in SHR and WKY MSMC from 6-wk-old animals. MSMC were transfected with pleckstrin homology domain of PLCδ1 tagged with enhanced green fluorescent protein (eGFP-PH; 0.5 μg) before being subjected to the following desensitization protocols: For ET1, MSMC were stimulated with ET1 (50 nM, 30 s; R1); with 5 min washout before a second challenge (50 nM, 30 s; R2), while for UTP, MSMC were challenged with an ∼EC50 UTP concentration (10 μM) for 30 s before (R1) and after (R2) addition of a maximal UTP concentration (Rmax: 100 μM, for 1 min). Representative traces are shown from single cells isolated from WKY (A and C) and SHR (B and D) treated with either ET1 (A and B) or UTP (C and D). Receptor desensitization was determined as the relative change in R2 response compared with R1. Cumulative data (E) are expressed as means ± SE for the % change in R2 relative to R1; n = 7–20 cells from ≥6 separate animals. IP3, inositol 1,4,5-trisphosphate.
Fig. 6.
Fig. 6.
Assessment of ET1 and UTP-stimulated PLC signaling desensitization in SHR and WKY MSMC from 12-wk-old animals. MSMC were transfected with eGFP-PH (0.5 μg) before being subjected to the following desensitization protocols: For ET1, MSMC were stimulated with ET1 (50 nM, 30 s; R1); with 5 min washout before a second challenge (50 nM, 30 s; R2), while for UTP, MSMC were challenged with a ∼EC50 UTP concentration (10 μM) for 30 s before (R1) and after (R2) addition of a maximal UTP concentration (Rmax: 100 μM, for 1 min). Representative traces are shown from single cells isolated from WKY (A and C) and SHR (B and D) treated with either ET1 (A and B) or UTP (C and D). Receptor desensitization was determined as the relative change in R2 response compared with R1. Cumulative data (E) are expressed as means ± SE for the % change in R2 relative to R1; n = 10–18 cells from ≥4 separate animals. Statistical significance is indicated as *P < 0.05; ***P < 0.001 vs. WKY (one-way ANOVA and Dunnett's post hoc test).
Fig. 7.
Fig. 7.
Specificity of arrestin isoformic knockdown. Arterial smooth muscle cells were transfected with 10 nM negative control (NC), anti-arrestin2 or anti-arrestin3 short-interfering RNAs (siRNAs) using the nucleofection technique. After 48 h, cells were lysed and 40 μg of each sample were loaded onto 10% SDS-PAGE gels for separation and arrestin expression was determined using immunoblotting as described in materials and methods. A: representative immunoblots showing the effect of individual siRNA treatments on arrestin expression. B and C: cumulative data (means ± SE for n = 5 cell preparations from 5 separate animals from each strain) showing the degree of arrestin2 (B) and arrestin3 (C) knockdown following siRNA treatments in comparison to GAPDH expression. Statistical significance is indicated as ***P < 0.001 for arrestin2 knockdown and **P < 0.01 for arrestin3 knockdown compared with negative control transfected cells (two-way ANOVA and Tukey's post hoc test).
Fig. 8.
Fig. 8.
Knockdown of endogenous arrestin2 attenuates UTP-induced P2Y receptor desensitization. MSMC isolated from 12-wk-old animals were cotransfected with 0.5 μg eGFP-PH and 10 nM negative-control, anti-arrestin2, or anti-arrestin3 siRNAs. Cells were loaded with Fura-Red and subjected to the standard R1/Rmax/R2 desensitization protocol. Representative traces from single cells transfected with control (A and B), arrestin2 (C and D) are shown for WKY (A and C) and SHR (B and D) MSMC. Receptor desensitization was determined as the relative change in R2 response compared with R1. Cumulative data (E) are expressed as means ± SE for the % change in R2 relative to R1; n = 8–29 cells from ≥8 separate animals. Statistical significance is indicated as *P < 0.05; **P < 0.01, ***P < 0.001 vs. WKY negative-control treated cells (one-way ANOVA and Dunnett's post hoc test).
Fig. 9.
Fig. 9.
Knockdown of endogenous arrestin3 attenuates ET1-induced ETA receptor desensitization. MSMC isolated from 12-wk-old animals were cotransfected with 0.5 μg eGFP-PH and 10 nM negative-control, anti-arrestin2, or anti-arrestin3 siRNAs. Cells were loaded with Fura-Red and subjected to the standard R1/R2 desensitization protocol. Representative traces from single cells transfected with control (A and B), arrestin2 (C and D) are shown for WKY (A and C) and SHR (B and D) MSMC. Receptor desensitization was determined as the relative change in R2 response compared with R1. Cumulative data (E) are expressed as means ± SE for the % change in R2 relative to R1; n = 5–17 cells from ≥8 separate animals. Statistical significance is indicated as **P < 0.01; ***P < 0.001 vs. WKY negative-control treated cells (one-way ANOVA and Dunnett's post hoc test).

Similar articles

Cited by

References

    1. Attramadal H, Arriza JL, Aoki C, Dawson TM, Codina J, Kwatra MM, Snyder SH, Caron MG, Lefkowitz RJ. β-arrestin2, a novel member of the arrestin/β-arrestin gene family. J Biol Chem 267: 17882–17890, 1992. - PubMed
    1. Brinks HL, Eckhart AD. Regulation of GPCR signaling in hypertension. Biochim Biophys Acta 1802: 1268–1275, 2010. - PMC - PubMed
    1. Chen K, Fu C, Chen C, Liu L, Ren H, Han Y, Yang J, He D, Zhou L, Yang Z, Zhang L, Jose PA, Zeng C. Role of GRK4 in the regulation of arterial AT1 receptor in hypertension. Hypertension 63: 289–296, 2014. - PMC - PubMed
    1. Cohn HI, Harris DM, Pesant S, Pfeiffer M, Zhou RH, Koch WJ, Dorn GW 2nd, Eckhart AD. Inhibition of vascular smooth muscle G protein-coupled receptor kinase 2 enhances α1D-adrenergic receptor constriction. Am J Physiol Heart Circ Physiol 295: H1695–H1704, 2008. - PMC - PubMed
    1. DeFea KA. Arrestins in actin reorganization and cell migration. Prog Mol Biol Transl Sci 118: 205–222, 2013. - PubMed

Publication types

LinkOut - more resources