

Eliminating bovine tuberculosis in cattle and badgers: insight from a dynamic model
- PMID: 25972466
- PMCID: PMC4455805
- DOI: 10.1098/rspb.2015.0374
Eliminating bovine tuberculosis in cattle and badgers: insight from a dynamic model
Abstract
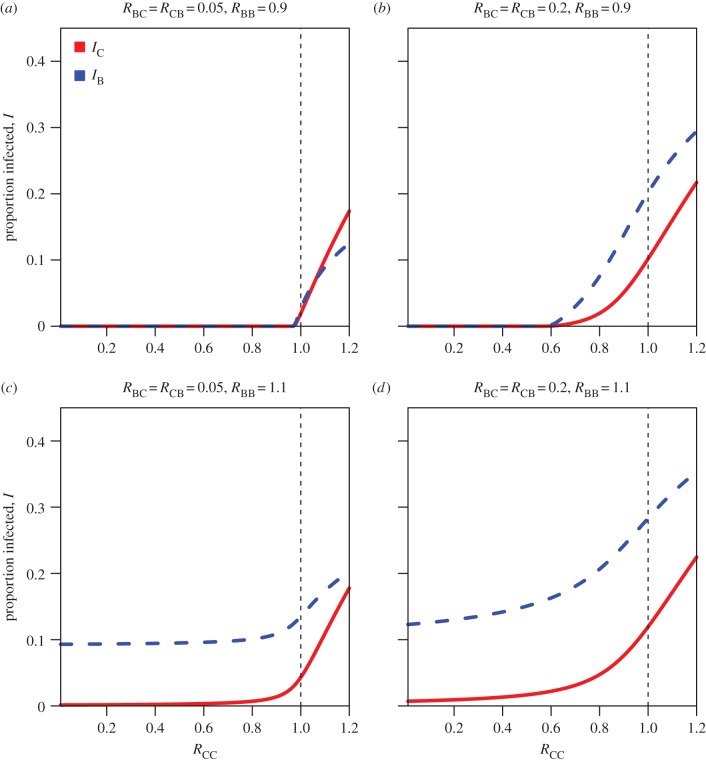
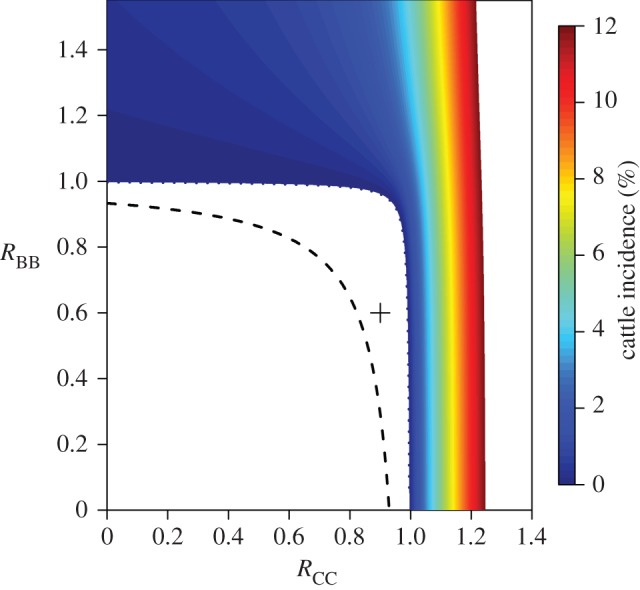
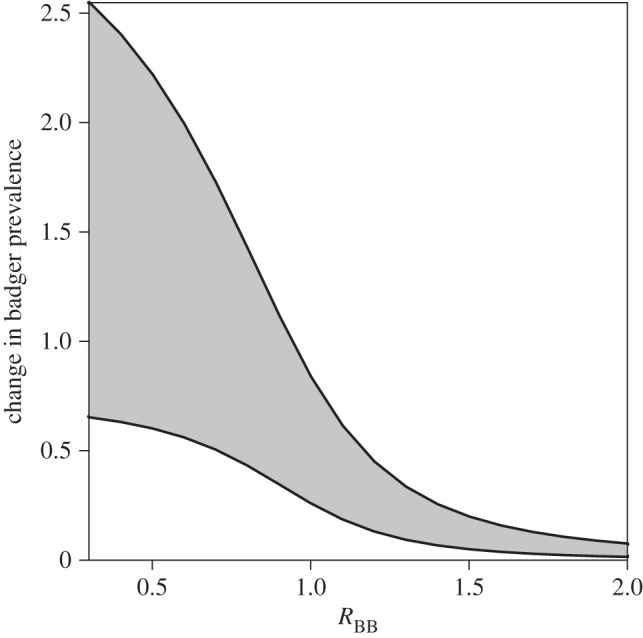
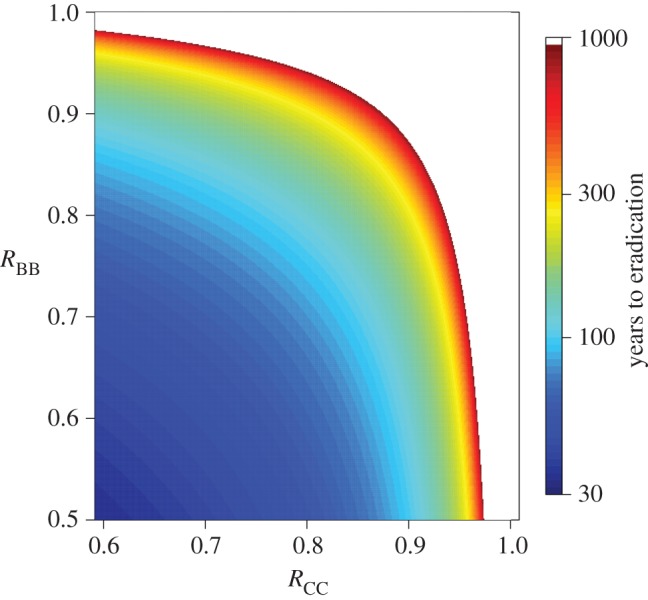
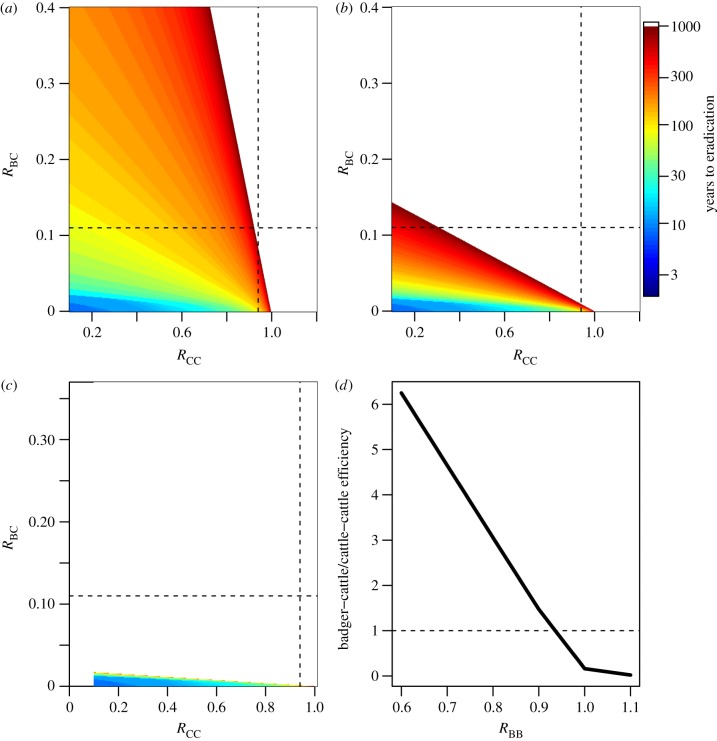
Bovine tuberculosis (BTB) is a multi-species infection that commonly affects cattle and badgers in Great Britain. Despite years of study, the impact of badgers on BTB incidence in cattle is poorly understood. Using a two-host transmission model of BTB in cattle and badgers, we find that published data and parameter estimates are most consistent with a system at the threshold of control. The most consistent explanation for data obtained from cattle and badger populations includes within-host reproduction numbers close to 1 and between-host reproduction numbers of approximately 0.05. In terms of controlling infection in cattle, reducing cattle-to-cattle transmission is essential. In some regions, even large reductions in badger prevalence can have a modest impact on cattle infection and a multi-stranded approach is necessary that also targets badger-to-cattle transmission directly. The new perspective highlighted by this two-host approach provides insight into the control of BTB in Great Britain.
Keywords: bovine tuberculosis; disease control; transmission dynamics; type reproduction numbers.
Figures
Similar articles
-
Localized reactive badger culling increases risk of bovine tuberculosis in nearby cattle herds.Biol Lett. 2012 Feb 23;8(1):50-3. doi: 10.1098/rsbl.2011.0554. Epub 2011 Jul 13. Biol Lett. 2012. PMID: 21752812 Free PMC article.
-
Can badger vaccination contribute to bovine TB control? A narrative review of the evidence.Prev Vet Med. 2025 May;238:106464. doi: 10.1016/j.prevetmed.2025.106464. Epub 2025 Feb 14. Prev Vet Med. 2025. PMID: 39983381 Review.
-
Model of Selective and Non-Selective Management of Badgers (Meles meles) to Control Bovine Tuberculosis in Badgers and Cattle.PLoS One. 2016 Nov 28;11(11):e0167206. doi: 10.1371/journal.pone.0167206. eCollection 2016. PLoS One. 2016. PMID: 27893809 Free PMC article.
-
Impact of test, vaccinate or remove protocol on home ranges and nightly movements of badgers a medium density population.Sci Rep. 2023 Feb 14;13(1):2592. doi: 10.1038/s41598-023-28620-1. Sci Rep. 2023. PMID: 36788237 Free PMC article.
-
Farm husbandry and badger behaviour: opportunities to manage badger to cattle transmission of Mycobacterium bovis?Prev Vet Med. 2010 Jan 1;93(1):2-10. doi: 10.1016/j.prevetmed.2009.09.014. Epub 2009 Oct 20. Prev Vet Med. 2010. PMID: 19846226 Review.
Cited by
-
Bovine Tuberculosis in Britain and Ireland - A Perfect Storm? the Confluence of Potential Ecological and Epidemiological Impediments to Controlling a Chronic Infectious Disease.Front Vet Sci. 2018 Jun 5;5:109. doi: 10.3389/fvets.2018.00109. eCollection 2018. Front Vet Sci. 2018. PMID: 29951489 Free PMC article.
-
Identifying genotype specific elevated-risk areas and associated herd risk factors for bovine tuberculosis spread in British cattle.Epidemics. 2018 Sep;24:34-42. doi: 10.1016/j.epidem.2018.02.004. Epub 2018 Mar 1. Epidemics. 2018. PMID: 29548927 Free PMC article.
-
Plasmodium knowlesi transmission: integrating quantitative approaches from epidemiology and ecology to understand malaria as a zoonosis.Parasitology. 2016 Apr;143(4):389-400. doi: 10.1017/S0031182015001821. Epub 2016 Jan 28. Parasitology. 2016. PMID: 26817785 Free PMC article. Review.
-
Can We Breed Cattle for Lower Bovine TB Infectivity?Front Vet Sci. 2018 Dec 7;5:310. doi: 10.3389/fvets.2018.00310. eCollection 2018. Front Vet Sci. 2018. PMID: 30581821 Free PMC article.
-
Modeling as a Decision Support Tool for Bovine TB Control Programs in Wildlife.Front Vet Sci. 2018 Nov 6;5:276. doi: 10.3389/fvets.2018.00276. eCollection 2018. Front Vet Sci. 2018. PMID: 30460248 Free PMC article. Review.
References
-
- Department for Environment Food and Rural Affairs (Defra). 2011. Bovine TB Eradication Programme for England. - PubMed
Publication types
MeSH terms
Grants and funding
LinkOut - more resources
Full Text Sources
Other Literature Sources
Molecular Biology Databases
