

doi: 10.1128/JVI.00605-15.
Epub 2015 May 13.
Hepatitis B Virus-Infected HepG2hNTCP Cells Serve as a Novel Immunological Tool To Analyze the Antiviral Efficacy of CD8+ T Cells In Vitro
Affiliations
- PMID: 25972537
- PMCID: PMC4473563
- DOI: 10.1128/JVI.00605-15
Item in Clipboard
Hepatitis B Virus-Infected HepG2hNTCP Cells Serve as a Novel Immunological Tool To Analyze the Antiviral Efficacy of CD8+ T Cells In Vitro
J Virol.
2015 Jul.
Abstract
CD8(+) T cells are the main effector lymphocytes in the control of hepatitis B virus (HBV) infection. However, limitations of model systems, such as low infection rates, restrict mechanistic studies of HBV-specific CD8(+) T cells. Here, we established a novel immunological cell culture model based on HBV-infected HepG2(hNTCP) cells that endogenously processed viral antigens and presented them to HBV-specific CD8(+) T cells. This induced cytolytic and noncytolytic CD8(+) T-cell effector functions and reduction of viral loads.
Copyright © 2015, American Society for Microbiology. All Rights Reserved.
Figures
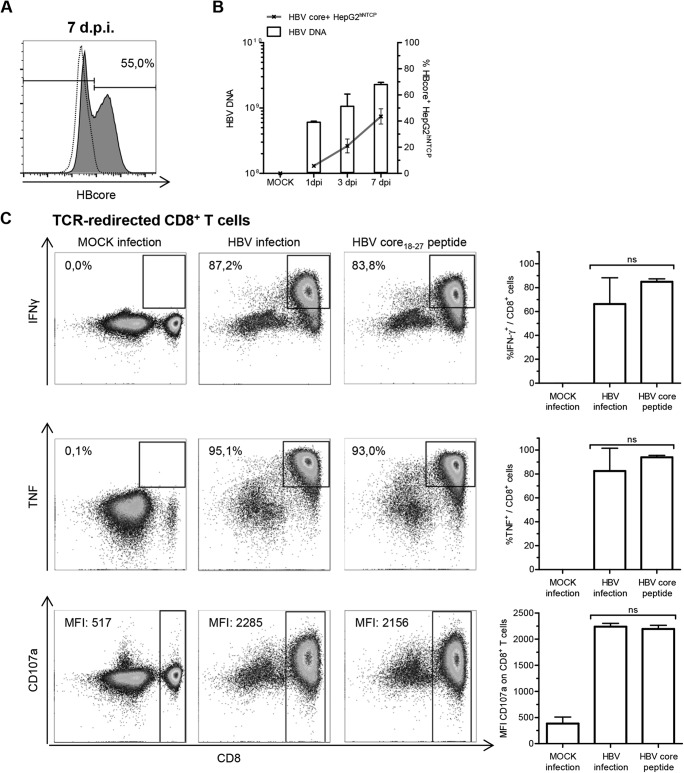
Induction of CD8+ T-cell responses through HBV-infected HepG2hNTCP cells. (A) HBV-infected HepG2hNTCP cells were analyzed for endogenous expression of HBV core antigen (clone 13A9; Thermo Fisher) by flow cytometry 7 days postinfection (dpi). The frequency of HBV core+ HepG2hNTCP cells is indicated in the representative plot. The dotted line indicates mock-infected HepG2hNTCP cells; the solid line indicates HBV-infected HepG2hNTCP cells. (B) Cytoplasmic viral loads on bulk HepG2hNTCP cells were assessed by qPCR at the indicated time points. Frequencies of HBV core+ HepG2hNTCP cells were obtained by flow cytometry (n = 3). (C) TCR-redirected CD8+ T cells specific for HBV-core18–27/HLA-A*0201 were incubated with mock-infected or HBV-infected HepG2hNTCP cells (7 dpi) or with 15 μg/ml HBV core18–27 peptide (FLPSDFFPSV) overnight. Induction of IFN-γ (clone 25723.11; BD Biosciences) and TNF (clone Mab11; BD Biosciences) production and degranulation (CD107a, clone H4A3; BD Biosciences) was analyzed by flow cytometry. (Left) Representative dot plots. Frequencies were calculated as percentages of responding CD8+ T cells in bulk CD8+ T cells. Median fluorescence intensities (MFIs) are those of CD107a on CD8+ T cells. (Right) Statistical graphs of 6 independent assays. One-way analysis of variance (ANOVA) with a subsequent Tukey post hoc test was performed for statistical analysis. Means and standard deviations (SD) are depicted. ns, not significant.
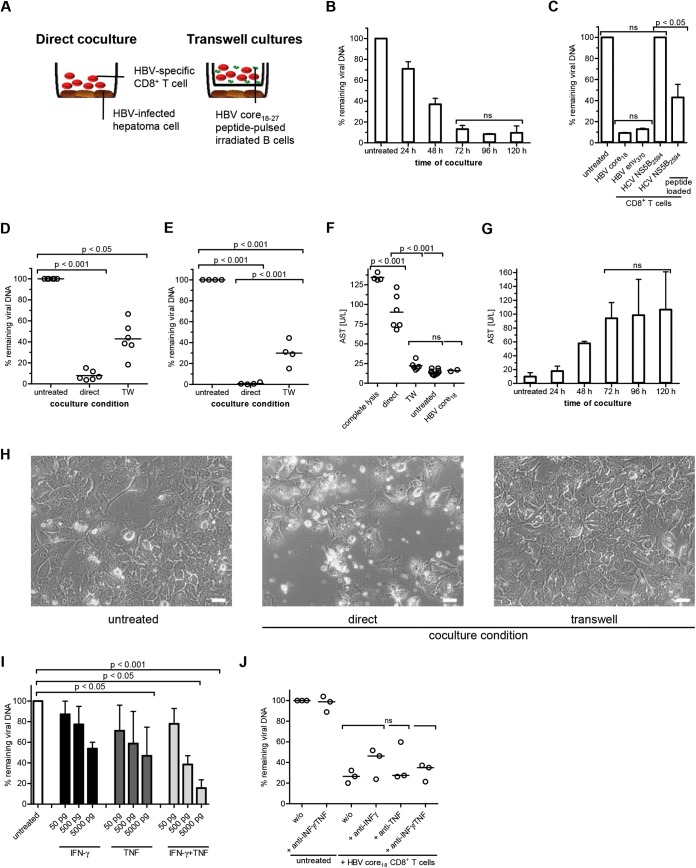
Antiviral efficacy of TCR-redirected CD8+ T cells. HBV-infected HepG2hNTCP cells (7 dpi) were cocultured with TCR-redirected CD8+ T cells specific for HBV core18–27 for 96 h unless otherwise indicated. Cytoplasmic viral loads were determined by qPCR. The amount of HBV DNA remaining was calculated relative to that in untreated samples (without CD8+ T cells). All coculture assays were performed using 250,000 HepG2hNTCP cells. The E:T ratio was 1:1. (A) Schematic experimental setup. (B) HBV DNA was determined at the indicated time points (n = 2). (C) Coculture of CD8+ T cells of indicated specificity with HBV-infected HepG2hNTCP cells. CD8+ T cells from healthy donors were transduced with HBV-specific TCRs (HBV core18–27 and HBV env370–379) (10). HCV-specific CD8+ T-cell clones were generated from patients chronically infected with HCV as described before (11). HCV NS5B2594–2602-specific CD8+ T-cell clones were tested against HBV-infected HepG2hNTCP cells labeled with the corresponding HCV peptide prior to coculture in order to control functionality (n = 2). (D and E) Coculture of TCR-redirected CD8+ T cells specific for HBV core18–27 under direct and indirect (Transwell [TW]) coculture conditions (n = 6) using HBV-infected HepG2hNTCP cells (D) or tetracycline-regulated HBV-producing HepG2.117 cells (E) (n = 4). (F) Comparison of AST levels obtained from 6 infectious coculture assays versus complete lysis using lysis buffer. (G) AST levels corresponding to the viral loads in panel B were determined after coculture with HBV core18–27-specific TCR-redirected CD8+ T cells at the indicated time points. (H) Bright-field microscopic analyses of HBV-infected HepG2hNTCP cells and TCR-redirected CD8+ T cells specific for HBV core18–27 after 96 h coculture. Magnification, ×20; bars, 50 μm. (I) Antiviral efficacy of exogenous recombinant cytokines IFN-γ and TNF (R&D Systems) (n = 3). (J) Cytokine activity of IFN-γ and TNF was blocked by adding neutralizing monoclonal antibodies (MAb) against cytokines (10 μg/ml; anti-human IFN-γ MAb, clone 25723 [R&D Systems]; anti-human TNF MAb, clone 28401 [R&D Systems]) in combination with blocking MAb against cytokine receptors (10 μg/ml; anti-human IFN-γR1/CD119 MAb, clone GIR208 [R&D Systems]; anti-human TNFR1/TNFRSF1A, clone 18605 [R&D Systems]) (n = 3). One-way ANOVA with a subsequent Tukey post hoc test was performed for statistical analysis. ns, not significant. Individual values and means with SD are depicted.
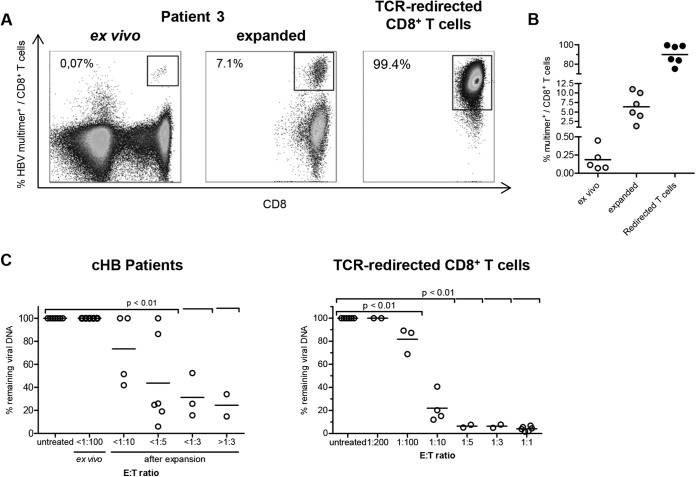
Antiviral efficacy of HBV-specific CD8+ T cells from patients chronically infected with HBV. (A) Frequencies of TCR-redirected CD8+ T cells specific for HBV core18–27 and of patient-derived HLA-A*02-restricted HBV-specific CD8+ T cells were determined by multimer staining. Stainings of patient samples were performed directly ex vivo and after 14 days of peptide expansion. Frequencies of multimer-positive CD8+ T cells in bulk CD8+ T cells are indicated in representative dot plots. (B) Statistical graph of HBV multimer-positive CD8+ T cells of total CD8+ T cells ex vivo, expanded CD8+ T cells, and HBV core18–27-specific TCR-redirected CD8+ T cells. (C) (Left) CD8+ T cells of 7 patients with chronic HBV infection (cHB) were magnetically isolated by CD8 MicroBeads (Miltenyi Biotec) and subsequently cocultivated with 100,000 HBV-infected HepG2hNTCP cells (7 dpi) at the indicated E:T ratios for 96 h. (Right) E:T ratios of cocultures with patient-derived CD8+ T cells were recapitulated by titration of TCR-redirected CD8+ T cells specific for HBV core18–27. One-way ANOVA with a subsequent Tukey post hoc test was performed for statistical analysis. Individual values and means are depicted.
References
Publication types
MeSH terms
LinkOut - more resources
Full Text Sources
Other Literature Sources
Research Materials
