. 2015 Aug;64(8):2780-90.
doi: 10.2337/db14-1772. Epub 2015 May 13.

Forced Hepatic Overexpression of CEACAM1 Curtails Diet-Induced Insulin Resistance

Affiliations

Forced Hepatic Overexpression of CEACAM1 Curtails Diet-Induced Insulin Resistance

Qusai Y Al-Share et al. Diabetes. 2015 Aug.

Abstract

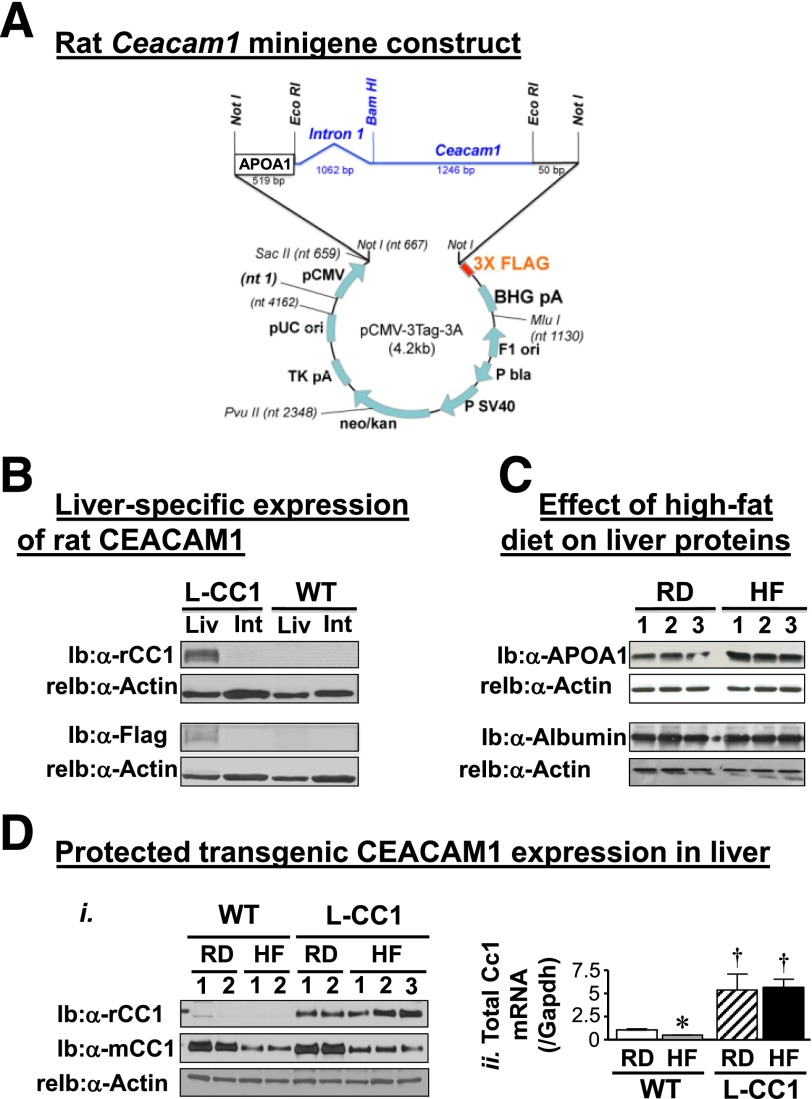
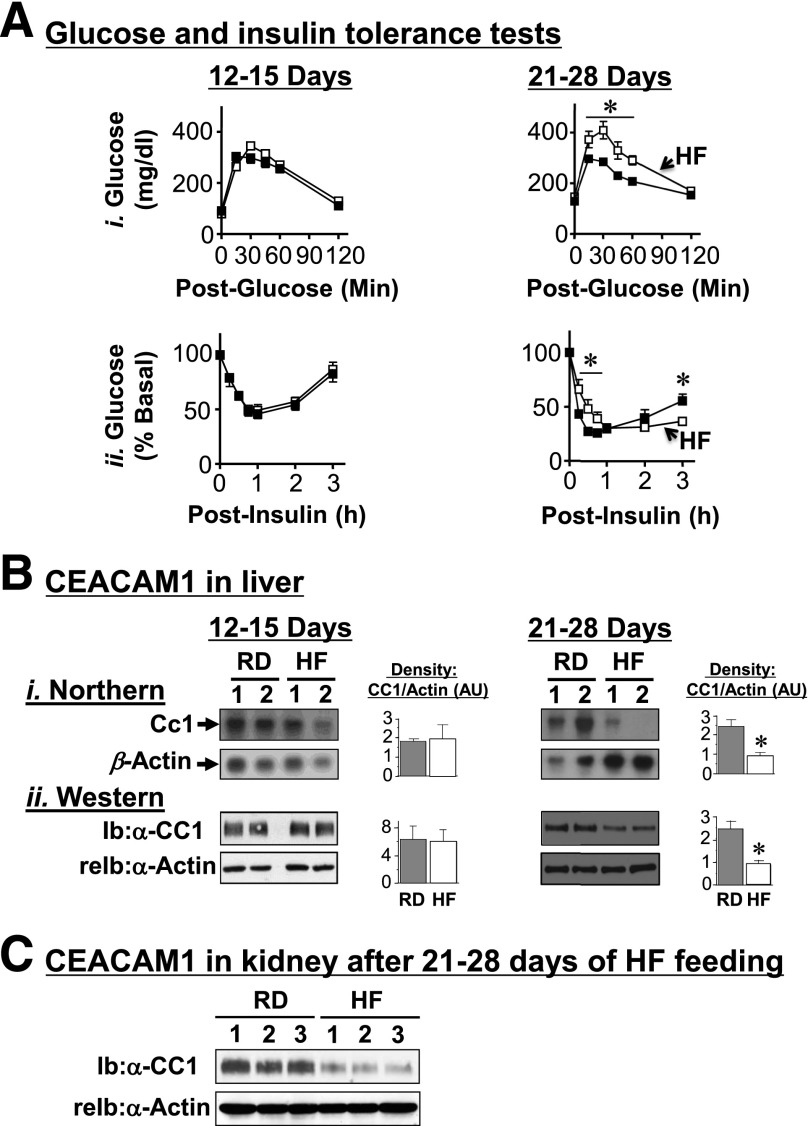
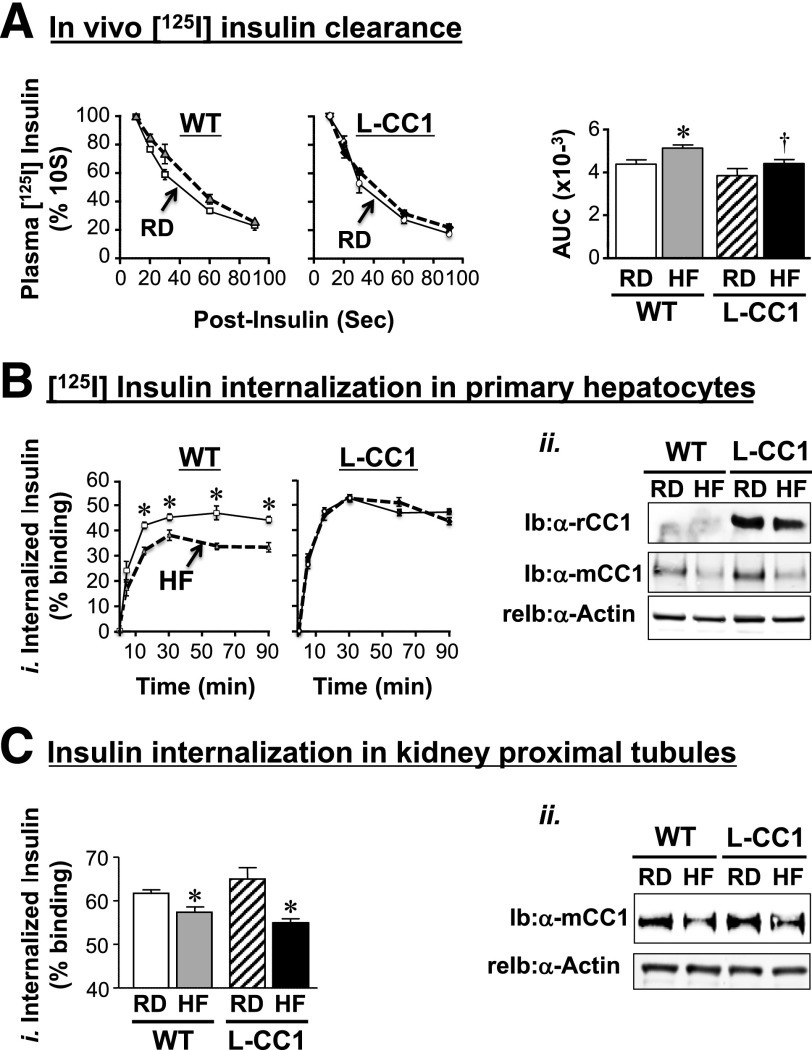
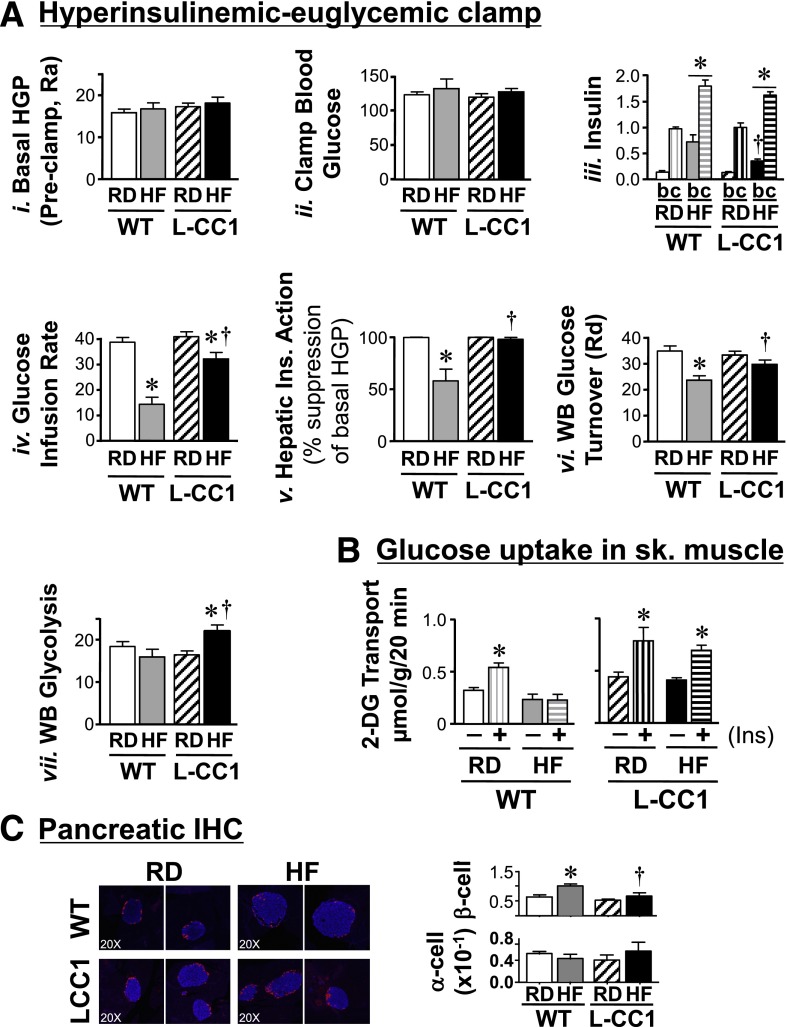
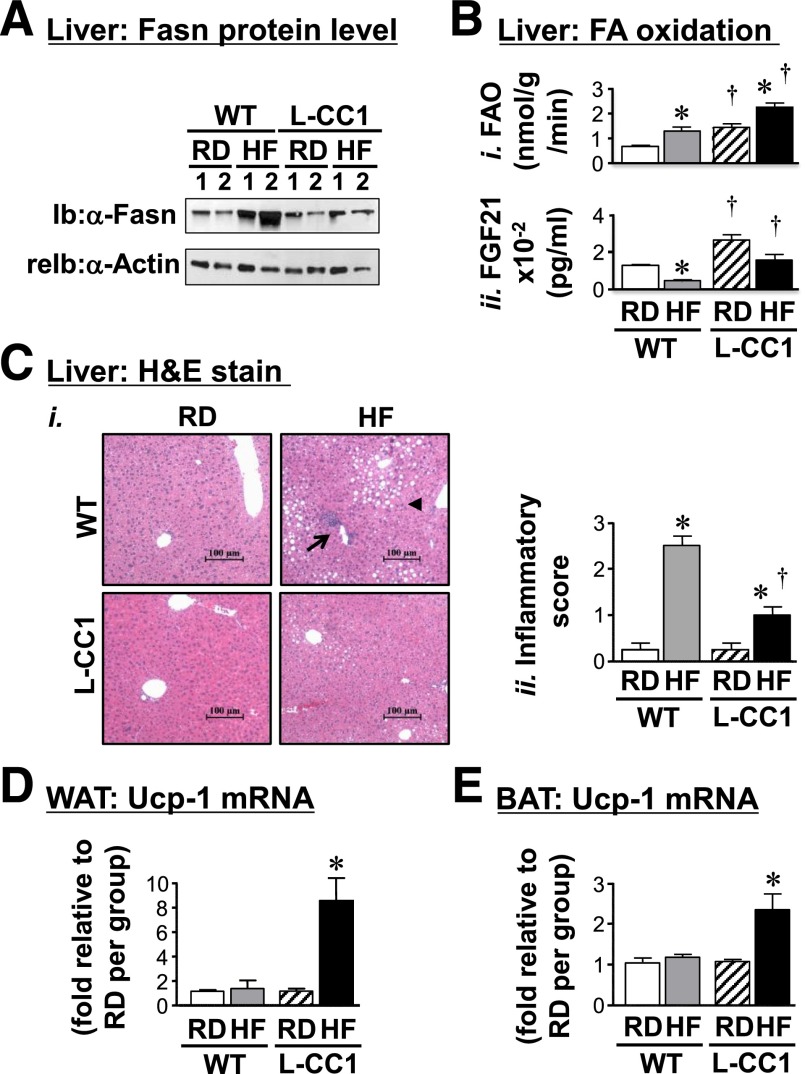
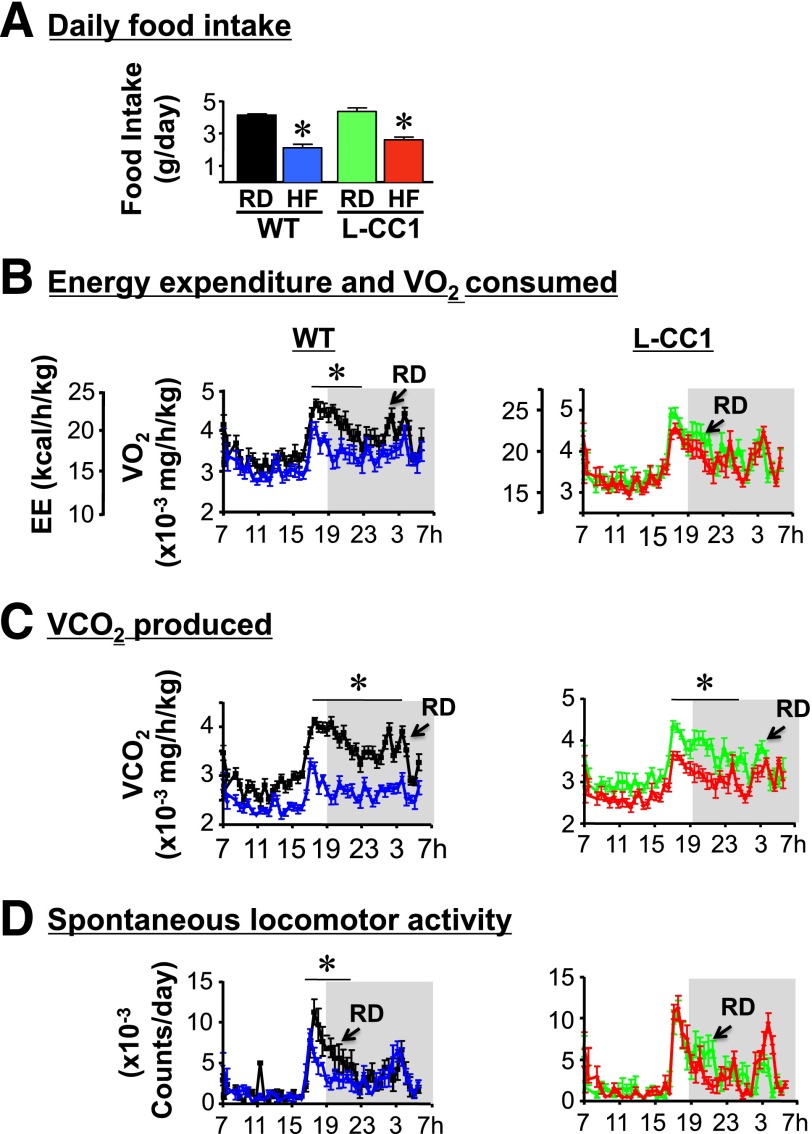
Carcinoembryonic antigen-related cell adhesion molecule 1 (CEACAM1) regulates insulin sensitivity by promoting hepatic insulin clearance. Liver-specific inactivation or global null-mutation of Ceacam1 impairs hepatic insulin extraction to cause chronic hyperinsulinemia, resulting in insulin resistance and visceral obesity. In this study we investigated whether diet-induced insulin resistance implicates changes in hepatic CEACAM1. We report that feeding C57/BL6J mice a high-fat diet reduced hepatic CEACAM1 levels by >50% beginning at 21 days, causing hyperinsulinemia, insulin resistance, and elevation in hepatic triacylglycerol content. Conversely, liver-specific inducible CEACAM1 expression prevented hyperinsulinemia and markedly limited insulin resistance and hepatic lipid accumulation that were induced by prolonged high-fat intake. This was partly mediated by increased hepatic β-fatty acid oxidation and energy expenditure. The data demonstrate that the high-fat diet reduced hepatic CEACAM1 expression and that overexpressing CEACAM1 in liver curtailed diet-induced metabolic abnormalities by protecting hepatic insulin clearance.


Figures

Figure 1
Figure 1
Generation of L-CC1 transgenic mice with liver-specific overexpression of CEACAM1. A: L-CC1 transgenic mice overexpressing FLAG-tagged WT rat CEACAM1 in the liver were generated using the human APOA1 promoter/enhancer element. The “minigene” construct was obtained by subcloning 519 nucleotides of proximal APOA1 promoter 5′ of a Ceacam1 rat minigene containing intron 1, subcloned into plasmid cytomegalovirus (pCMV)-3Tag-3A plasmid at Not1 site to encode a FLAG-tagged rat CEACAM1 protein. B: Liver (Liv) and intestinal (Int) lysates were analyzed by immunoblotting (Ib) with polyclonal antibodies against rat CEACAM1 (α-rCC1) and FLAG (α-FLAG), followed by reprobing (reIb) with α-actin antibody for protein normalization. Gels represent more than two experiments on more than three mice per genotype. C: Western analysis of liver proteins from WT mice fed the RD or HF diet for 30 days with α-APOA1 and albumin polyclonal antibodies (n = 3 per group). Data indicate induced expression of APOA1, but not albumin, by the HF diet. Gels represent more than two experiments on two different sets of mice. Di: WT and L-CC1 mice were fed the HF or RD for 4 months before liver lysates were analyzed by Western blotting using antibodies against rat (rCC1) and mouse (mCC1) proteins, followed by α-actin for normalization. Dii: Liver lysates were also analyzed by quantitative RT-PCR to determine mRNA of Ceacam1 using primers common to both rat and mouse genes (total Ceacam1) and normalized to GAPDH. *P < 0.05 HF vs. RD per genotype. †P < 0.05 L-CC1 vs. WT per same feeding group.
Figure 2
Figure 2
Effect of HF diet on insulin and glucose tolerance and on CEACAM1 protein levels. A: BL6 mice (2 months old) were fed an RD (■) or an HF diet (□) for 12–28 days before they were challenged with an intraperitoneal injection of glucose (1.5 g/kg BW) (i) or insulin (0.75 units/kg body weight) (ii) to assess blood glucose levels at 0–180 min postinjection. *P < 0.05 HF vs. RD (n > 6 per feeding group). B: Liver lysates were subjected to Northern (i) and Western (ii) analyses and reprobing with β-actin cDNA and α-actin antibody, respectively, for normalization (n > 6 mice per feeding group). Bands were scanned, and the density was measured with arbitrary units (AU) and represented in the right-hand graphs. The numbers above the gel denote different mice. *P < 0.05 vs. RD. C: Kidney lysates from three mice per feeding group were subjected to sequential Ib with α-mouse CEACAM1 antibody, followed by reprobing (reIb) with α-actin antibody for normalization.
Figure 3
Figure 3
Effect of HF diet on insulin clearance. A: Metabolic clearance of 125I-insulin injected in the tail vein was measured in 4-month-old mice (n = 8 mice per feeding group per genotype) fed the HF diet (dashed lines) or the RD (solid lines) for 1 month. Blood 125I-insulin was counted after 10–90 s postinjection. Values are expressed as mean ± SEM of percent of the amount of blood insulin at 10 s. AUC of the decrease in plasma insulin with postinjection time was calculated and is presented in the accompanying bar graph. Bi: 125I-insulin internalization in primary hepatocytes derived from mice fed an HF (dashed lines) or RD (solid lines) for 4 months was measured. After binding, 125I-insulin was allowed to internalize at 37°C for 0–90 min (horizontal axis). Internalized ligand was plotted on the vertical axis as percent of the specifically bound ligand. Values are expressed as mean ± SD from triplicate experiments performed on more than three mice per feeding group per genotype. Bii: Western blot analysis of lysates of primary hepatocytes to analyze the amount of rat (rCC1) and mouse (mCC1) CEACAM1 normalized to actin. Ci: Primary proximal tubule cells were isolated from at least eight mice per feeding group per genotype, mixed, and subjected to 125I-insulin internalization. The experiment was repeated three times. Cii: Some aliquots of isolated cells were lysed and analyzed by Western blot to assess CEACAM1 level normalized to actin. A representative gel of more than two experiments is shown. A–C: Values are expressed as mean ± SEM. *P < 0.05 HF vs. RD per genotype. †P < 0.05 L-CC1 vs. WT per same feeding group.
Figure 4
Figure 4
Insulin action in response to prolonged HF diet. A: Overnight-fasted, awake 6-month-old mice fed the RD or HF diet for 4 months (n ≥ 8 per feeding group per genotype) were subjected to a 2-h hyperinsulinemic-euglycemic clamp. Values are expressed as mean ± SEM in mg/dL for hepatic glucose production (HGP) levels (Ra, rate of appearance), in ng/mL for insulin, and in mg/min/kg for all other measurements. Rd, rate of disposal. *P < 0.05 HF vs. RD per genotype. †P < 0.05 L-CC1 vs. WT per feeding group. All clamp (c) insulin values were significantly higher than basal (b) per the same mouse group regardless of the diet, but for simplicity, the symbol is not shown. B: Uptake of 2-deoxyglucose (2-DG) in the absence (−) or presence (+) of insulin was measured in soleus muscle isolated from mice fed an HF diet for 6 months. Values are expressed as mean ± SEM. *P < 0.05 vs. no insulin. C: Pancreas sections from mice fed an HF diet for 4 months were fixed and immunostained with antibodies against insulin (blue) and glucagon (red). β-Cell and α-cell areas were estimated by morphometric analysis of 30–40 islets from each mouse group. Values are expressed as mean ± SEM in arbitrary units and presented in the graph. Photomicrographs are shown at original magnification ×20. *P < 0.05 HF diet vs. RD per genotype. †P < 0.05 L-CC1 vs. WT per feeding group.
Figure 5
Figure 5
Effect of prolonged HF diet on lipid metabolism in liver. A: Liver lysates were subjected to Western analysis with α-Fasn, followed by α-actin antibody for normalization. Gel represents two mice per each feeding group. Experiments were repeated twice. B: Hepatic FAO (i) and plasma FGF21 (ii) levels were determined in mice fed the RD or HF diet per mouse group (n > 6 per feeding group per genotype). Experiments were repeated at least three times. Values are expressed as mean ± SEM. *P < 0.05 HF vs. RD per genotype. †P < 0.05 L-CC1 vs. WT per feeding group. Ci: Liver histology was assessed in hematoxylin and eosin stained sections (n > 4 mice per feeding group per genotype). In WT, HF feeding caused predominantly microvesicular lipid infiltration (arrowhead) alternating with normal liver parenchyma. It also caused portal mononuclear inflammatory cell foci (arrow) in WT but not in L-CC1 mice, in which neither lipid nor inflammatory infiltration was almost absent. Representative images from three sections per mouse are shown. Cii: Inflammatory islands from mice were counted in four sections per mouse, scored on a scale of 0–3, and plotted. Values are expressed as mean ± SEM. *P < 0.05 HF vs. RD per genotype. †P < 0.05 L-CC1 vs. WT per feeding group. WAT (D) and BAT (E) were lysed and mRNA levels analyzed in duplicates (n > 5 mice per feeding group per genotype). Values are expressed as mean ± SEM. *P < 0.05 HF vs. RD per genotype.
Figure 6
Figure 6
Indirect calorimetry analysis. WT (left) and L-CC1 mice (right) were fed RD (black or green) or HF diet (blue or red) for 4 months before being individually caged (n = 4 per feeding group per genotype), given free access to food, and subjected to indirect calorimetry analysis in a 24-h period for 5 days to measure daily food intake (A), heat production (energy expenditure [EE]) (kcal/h/kg lean mass) and VO2 consumption (mg/h/kg lean mass) (B), VCO2 production (mg/h/kg lean mass) (C), and spontaneous locomotor activity (counts/day) (D). Values are expressed as mean ± SEM of each time interval in the last 3 days. *P < 0.05 HF-fed vs. RD-fed per mouse group.

Similar articles

Cited by

References

    1. Dankner R, Chetrit A, Shanik MH, Raz I, Roth J. Basal-state hyperinsulinemia in healthy normoglycemic adults is predictive of type 2 diabetes over a 24-year follow-up: a preliminary report. Diabetes Care 2009;32:1464–1466 - PMC - PubMed
    1. Pories WJ, Dohm GL. Diabetes: have we got it all wrong? Hyperinsulinism as the culprit: surgery provides the evidence. Diabetes Care 2012;35:2438–2442 - PMC - PubMed
    1. Corkey BE. Banting lecture 2011: hyperinsulinemia: cause or consequence? Diabetes 2012;61:4–13 - PMC - PubMed
    1. Svedberg J, Björntorp P, Smith U, Lönnroth P. Free-fatty acid inhibition of insulin binding, degradation, and action in isolated rat hepatocytes. Diabetes 1990;39:570–574 - PubMed
    1. Osborne TF. Sterol regulatory element-binding proteins (SREBPs): key regulators of nutritional homeostasis and insulin action. J Biol Chem 2000;275:32379–32382 - PubMed

Publication types