. 2015 Jul;114(1):332-40.
doi: 10.1152/jn.00170.2015. Epub 2015 May 13.

Graded boosting of synaptic signals by low-threshold voltage-activated calcium conductance

Affiliations

Graded boosting of synaptic signals by low-threshold voltage-activated calcium conductance

Martín Carbó Tano et al. J Neurophysiol. 2015 Jul.

Abstract

Low-threshold voltage-activated calcium conductances (LT-VACCs) play a substantial role in shaping the electrophysiological attributes of neurites. We have investigated how these conductances affect synaptic integration in a premotor nonspiking (NS) neuron of the leech nervous system. These cells exhibit an extensive neuritic tree, do not fire Na(+)-dependent spikes, but express an LT-VACC that was sensitive to 250 μM Ni(2+) and 100 μM NNC 55-0396 (NNC). NS neurons responded to excitation of mechanosensory pressure neurons with depolarizing responses for which amplitude was a linear function of the presynaptic firing frequency. NNC decreased these synaptic responses and abolished the concomitant widespread Ca(2+) signals. Coherent with the interpretation that the LT-VACC amplified signals at the postsynaptic level, this conductance also amplified the responses of NS neurons to direct injection of sinusoidal current. Synaptic amplification thus is achieved via a positive feedback in which depolarizing signals activate an LT-VACC that, in turn, boosts these signals. The wide distribution of LT-VACC could support the active propagation of depolarizing signals, turning the complex NS neuritic tree into a relatively compact electrical compartment.

Keywords: calcium conductance; dendritic integration; nonspiking; synaptic amplification; window current.


Figures

Fig. 1.
Fig. 1.
Pharmacological profile of the low-threshold calcium spike. A: representative responses of a nonspiking (NS) neuron to the injection of −8-nA current pulses (2 s) in normal saline and after 10-min perfusion with a solution containing 300 μM amiloride. In this and the rest of the figures, the number on the left of the traces indicates the baseline membrane potential. Bi: as in A, before and after 10 min in 250 μM Ni2+ and after 20-min washout in normal saline. Bii: the gray and green bars show the mean rebound response amplitude before and after 10-min perfusion with 250 μM Ni2+, respectively [n = 8; paired t-test: t(1) = 17.6, **P < 0.001]. ΔVmNS, change in the membrane potential of the NS neurons. Biii: representative responses of a Retzius (Rz) cell to intracellular stimulation of pressure-sensitive (P) cells in normal saline and after 10-min perfusion with 250 μM Ni2+. P cells fired a train of 6 action potentials at 20 Hz in both conditions. Im, square current pulse. Ci: as in Bi, before and after 20 min in 100 μM NNC 55-0396 (NNC). Cii: as in Bii, for NNC. The gray and blue bars show the rebound amplitude before and after 20-min perfusion with NNC, respectively [n = 8; paired t-test: t(1) = 17.6, **P < 0.001]. Ciii: average peak amplitude of the rebound response to successive 2-s hyperpolarizing current pulses of increasing amplitude (−1 to −10 nA) in normal saline and in NNC [n = 5; 2-way ANOVA: F(1,9) = 2.1, P < 0.05, and Tukey honestly significant difference (HSD): **P < 0.001 and *P < 0.05]. Civ: as in Biii but for 100 μM NNC.
Fig. 2.
Fig. 2.
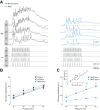
The low-threshold voltage-activated calcium conductance (LT-VACC) amplifies the synaptic responses of NS neurons. A: representative synaptic responses of an NS neuron to stimulation of a P cell with trains of suprathreshold pulses at different frequencies (indicated on the left). The recordings were performed in normal saline (left) and after 20-min perfusion with a solution containing 100 μM NNC (right). B: mean amplitude of NS responses as function of the P cell stimulation frequency in 3 control conditions: in normal saline at time 0 (N-0min; n = 5) and after 20-min perfusion in this solution (N-20min; n = 5) and before perfusion with NNC (NNC-0min; n = 5). Lines represent the linear regression of each group: solid black line for N-0min (slope 0.7, r2 = 0.954, P < 0.001); black dashed line for N-20min (slope 0.8, r2 = 0.99, P < 0.001); and solid blue line for NNC-0min (slope 0.81, r2 = 0.99, P < 0.01). C: as in B but comparing the response of NS neurons before and after 20-min perfusion with 100 μM NNC [NNC-20min; n = 5; 2-way ANOVA, NNC-0min vs. NNC-20min: F(1,32) = 3.75, P < 0.05, and Tukey HSD: **P < 0.001 and *P < 0.05]. The blue dashed line represents the linear regression of NNC-20min (slope 0.34, r2 = 0.92, P < 0.001). The inset shows the relationship between the responses of NNC-0min and NNC-20min. The line represents the linear regression (slope 1.49, r2 = 0.72, P < 0.001).
Fig. 3.
Fig. 3.
Calcium transients evoked by synaptic signals are blocked by NNC. A: projected confocal z-scan of a midbody ganglion where 1 NS neuron was filled with rhodamine dextran (3 kDa). The anterior-posterior (A – P) direction is indicated. The image is formed by the superposition of 15 focal planes taken at 1-μm intervals. B: confocal plane of a midbody ganglion where 1 NS neuron was filled with Oregon Green 488 BAPTA-1 (OG-1). The image was taken at 600 ms from the onset of P cell stimulation (1-s spike train at 20 Hz). The fluorescence change is expressed in a color-code scale indicated to the right. Four regions of interest (ROIs) are enclosed in white line boxes. Ci: electrophysiological recordings of NS and P cells in normal saline and NNC as the sensory neurons were stimulated as stated above. The insets show expanded views of the segments enclosed in the gray boxes. Cii: ΔF/F signals evoked by the signals shown in Ci in each ROI in normal saline (N) and after perfusion with a solution containing NNC. D: time integral of the electrophysiological response of the NS cell to P stimulation in normal saline and NNC. Each dot corresponds to 1 cell [n = 5; paired t-test, t(4) = 3.9, *P < 0.05]. E: time integral of the ΔF/F. The 4 ROIs of each cell (identified by the hues on the right) for each of the cells measured in D [n = 25; paired t-test, t(15) = 5.6, **P < 0.001].
Fig. 4.
Fig. 4.
Blocking LT-VACC had a pronounced effect on NS responses to dynamic stimulation. A: representative responses of an NS neuron to the injection of a 2-nA sinusoidal current injection at 30 Hz in normal saline and after 10-min perfusion with NNC. The experiments were performed in discontinuous current clamp (DCC) mode. Bi: the bars indicate the average amplitude of the 1st and last cycle in normal saline and in NNC [n = 7; 2-way ANOVA, F(1,12) = 4.2, P < 0.05; Tukey HSD, *P < 0.05 for the comparison between responses in normal saline and in NNC and #P < 0.05 for the comparison between the 1st and last cycle in normal saline]. Bii: the plot shows the relative amplitude of the 1st cycle after NNC [ΔVmNNCVmcontrol] as a function of the peak VmNS achieved in normal saline. C: as in A but for the injection of −2-nA sinusoidal sweeps. D: as in Bi for negative sinusoidal current injection in normal saline and in NNC [n = 7; 2-way ANOVA, F(1,8) = 4.1, P = 0.07]. E: magnitude of the voltage tail measured for positive and negative sinusoidal stimuli in normal saline and in NNC. The inset indicates how these measurements were made: the traces (those shown in A) were normalized to the amplitude of the last cycle, and the voltage tail was measured as the time integral for 200 ms from the peak of the last cycle [n = 7 for positive and n = 7 negative current, 2-way ANOVA, F(1,10) = 9.7, P < 0.01; Tukey HSD, **P < 0.001 for the comparison between responses in normal saline and in NNC; ##P < 0.001 for the comparison between responses to positive and negative stimulation in normal saline].
Fig. 5.
Fig. 5.
The LT-VACC supports the propagation of signals between NS neurons. In these experiments, simultaneous recordings from pairs of NS neurons within a ganglion were performed. A: representative responses of an NS neuron (NS-1) to the injection of a series of square current pulses (Im; 0 to −3 nA at 1-nA intervals) in NS-1 while the membrane potential of the contralateral NS neuron (NS-2) was recorded. NS-1 was recorded in DCC mode. B: plot of the amplitude of the NS-2 responses as a function of the amplitude of the NS-1 responses. The line presents a linear fit [n = 4; r2 = 0.82, F(1,26) = 121, P < 0.05]. The coupling coefficient (CC) is calculated from the slope of this line (CC = 0.23). The responses to the different current amplitudes are coded in the hues above the graph. C: rebound responses of NS-1 (black thin trace) and NS-2 (gray thick trace) to hyperpolarizing current pulses injected in NS-1 (−1, −6, and −10 nA for bottom, middle, and top traces, respectively). Notice that the responses of both cells superpose so well that they cannot be distinguished from each other. D: average cross-correlogram (full line) of 6 different pairs of response traces of NS-1 and NS-2 to −8-nA current pulses injected to NS-1. The gray shade represents the 95% confidence interval for the mean cross-correlation index. The dashed lines show each individual cross-correlogram. E: relationship between the maximal amplitude recorded in NS-2 over the maximal amplitude recorded in NS-1 in a 1-s period after the end of the current pulses as a function of the current amplitude (−1 to −10 nA; n = 10). F: representative responses of NS-1 and NS-2 to the injection of a 2-nA sinusoidal current injection at 30 Hz in NS-1 in normal saline and after 10-min perfusion with NNC. G: the bars indicate the electrical coupling (E.C) between the NS neurons in normal saline and in NNC measured as the ratio of the time integrals (b/a; see top inset) of a −1-nA square pulse injected to NS-1 [n = 4; paired t-test, t(3) = 0.92, P = 0.42]. H: the bars indicate the effective coupling between the NS neurons in normal saline and in NNC measured as the ratio of the time integrals [n = 4; paired t-test, t(3.7) = 7.1, **P < 0.001]. I: the bars indicate the magnitude of the voltage tails in NS-1 and NS-2 in both conditions [n = 4; 2-way ANOVA, F(1,12) = 17.8, P < 0.01; Tukey HSD, *P < 0.05] measured as indicated in Fig. 4E.

Similar articles

Cited by

References

    1. Anderson TM, Abbinanti MD, Peck JH, Gilmour M, Brownstone RM, Masino MA. Low-threshold calcium currents contribute to locomotor-like activity in neonatal mice. J Neurophysiol 107: 103–113, 2012. - PMC - PubMed
    1. Arbas EA, Calabrese RL. Ionic conductances underlying the activity of interneurons that control heartbeat in the medicinal leech. J Neurosci 7: 3945–3952, 1987. - PMC - PubMed
    1. Bal T, McCormick DA. Mechanisms of oscillatory activity in guinea-pig nucleus reticularis thalami in vitro: a mammalian pacemaker. J Physiol 468: 669–691, 1993. - PMC - PubMed
    1. Crandall SR, Govindaiah G, Cox CL. Low-threshold Ca2+ current amplifies distal dendritic signaling in thalamic reticular neurons. J Neurosci 30: 15419–15429, 2010. - PMC - PubMed
    1. Crunelli V, Toth TI, Cope DW, Blethyn K, Hughes SW. The ‘window’ T-type calcium current in brain dynamics of different behavioural states. J Physiol 562: 121–129, 2005. - PMC - PubMed

Publication types

LinkOut - more resources