. 2015 Jul;114(1):624-37.
doi: 10.1152/jn.00304.2015. Epub 2015 May 13.

Properties of precise firing synchrony between synaptically coupled cortical interneurons depend on their mode of coupling

Affiliations

Properties of precise firing synchrony between synaptically coupled cortical interneurons depend on their mode of coupling

Hang Hu et al. J Neurophysiol. 2015 Jul.

Abstract

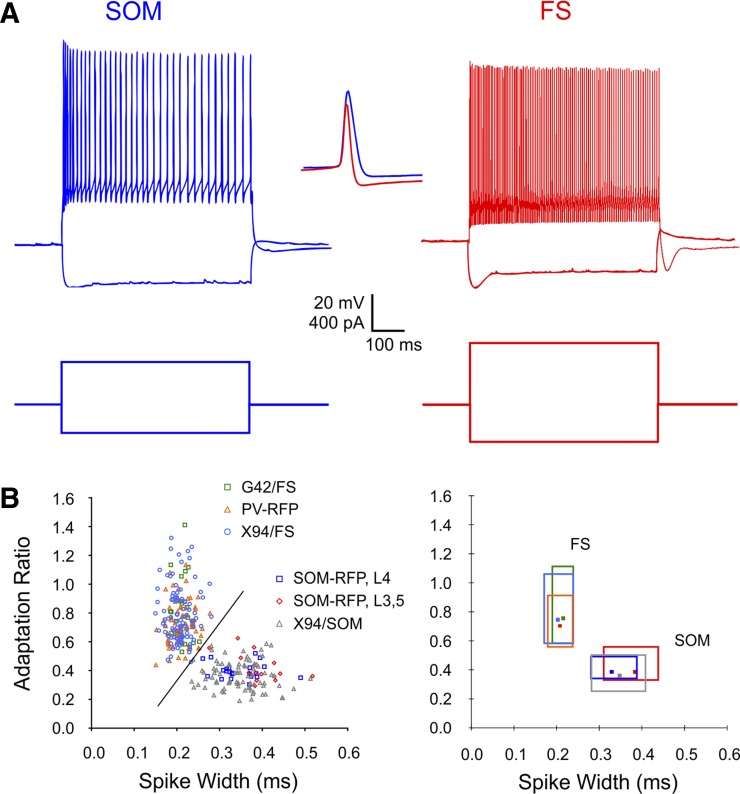
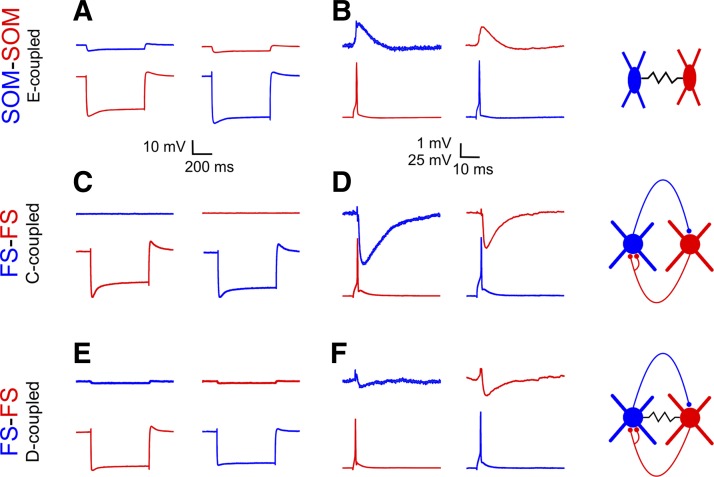
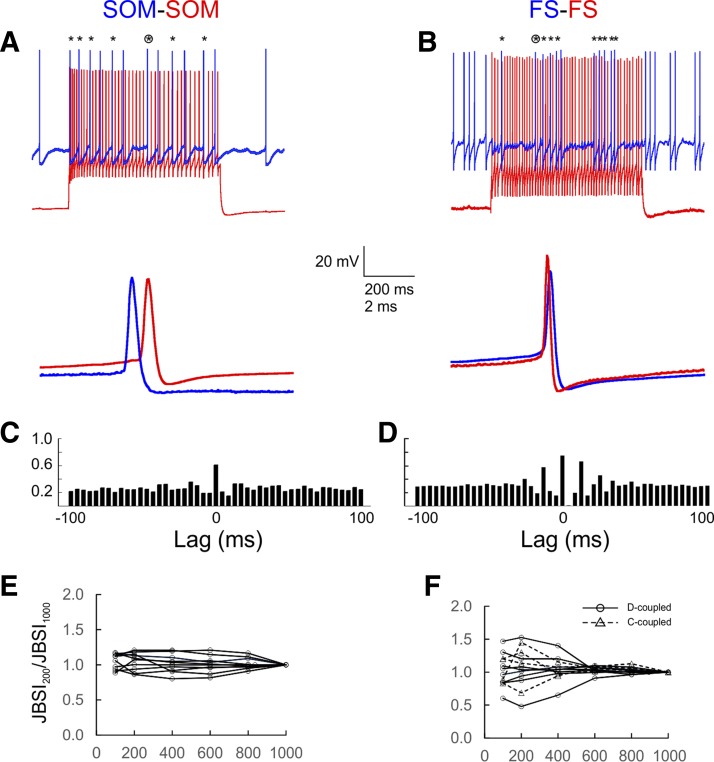
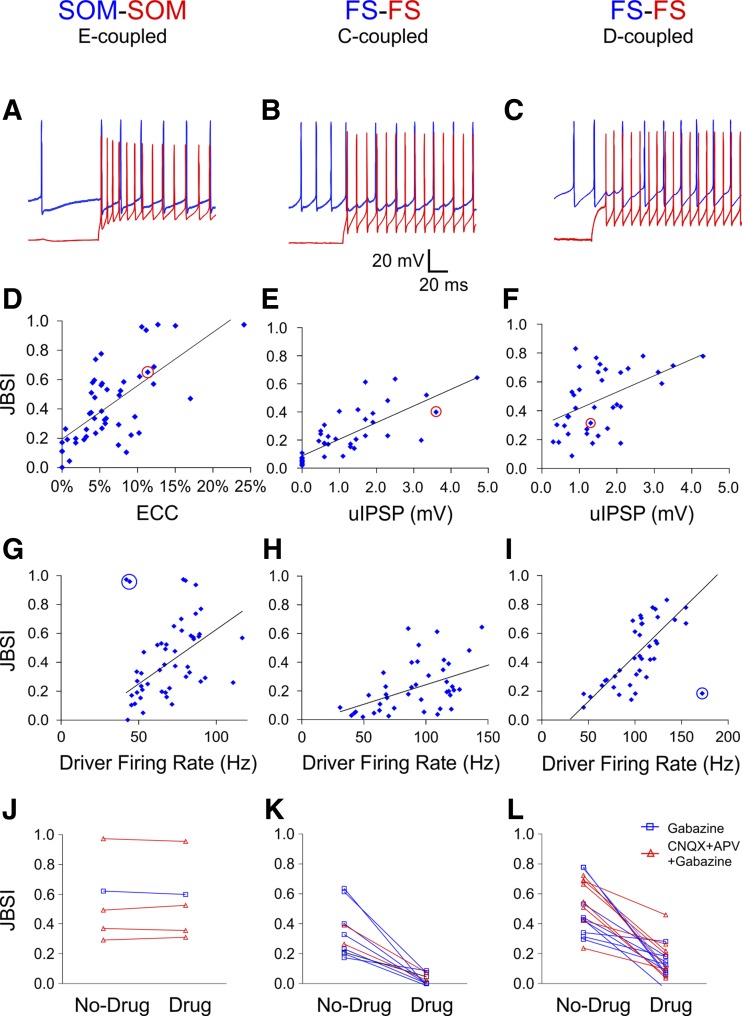
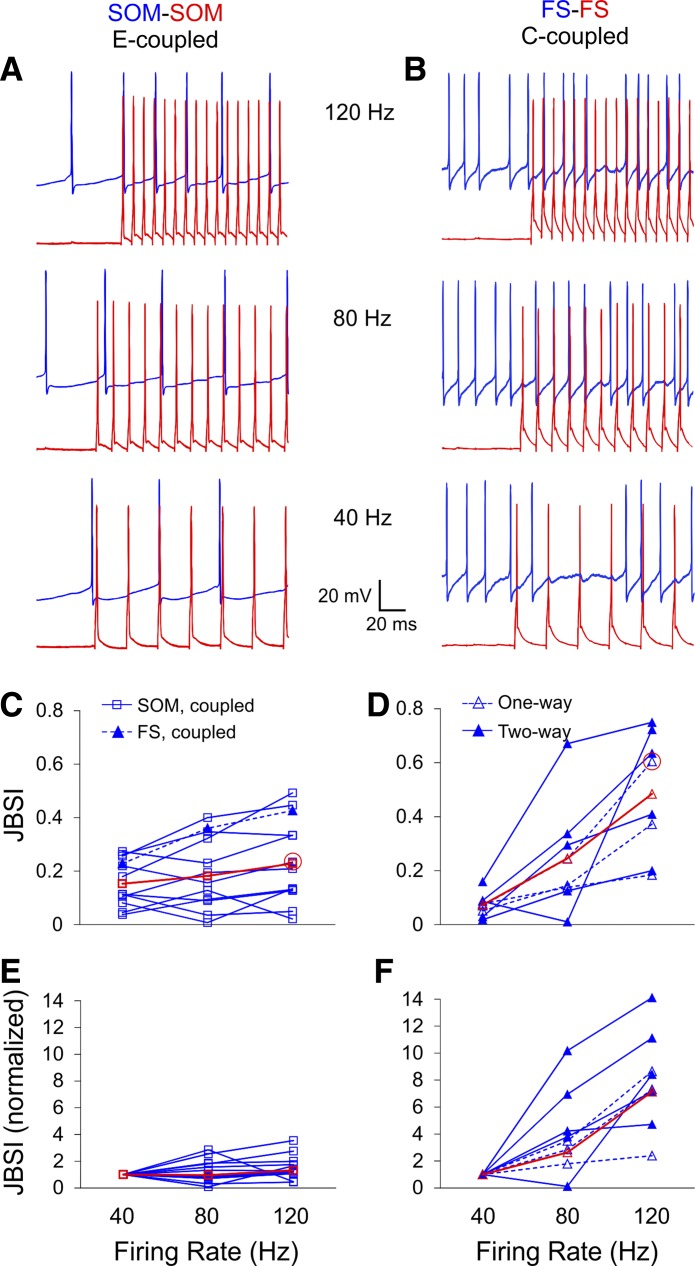
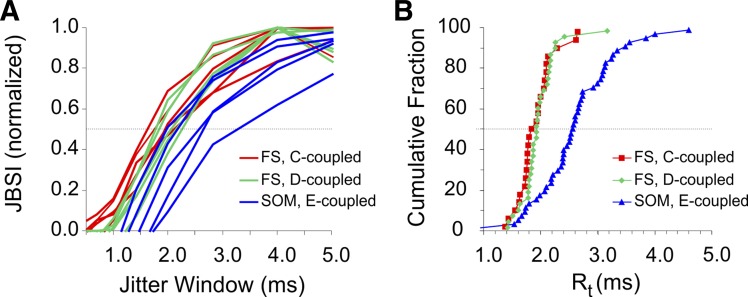
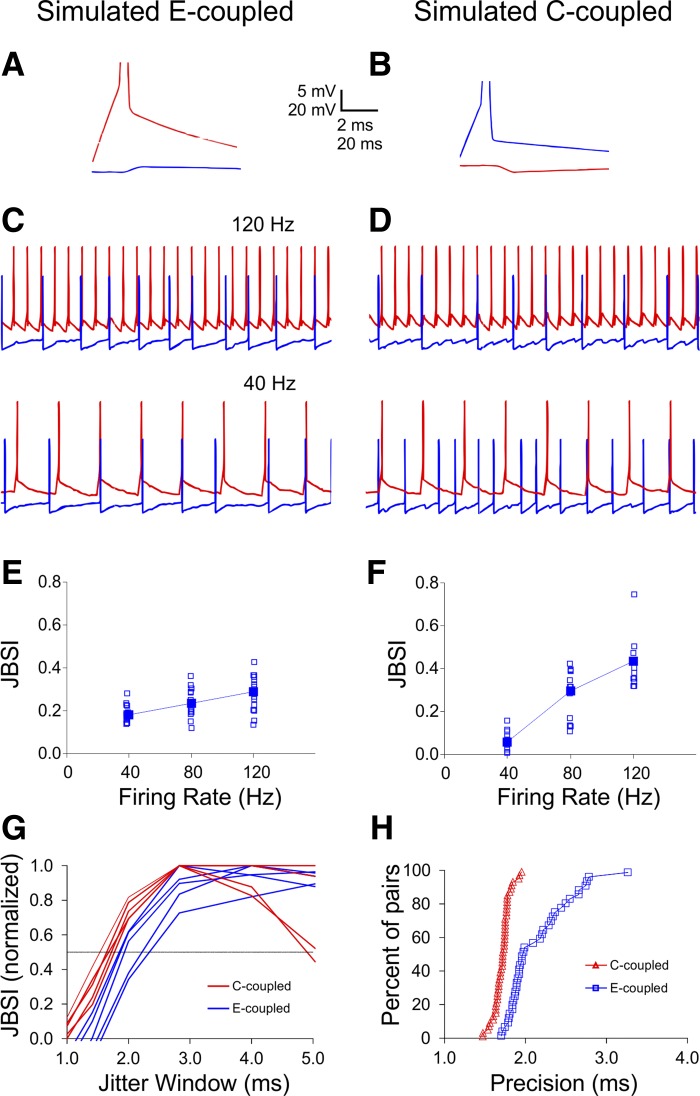
Precise spike synchrony has been widely reported in the central nervous system, but its functional role in encoding, processing, and transmitting information is yet unresolved. Of particular interest is firing synchrony between inhibitory cortical interneurons, thought to drive various cortical rhythms such as gamma oscillations, the hallmark of cognitive states. Precise synchrony can arise between two interneurons connected electrically, through gap junctions, chemically, through fast inhibitory synapses, or dually, through both types of connections, but the properties of synchrony generated by these different modes of connectivity have never been compared in the same data set. In the present study we recorded in vitro from 152 homotypic pairs of two major subtypes of mouse neocortical interneurons: parvalbumin-containing, fast-spiking (FS) interneurons and somatostatin-containing (SOM) interneurons. We tested firing synchrony when the two neurons were driven to fire by long, depolarizing current steps and used a novel synchrony index to quantify the strength of synchrony, its temporal precision, and its dependence on firing rate. We found that SOM-SOM synchrony, driven solely by electrical coupling, was less precise than FS-FS synchrony, driven by inhibitory or dual coupling. Unlike SOM-SOM synchrony, FS-FS synchrony was strongly firing rate dependent and was not evident at the prototypical 40-Hz gamma frequency. Computer simulations reproduced these differences in synchrony without assuming any differences in intrinsic properties, suggesting that the mode of coupling is more important than the interneuron subtype. Our results provide novel insights into the mechanisms and properties of interneuron synchrony and point out important caveats in current models of cortical oscillations.

Keywords: cortical interneurons; electrical coupling; firing synchrony; gap junctions; temporal precision; unitary IPSP.


Figures

Fig. 1.
Fig. 1.
Electrophysiological characteristics of somatostatin-containing (SOM) and parvalbumin-containing, fast-spiking (FS) interneurons. A: voltage responses (top) to negative and positive intracellular current steps (bottom). Compare the adaptation in both firing frequency and spike height in the SOM cell to the nearly constant firing rate and spike height in the FS cell. Inset shows spike waveforms at a faster time base (scale bar: 20 mV, 0.5 ms); note the wider and taller waveform of the SOM spike and the deeper afterhyperpolarization (AHP) of the FS spike. B, left: scatter plot of adaptation ratio vs. spike width for 119 SOM and 185 FS interneurons included in our data set, color coded by mouse line and layer. The diagonal line separates the 2 subtypes nearly perfectly, with only 1 cell per subtype misclassified. Right, the same data plotted as boxes spanning the 10–90 percentile ranges for each subgroup; the 2-dimensional median of each subgroup is indicated by a marker. Note that the ranges for data points from different mouse lines but belonging to the same subtype (SOM or FS) nearly totally overlap, with the exception of layer 3 (L3) and L5 SOM interneurons, which had somewhat wider spikes and weaker adaptation compared with L4 SOM neurons (Ma et al. 2006). See materials and methods for details of mouse lines.
Fig. 2.
Fig. 2.
Electrical and chemical connectivity of SOM and FS pairs. Response of 1 cell (top trace) to a hyperpolarizing current step (A, C, E) or to an action potential (B, D, F) in the paired cell (bottom trace). Schematics at right illustrate the respective mode of coupling: electrical (E-coupled; top), chemical (C-coupled; middle) or dual (D-coupled; bottom). In E- or D-coupled pairs (A and E), a hyperpolarizing step induced by current injection in 1 cell was reflected by a passively conducted, smaller hyperpolarization in the paired cell. In strongly E-coupled pairs (B), an action potential in 1 cell was followed by a passive slower depolarizing potential (JPSP) in the paired cell. In C-coupled pairs (D), an action potential in the presynaptic cell was followed by an inhibitory postsynaptic potential (IPSP) in the paired cell. In some D-coupled pairs (F), an action potential in the presynaptic cell was followed by a biphasic, electrical-chemical postsynaptic response in the paired cell.
Fig. 3.
Fig. 3.
SOM and FS pairs displayed long-lasting, stable firing synchrony. A and B: the basic protocol used to identify and estimate synchrony. One cell in the pair (driver cell; red traces) was strongly activated by 600-ms current steps repeated every 5 s, whereas the other (follower cell; blue traces) was depolarized above threshold by constant current; the red and blue traces are displaced vertically for clarity. Asterisks at top indicate synchronous spikes (peaks within 2 ms of each other); the circled asterisk indicates the spike pair shown at a faster time base at bottom. C and D: a traditional cross-correlogram representation of the same pairs, computed from 400 spikes in the follower cell; bins are 4 ms wide. The height of the central bin indicates the fraction of follower spikes that are within ±2 ms of a driver spike. E and F: a synchrony index (JBSI) was calculated for 10 representative SOM and 12 FS pairs from increasingly longer segments of the full spike train and normalized to its value at 1,000 spikes (JBSI1000); note the short-term fluctuations, especially in FS pairs, but the long-term stability of the JBSI.
Fig. 4.
Fig. 4.
Interneuron synchrony depends on electrical synapses, chemical synapses, and firing rate. A–C: to test for firing synchrony, paired spike trains were elicited by suprathreshold current steps in the driver cell (red traces) and by tonic suprathreshold depolarization in the follower cell (blue traces). D–F: strength of synchrony (as quantified by the JBSI) was well correlated with the electrical coupling coefficient (ECC) in E-coupled SOM pairs (r2 = 0.45) and with the unitary IPSP (uIPSP) in C-coupled FS pairs (r2 = 0.58) and not as well correlated with the uIPSP in D-coupled FS pairs (r2 = 0.27). Data points corresponding to the example pairs are circled in red. G–I: the JBSI correlated with the firing rate of the driver cell (r2 = 0.29, 0.20, and 0.58, respectively), but not the follower cell (not shown). The regression lines and correlation coefficients were calculated after exclusion of the 3 outlier data points circled in blue in G and I. J–L: blocking GABAA receptors, with or without blocking ionotropic glutamate receptors, had no effect on synchrony between E-coupled SOM pairs (J), abolished synchrony between C-coupled FS pairs (K), and suppressed but did not abolish synchrony between D-coupled FS pairs (L). CNQX, 6-cyano-7-nitroquinoxaline-2,3-dione disodium; APV, d-(−)-2-amino-5-phosphonopentanoic acid.
Fig. 5.
Fig. 5.
Chemically driven, but not electrically driven, synchrony is strongly firing rate dependent. A and B: firing at predefined rates (40, 80, 120 Hz) was elicited in the driver cell (red traces) by trains of 20 brief current pulses repeated every 3 s, and tonic firing was elicited in the follower cell (blue traces) by constant current injection. C and D: summary plots of JBSI at each firing rate for all pairs tested; red symbols are group averages. Data points corresponding to the 2 example pairs are circled in red. E and F: the same data normalized to the JBSI value at 40 Hz. Synchrony was strongly dependent on driver firing rate in C-coupled FS pairs (D and F) and only weakly so in E-coupled SOM pairs (C and E). One E-coupled FS pair (filled triangles) is included with the SOM pairs in C; it resembled E-coupled SOM pairs rather than C-coupled FS pairs.
Fig. 6.
Fig. 6.
Chemically driven synchrony was more precise than electrically driven synchrony. A: normalized JBSI values computed for decreasing jitter windows, from pairs tested by current steps, are plotted against the jitter window for 5 representative pairs from each group (blue lines for E-coupled SOM pairs, red and green lines for C- and D-coupled FS pairs, respectively). The jitter window for which the JBSI drops to half its maximum (crossing the horizontal dotted line) is defined as the temporal resolution (Rt) of that pair and is inversely related to firing precision. B: cumulative histograms of Rt for pairs tested by current steps; only pairs with peak JBSI ≥ 0.15 are included. Precision of C- and D-coupled FS pairs was similar to each other but significantly better (by about ⅓) than precision of E-coupled SOM pairs (note the differences in medians, the points intersecting the horizontal dotted line).
Fig. 7.
Fig. 7.
Simulations reproduced the observed differences between electrically and chemically driven synchrony. A reduced integrate-and-fire model was used to simulate paired spike trains from interconnected neurons with identical intrinsic properties. A and B: electrical coupling was simulated by a JPSP following a spike in the paired neuron with 0 latency, and chemical coupling was simulated by an IPSP following a spike in the presynaptic neuron with 1-ms latency. Both postsynaptic potentials decayed at the membrane time constant, assumed to be 10 ms. C: simulated paired spike trains in which 1 neuron (red traces) was induced to fire at predefined frequencies while the other (blue traces) was tonically depolarized, as in our experiments; the level of tonic depolarization was varied within experimental values, as were the JPSP and IPSP amplitudes. E and F: JBSI plotted against firing rate for 15 simulated pairs from each group. Filled symbols indicate medians. Synchrony by E-coupling was weakly firing rate dependent, but synchrony by C-coupling was strongly firing rate dependent, similarly to our experiments (compare with Fig. 5, C and D). G: JBSI plotted at decreasing jitter windows for 5 representative simulated pairs from each group (compare with Fig. 6A). H: cumulative firing precision for 50 simulated pairs from each group (compare with Fig. 6B).

Similar articles

Cited by

References

    1. Agmon A. A novel, jitter-based method for detecting and measuring spike synchrony and quantifying temporal firing precision. Neural Syst Circuits 2: 5, 2012. - PMC - PubMed
    1. Amarasingham A, Harrison MT, Hatsopoulos NG, Geman S. Conditional modeling and the jitter method of spike resampling. J Neurophysiol 107: 517–531, 2012. - PMC - PubMed
    1. Angulo MC, Rossier J, Audinat E. Postsynaptic glutamate receptors and integrative properties of fast-spiking interneurons in the rat neocortex. J Neurophysiol 82: 1295–1302, 1999a. - PubMed
    1. Angulo MC, Staiger JF, Rossier J, Audinat E. Developmental synaptic changes increase the range of integrative capabilities of an identified excitatory neocortical connection. J Neurosci 19: 1566–1576, 1999b. - PMC - PubMed
    1. Atallah BV, Scanziani M. Instantaneous modulation of gamma oscillation frequency by balancing excitation with inhibition. Neuron 62: 566–577, 2009. - PMC - PubMed

Publication types

LinkOut - more resources