. 2015:2015:498405.
doi: 10.1155/2015/498405. Epub 2015 Apr 20.

Repetitive hyperbaric oxygenation attenuates reactive astrogliosis and suppresses expression of inflammatory mediators in the rat model of brain injury

Affiliations

Repetitive hyperbaric oxygenation attenuates reactive astrogliosis and suppresses expression of inflammatory mediators in the rat model of brain injury

Irena Lavrnja et al. Mediators Inflamm. 2015.

Abstract

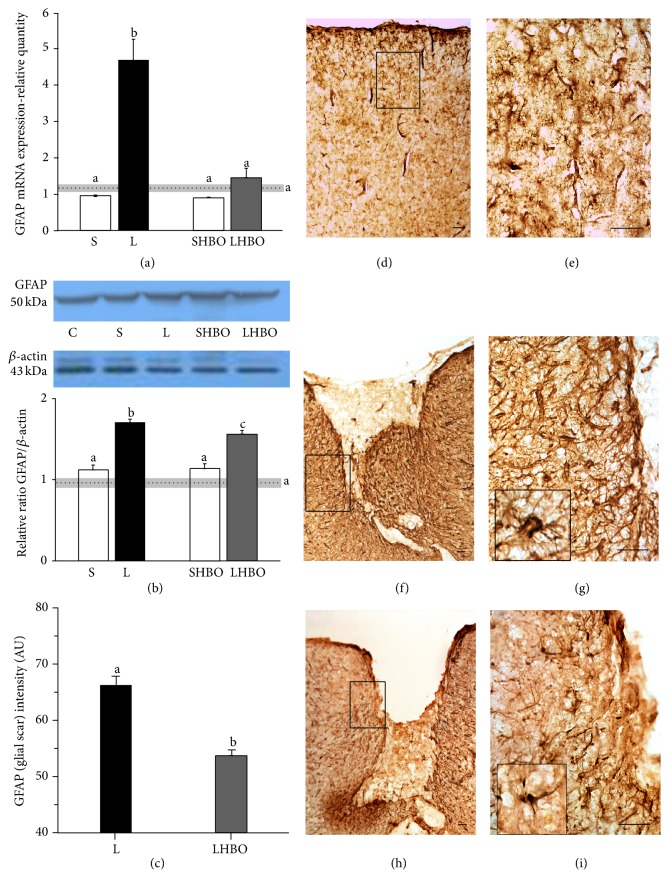
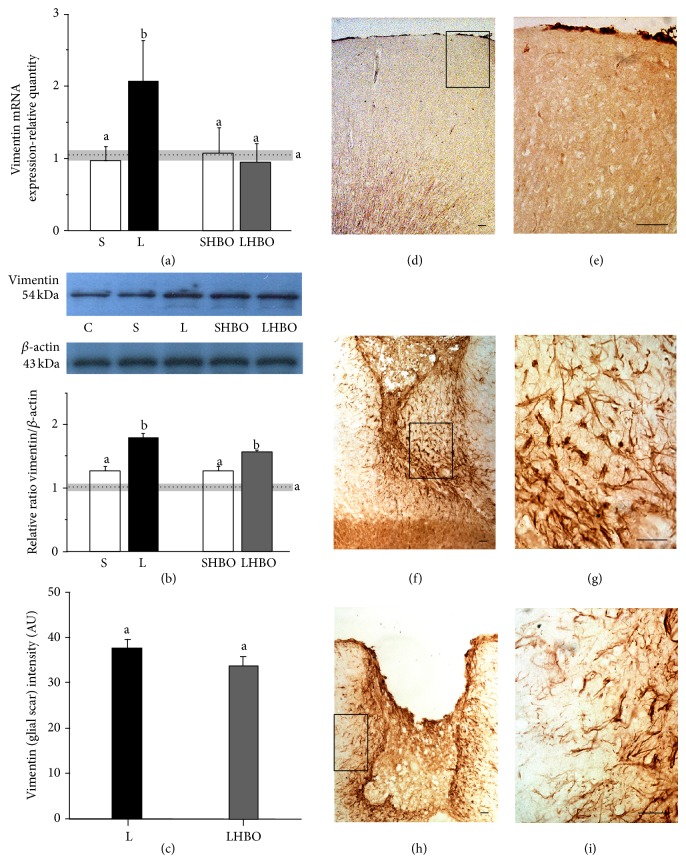
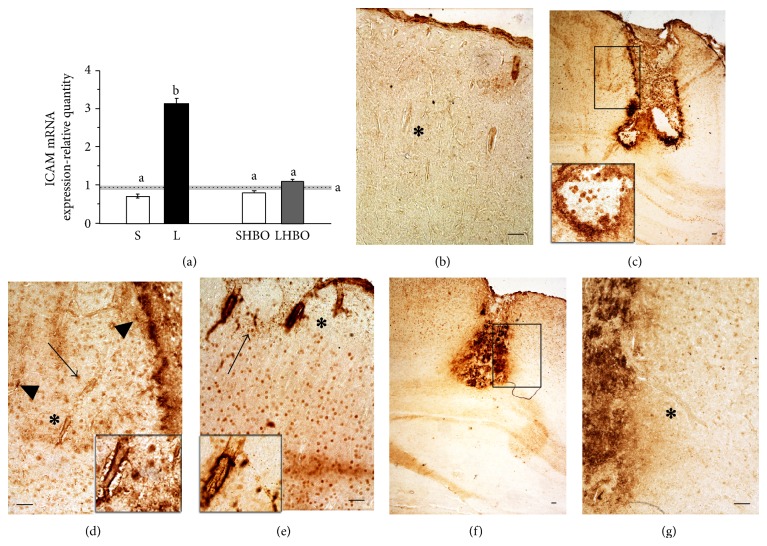
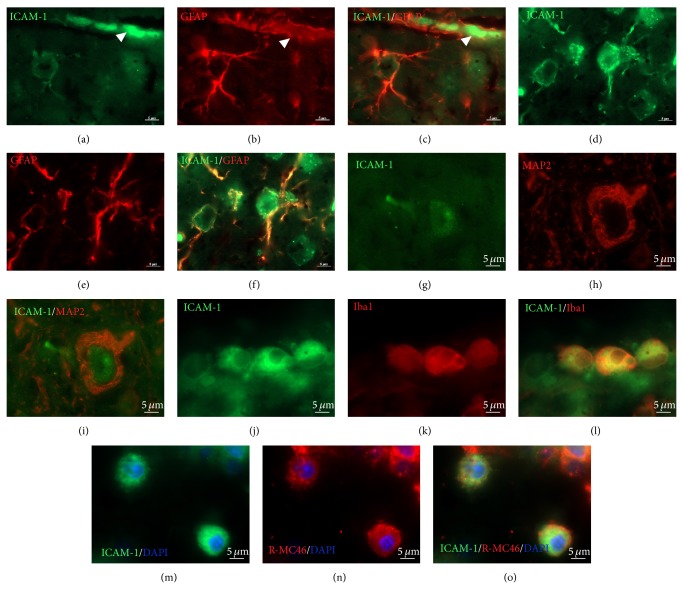
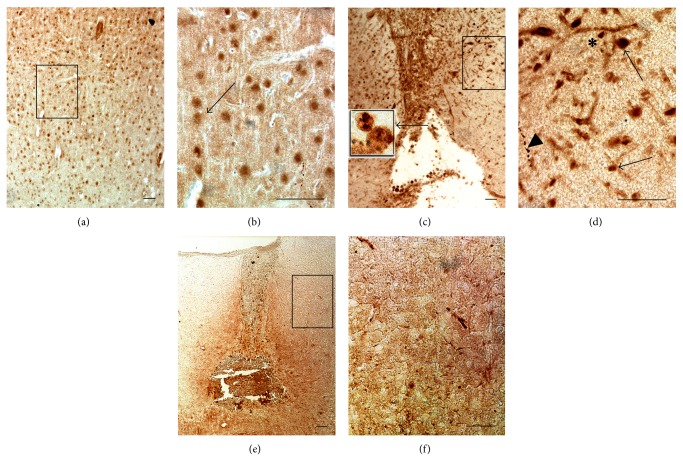
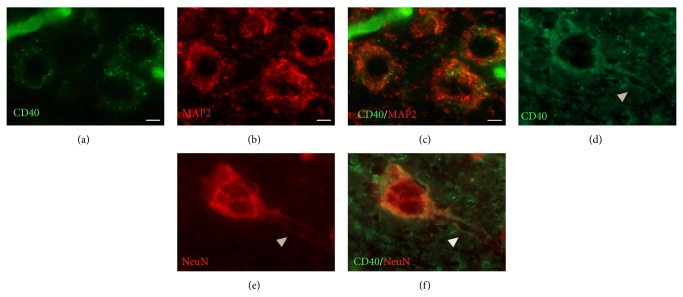
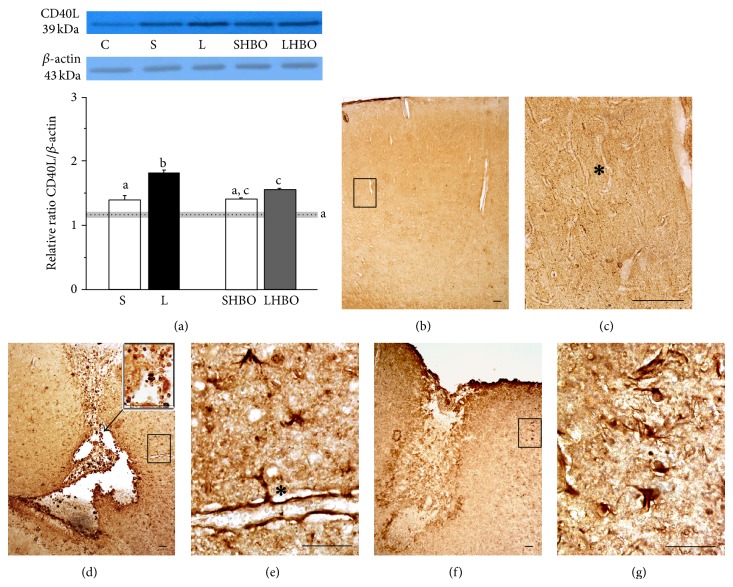
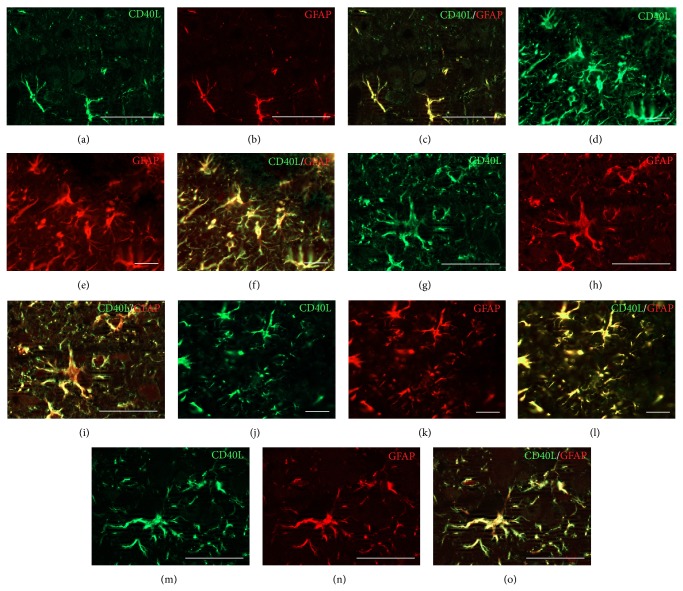
The exact mechanisms by which treatment with hyperbaric oxygen (HBOT) exerts its beneficial effects on recovery after brain injury are still unrevealed. Therefore, in this study we investigated the influence of repetitive HBOT on the reactive astrogliosis and expression of mediators of inflammation after cortical stab injury (CSI). CSI was performed on male Wistar rats, divided into control, sham, and lesioned groups with appropriate HBO. The HBOT protocol was as follows: 10 minutes of slow compression, 2.5 atmospheres absolute (ATA) for 60 minutes, and 10 minutes of slow decompression, once a day for 10 consecutive days. Data obtained using real-time polymerase chain reaction, Western blot, and immunohistochemical and immunofluorescence analyses revealed that repetitive HBOT applied after the CSI attenuates reactive astrogliosis and glial scarring, and reduces expression of GFAP (glial fibrillary acidic protein), vimentin, and ICAM-1 (intercellular adhesion molecule-1) both at gene and tissue levels. In addition, HBOT prevents expression of CD40 and its ligand CD40L on microglia, neutrophils, cortical neurons, and reactive astrocytes. Accordingly, repetitive HBOT, by prevention of glial scarring and limiting of expression of inflammatory mediators, supports formation of more permissive environment for repair and regeneration.


Figures

Figure 1
Figure 1
Effect of repetitive HBOT on GFAP expression after CSI. CSI provoked upregulation of GFAP expression both at mRNA (a) and protein (b) levels in the injured cortex compared to intact control and sham-operated animals, while repetitive HBOT reduced levels of GFAP mRNA to those detected in control groups. (a) Bars represent mean ± SEM of GFAP mRNA (relative to GAPDH). (b) Immunoblot analysis showed that GFAP was present as a single band with a molecular mass of about 50 kDa. Bars represent mean ± SEM of GFAP protein content (relative to β-actin). Samples are from 4 animals per each group. Dot line represents mean of GFAP mRNA or protein level ± SEM (gray area) measured in control animals. Letters indicate significance levels (P < 0.005) between lesioned (L) and intact control group, L versus sham control (S) group, and L compared to lesioned group subjected to the HBO protocol (LHBO). The groups not sharing a common letter are statistically different. Level of significance was analyzed using Student's t-test. (c) The luminosity of glial scar is obtained by measuring GFAP staining intensity around the lesion site and presented on histogram. ((d) and (e)) Throughout the cortex of intact rats a small number of fibrous GFAP+ astrocytes is seen. ((f) and (g)) At 10 days after injury a huge number of reactive astrocytes with pronounced hypertrophy of cell body and processes ((g) inset) form glial scar around the lesion site. ((h) and (i)) Ten successive HBOT significantly reduced glial scar formation, and the majority of astrocytes attained fibrous morphology ((i) inset). Rectangles indicate where the high magnification images are taken from. Scale bar = 50 μm.
Figure 2
Figure 2
Repetitive HBOT reduces gene and tissue expression of vimentin after CSI. Upregulation of vimentin expression both at mRNA (a) and protein (b) levels is observed after CSI in the injured cortex compared to intact control and sham-operated animals. (a) Repetitive HBOT reduced levels of vimentin mRNA to those detected in control groups. Bars represent mean ± SEM of vimentin mRNA (relative to GAPDH). (b) Immunoblot analysis showed that vimentin was present as a single band with a molecular mass of about 57 kDa. HBOT slightly but not statistically significantly decreased vimentin expression. Bars represent mean ± SEM of vimentin protein content (relative to β-actin). Samples are from 4 animals per each group. Dot line represents mean of vimentin mRNA or protein level ± SEM (gray area) measured in control animals. Letters indicate significance levels (P < 0.005) between lesioned (L) and intact control groups, L versus sham control (S) group, and L compared to lesioned group subjected to the HBO protocol (LHBO). The groups not sharing a common letter are statistically different. Level of significance was analyzed using Student's t-test. (c) The luminosity of glial scar is obtained by measuring vimentin staining intensity around the lesion site and presented on histogram. ((d) and (e)) Vimentin immunoreactivity was negligible in the cortex of intact rats. ((f) and (g)) After CSI vimentin staining was significantly increased in the proximity to the lesion site. Vimentin+ astrocytes had enlarged cell bodies with thick processes. ((h) and (i)) After HBOT reactive astrocytes surrounded the lesion site as a narrow line. Rectangles indicate where the high magnification images are taken from. Scale bar = 50 μm.
Figure 3
Figure 3
Repetitive HBOT reduces gene and tissue expression of ICAM-1 after CSI. (a) Repetitive HBOT attenuated injury-induced upregulation of ICAM-1 mRNA expression in the injured cortex. Bars represent mean ± SEM of ICAM-1 mRNA (relative to GAPDH). Samples are from 4 animals per each group. Dot line represents mean of ICAM-1 mRNA level ± SEM (gray area) measured in control animals. Letters indicate significance levels (P < 0.005) between lesioned (L) and intact control groups, L versus sham control (S) group, and L compared to lesioned group subjected to the HBO protocol (LHBO). The groups not sharing a common letter are statistically different. Level of significance was analyzed using Student's t-test. (b) In the control cortex ICAM-1 localization is present on the blood vessels (asterisk). ((c) and (d)) An increased ICAM-1 immunoreactivity is seen around the lesion site after the CSI. Heavy immunostaining of blood vessels is demonstrated both in ipsilateral (asterisk (d) and (e) inset) and contralateral cortex (asterisk (e) and (e) inset). The arrow denotes dark neuron-like cells in injured (d) and contralateral cortex (e). ICAM-1-positive neutrophils, microglia ((c), (c) inset), and astrocyte-like cells ((d), arrow head) were confined to the lesion area. (f) and (g) Repetitive HBOT reduced ICAM-1 immunoreactivity, while blood vessels were faintly stained ((g) asterisk). Rectangles indicate where the high magnification images are taken from. Scale bar = 50 μm.
Figure 4
Figure 4
ICAM-1 (green fluorescence) colocalization with different cell types around and within the lesion site. ICAM-1 ((a) and (d)) and GFAP ((b) and (e) red fluorescence) coexpression was found in reactive astrocytes around the blood vessels ((c), arrow head) and in close vicinity to the lesion site (f). Colocalization of ICAM-1 (g) and MAP-2 ((h) red fluorescence) was detected mostly on neuronal cell bodies (i). ICAM-1 (j) colocalized only with activated microglia (Iba1, red fluorescence, (k)) clustered along the border to the lesion site and within the lesion site ((l) yellow fluorescence). Also, ICAM-1 completely overlaps with R-MC46+ neutrophils ((n) red fluorescence) only at the borders and within the lesion core ((o) yellow fluorescence)). Scale bar = 5 μm.
Figure 5
Figure 5
Repetitive HBOT affects CD40 expression after CSI. ((a) and (b)) In control cortical sections CD40 is expressed on neuron-like cells. (c) CSI increased CD40 immunoreactivity in the perilesioned cortex. ((c) inset) High magnification photomicrograph depicts a typical neutrophil with round morphology and multiple nuclei (left up corner of inset), while the enlarged cell in the right corner of inset is probably activated microglia. (d) CD40-positive dark-stained pyknotic neurons, transected axonal processes (denoted with arrows), nerve fiber varicosities (arrow head), and blood vessels (asterisk) were abundantly present in perilesioned area. ((e) and (f)) 10 days of HBOT significantly reduced CD40 immunoreactivity in the injured cortex. Rectangles indicate where the high magnification images are taken from. Scale bar = 50 μm.
Figure 6
Figure 6
CD-40 (green fluorescence) colocalization with markers of neuronal cells in the injured cortex. ((a)–(c)) Double-immunofluorescence analysis of CD40 (a) and MAP-2 ((b) red fluorescence) revealed that CD40 fluorescence signal was mostly detected on neuronal cell bodies ((c) yellow fluorescence). ((d)–(f)) CD40 (d) and NeuN ((e) red fluorescence) fluorescence colocalized not only on neuronal cell bodies but also on axons (f). Arrow head points to varicosities along axons. Scale bar = 5 μm.
Figure 7
Figure 7
Repetitive HBOT downregulates CD40L expression after CSI. (a) Immunoblot analysis showed that CD40L was present as a single band with a molecular mass of about 36 kDa. After CSI expression of CD40L significantly (P < 0.005) increased in respect to intact control (C) and sham-operated animals (S). However, compared to L group in LHBO group statistically significant reduction (P < 0.005) of CD40L protein expression was observed. Bars represent mean ± SEM of CD40L protein content (relative to β-actin). Samples are from 4 animals per each group. Dot line represents mean of CD40L mRNA or protein level ± SEM (gray area) measured in control animals. Letters indicate significance levels (P < 0.005) between lesioned (L) and intact control groups, L versus sham control (S) group, and L compared to lesioned group subjected to the HBO protocol (LHBO). The groups not sharing a common letter are statistically different. Level of significance was analyzed using Student's t-test. ((b) and (c)) In control cortex CD40L was localized in blood vessels ((c) asterisk). (d) At 10th day after CSI intense CD40L immunoreactivity occurred in perilesioned area: ((d), inset) in macrophages/microglia and neutrophils and (e) in protoplasmic astrocytes in close contact with endothelial cells via astrocytic end-feet (asterisk). (f) Repetitive HBOT decreased CD40L immunostaining in the injured cortex. (g) CD40L-positive astrocytes had fibrous form. Rectangles indicate where the high magnification images are taken from. Scale bar = 50 μm.
Figure 8
Figure 8
Double-immunofluorescence analysis of CD40L (green) and GFAP (red) colocalization after CSI and HBOT. ((a)–(c)) Sparse CD40L/GFAP positive fibrous astrocytes were seen in the cortex of control rats. ((d)–(f)) Strong CD40L immunoreactivity occurred in GFAP+ astrocytes that form dense mesh of glial scar in the area adjacent to the lesion site, providing an overlapping signal (yellow fluorescence). ((g)–(i)) CD40L and GFAP signal is abundantly present at protoplasmic astrocyte cell bodies, and thick proximal and distal processes. ((j)–(l)) Repetitive HBOT decreased intensity of CD40L/GFAP immunofluorescence. ((m)–(o)) Reactive phenotype of astrocytes is transformed into more resting form with smaller cell body and long processes resembling morphology of astrocytes from the control group. Scale bar = 50 μm.

Similar articles

Cited by

References

    1. Saatman K. E., Feeko K. J., Pape R. L., Raghupathi R. Differential behavioral and histopathological responses to graded cortical impact injury in mice. Journal of Neurotrauma. 2006;23(8):1241–1253. doi: 10.1089/neu.2006.23.1241. - DOI - PubMed
    1. Pekovic S., Subasic S., Nedeljkovic N., et al. Molecular basis of brain injury and repair. In: Ruzdijic S., Rakic L., editors. Neurobiological Studies—From Genes to Behaviour. Kerala, India: Research Signpost; 2006. pp. 143–165.
    1. Cederberg D., Siesjö P. What has inflammation to do with traumatic brain injury? Child's Nervous System. 2010;26(2):221–226. doi: 10.1007/s00381-009-1029-x. - DOI - PubMed
    1. Lenzlinger P. M., Morganti-Kossmann M.-C., Laurer H. L., McIntosh T. K. The duality of the inflammatory response to traumatic brain injury. Molecular Neurobiology. 2001;24(1–3):169–181. doi: 10.1385/mn:24:1-3:169. - DOI - PubMed
    1. Hellewell S. C., Morganti-Kossmann M. C. Guilty molecules, guilty minds? The conflicting roles of the innate immune response to traumatic brain injury. Mediators of Inflammation. 2012;2012:18. doi: 10.1155/2012/356494.356494 - DOI - PMC - PubMed

Publication types

LinkOut - more resources