

Transcriptional activity of the giant barrel sponge, Xestospongia muta Holobiont: molecular evidence for metabolic interchange
- PMID: 25972851
- PMCID: PMC4412061
- DOI: 10.3389/fmicb.2015.00364
Transcriptional activity of the giant barrel sponge, Xestospongia muta Holobiont: molecular evidence for metabolic interchange
Abstract
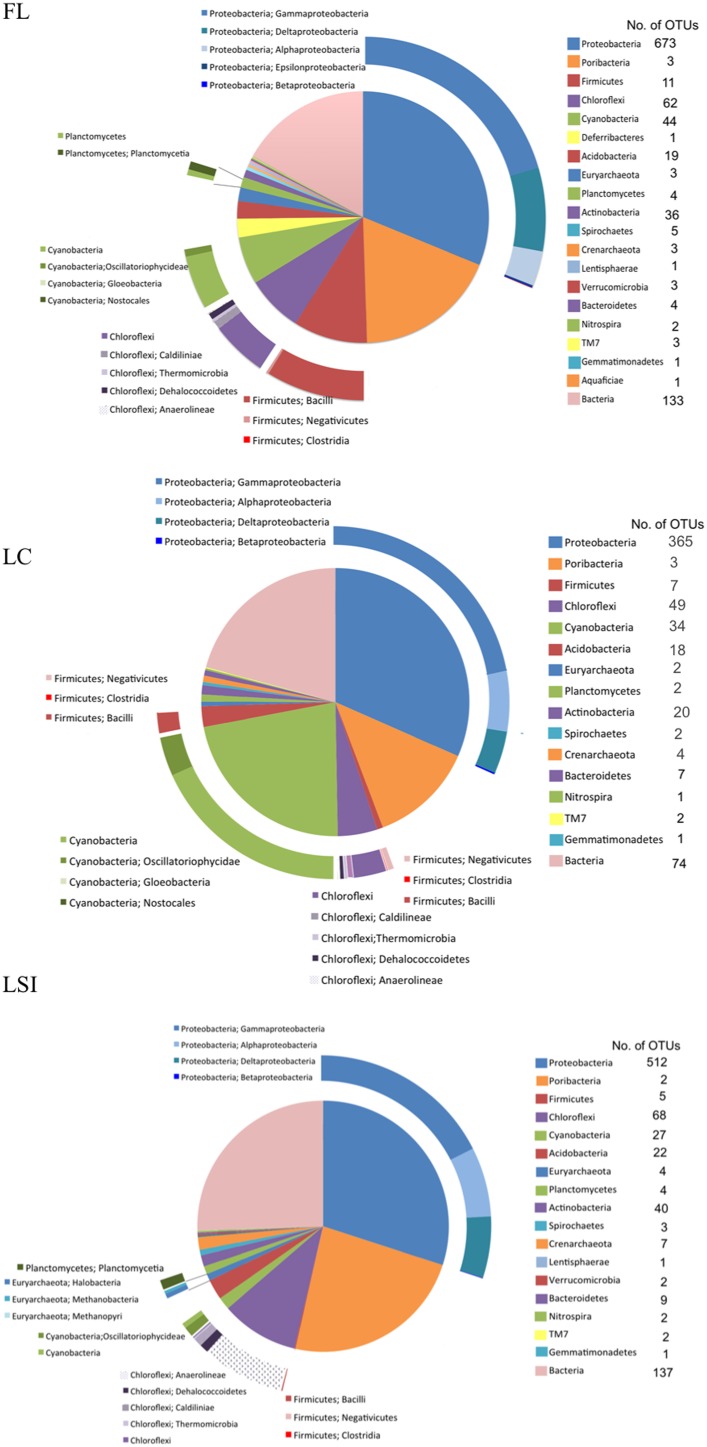
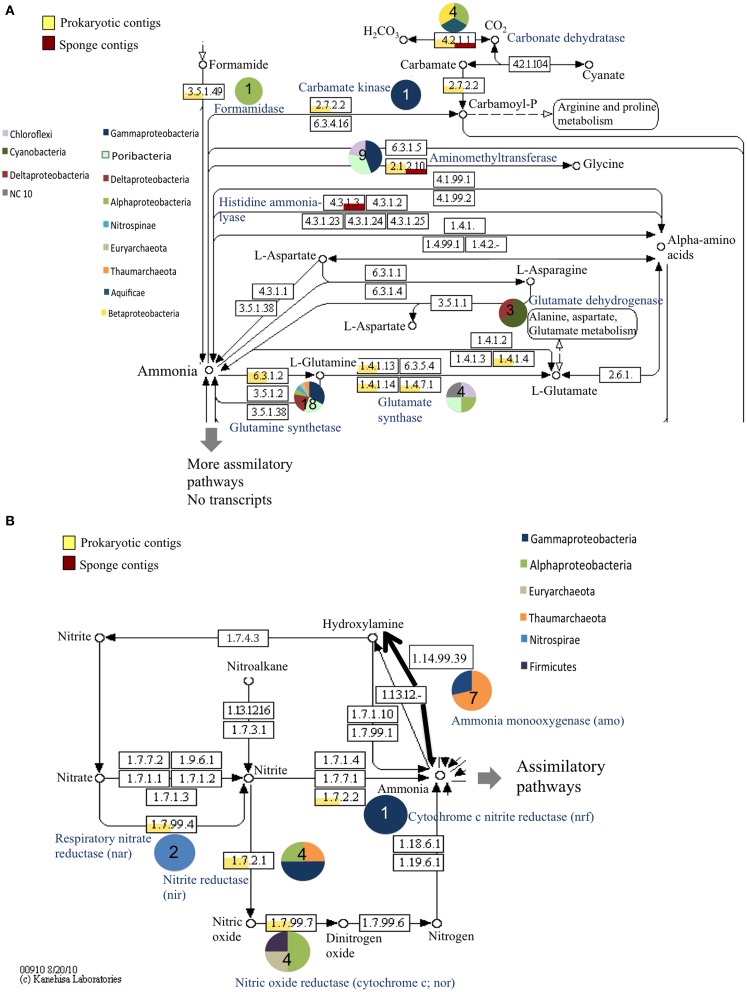
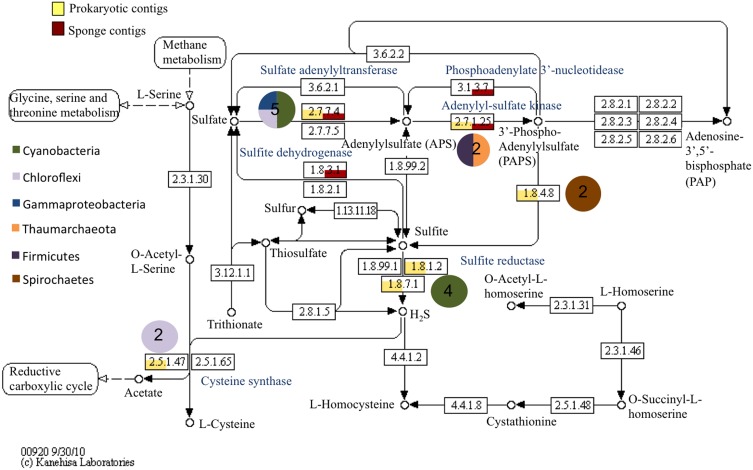
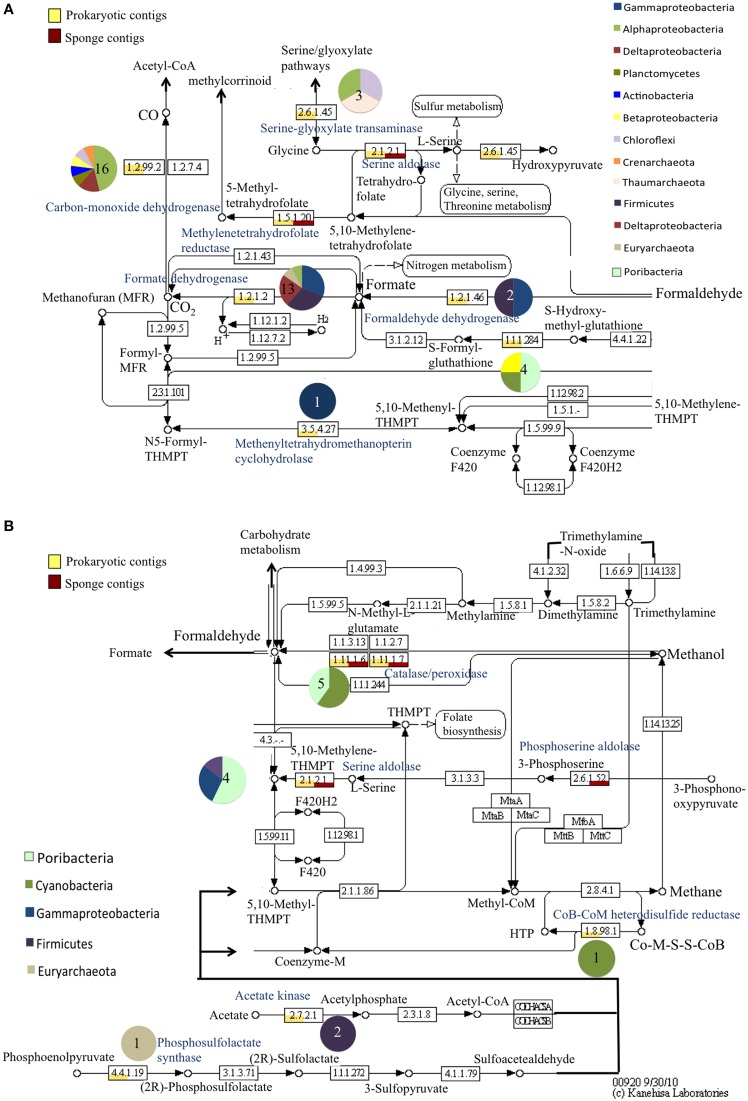
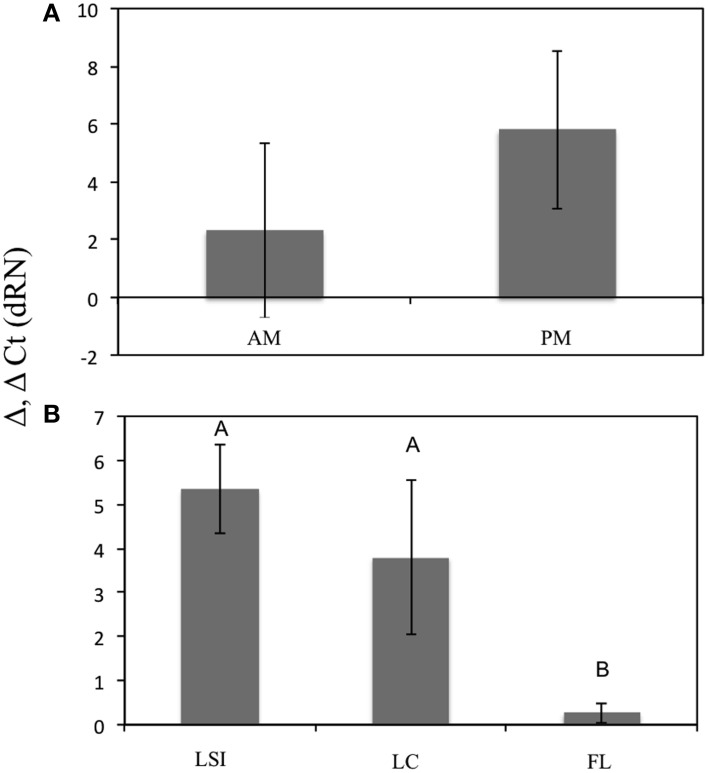
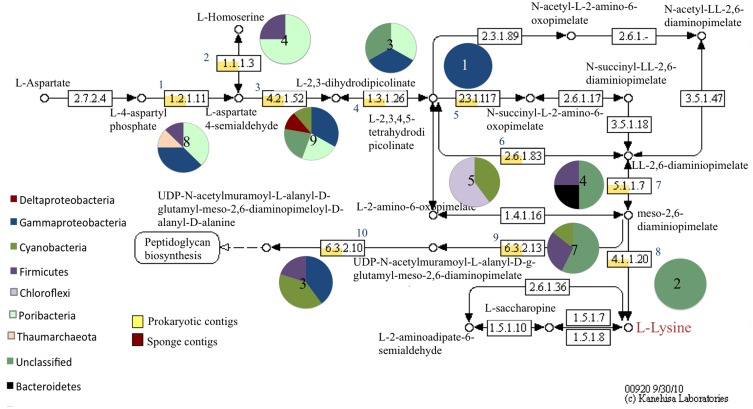
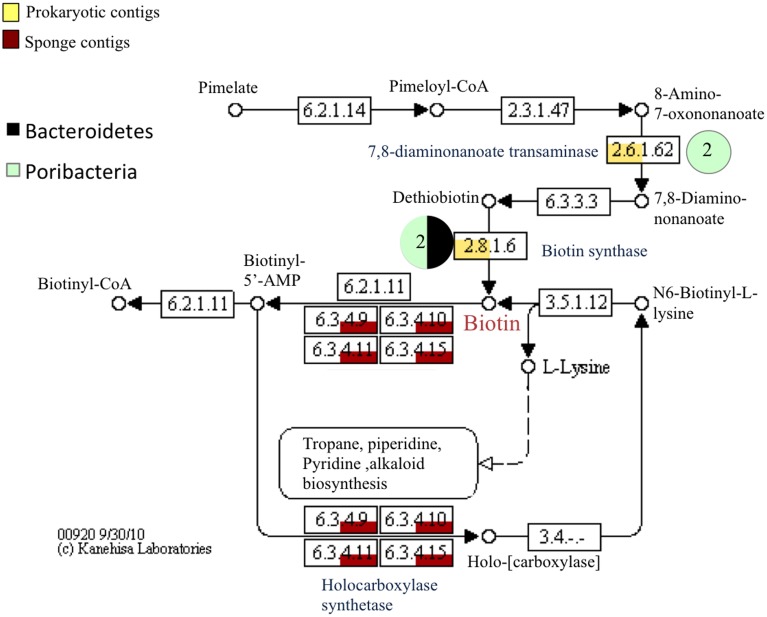
Compared to our understanding of the taxonomic composition of the symbiotic microbes in marine sponges, the functional diversity of these symbionts is largely unknown. Furthermore, the application of genomic, transcriptomic, and proteomic techniques to functional questions on sponge host-symbiont interactions is in its infancy. In this study, we generated a transcriptome for the host and a metatranscriptome of its microbial symbionts for the giant barrel sponge, Xestospongia muta, from the Caribbean. In combination with a gene-specific approach, our goals were to (1) characterize genetic evidence for nitrogen cycling in X. muta, an important limiting nutrient on coral reefs (2) identify which prokaryotic symbiont lineages are metabolically active and, (3) characterize the metabolic potential of the prokaryotic community. Xestospongia muta expresses genes from multiple nitrogen transformation pathways that when combined with the abundance of this sponge, and previous data on dissolved inorganic nitrogen fluxes, shows that this sponge is an important contributor to nitrogen cycling biogeochemistry on coral reefs. Additionally, we observed significant differences in gene expression of the archaeal amoA gene, which is involved in ammonia oxidation, between coral reef locations consistent with differences in the fluxes of dissolved inorganic nitrogen previously reported. In regards to symbiont metabolic potential, the genes in the biosynthetic pathways of several amino acids were present in the prokaryotic metatranscriptome dataset but in the host-derived transcripts only the catabolic reactions for these amino acids were present. A similar pattern was observed for the B vitamins (riboflavin, biotin, thiamin, cobalamin). These results expand our understanding of biogeochemical cycling in sponges, and the metabolic interchange highlighted here advances the field of symbiont physiology by elucidating specific metabolic pathways where there is high potential for host-prokaryote interactions.
Keywords: B vitamins; ammonia oxidation; denitrification; metatranscriptome; sponge symbionts.
Figures
Similar articles
-
Symbiotic prokaryotic communities from different populations of the giant barrel sponge, Xestospongia muta.Microbiologyopen. 2013 Dec;2(6):938-52. doi: 10.1002/mbo3.135. Epub 2013 Sep 30. Microbiologyopen. 2013. PMID: 24124112 Free PMC article.
-
Nitrogen biogeochemistry in the Caribbean sponge, Xestospongia muta: a source or sink of dissolved inorganic nitrogen?PLoS One. 2013 Aug 26;8(8):e72961. doi: 10.1371/journal.pone.0072961. eCollection 2013. PLoS One. 2013. PMID: 23991166 Free PMC article.
-
Effects of sponge bleaching on ammonia-oxidizing Archaea: distribution and relative expression of ammonia monooxygenase genes associated with the barrel sponge Xestospongia muta.Microb Ecol. 2010 Oct;60(3):561-71. doi: 10.1007/s00248-010-9662-1. Microb Ecol. 2010. PMID: 20390264
-
Comparative Metagenomic Analysis of Biosynthetic Diversity across Sponge Microbiomes Highlights Metabolic Novelty, Conservation, and Diversification.mSystems. 2022 Aug 30;7(4):e0035722. doi: 10.1128/msystems.00357-22. Epub 2022 Jul 18. mSystems. 2022. PMID: 35862823 Free PMC article. Review.
-
Microbially mediated nutrient cycles in marine sponges.FEMS Microbiol Ecol. 2019 Nov 1;95(11):fiz155. doi: 10.1093/femsec/fiz155. FEMS Microbiol Ecol. 2019. PMID: 31589314 Review.
Cited by
-
Variations in Microbial Diversity and Metabolite Profiles of the Tropical Marine Sponge Xestospongia muta with Season and Depth.Microb Ecol. 2019 Jul;78(1):243-256. doi: 10.1007/s00248-018-1285-y. Epub 2018 Nov 10. Microb Ecol. 2019. PMID: 30413836
-
Marine Sponges as Chloroflexi Hot Spots: Genomic Insights and High-Resolution Visualization of an Abundant and Diverse Symbiotic Clade.mSystems. 2018 Dec 26;3(6):e00150-18. doi: 10.1128/mSystems.00150-18. eCollection 2018 Nov-Dec. mSystems. 2018. PMID: 30637337 Free PMC article.
-
Host-microbe interactions in octocoral holobionts - recent advances and perspectives.Microbiome. 2018 Apr 2;6(1):64. doi: 10.1186/s40168-018-0431-6. Microbiome. 2018. PMID: 29609655 Free PMC article. Review.
-
Subcellular view of host-microbiome nutrient exchange in sponges: insights into the ecological success of an early metazoan-microbe symbiosis.Microbiome. 2021 Feb 14;9(1):44. doi: 10.1186/s40168-020-00984-w. Microbiome. 2021. PMID: 33583434 Free PMC article.
-
Taurine as a key intermediate for host-symbiont interaction in the tropical sponge Ianthella basta.ISME J. 2023 Aug;17(8):1208-1223. doi: 10.1038/s41396-023-01420-1. Epub 2023 May 15. ISME J. 2023. PMID: 37188915 Free PMC article.
References
-
- Antal T. K., Lindblad P. (2005). Production of H2 by sulphur-deprived cells of the unicellular cyanobacteria Gloeocapsa alpicola and Synechocystis sp. PCC 6803 during dark incubation with methane or at various extracellular pH. J. Appl. Microbiol. 98, 114–120 10.1111/j.1365-2672.2004.02431.x - DOI - PubMed
-
- Arillo A., Bavestrello G., Burlando B., Sarà M. (1993). Metabolic integration between symbiotic cyanobacteria and sponges: a possible mechanism. Marine Biol. 117, 159–162 10.1007/BF00346438 - DOI
-
- Boyer J. N., Dailey S. K., Gibson P. J., Rogers M. T., Mir-Gonzalez D. (2006). The role of dissolved organic matter bioavailability in promoting phytoplankton blooms in Florida Bay. Hydrobiologia 569, 71–85 10.1007/s10750-006-0123-2 - DOI
LinkOut - more resources
Full Text Sources
Other Literature Sources