Review
. 2015 Apr 28:6:226.
doi: 10.3389/fpls.2015.00226. eCollection 2015.

Salt tolerance at single cell level in giant-celled Characeae

Affiliations
Review

Salt tolerance at single cell level in giant-celled Characeae

Mary J Beilby. Front Plant Sci. .

Abstract

Characean plants provide an excellent experimental system for electrophysiology and physiology due to: (i) very large cell size, (ii) position on phylogenetic tree near the origin of land plants and (iii) continuous spectrum from very salt sensitive to very salt tolerant species. A range of experimental techniques is described, some unique to characean plants. Application of these methods provided electrical characteristics of membrane transporters, which dominate the membrane conductance under different outside conditions. With this considerable background knowledge the electrophysiology of salt sensitive and salt tolerant genera can be compared under salt and/or osmotic stress. Both salt tolerant and salt sensitive Characeae show a rise in membrane conductance and simultaneous increase in Na(+) influx upon exposure to saline medium. Salt tolerant Chara longifolia and Lamprothamnium sp. exhibit proton pump stimulation upon both turgor decrease and salinity increase, allowing the membrane PD to remain negative. The turgor is regulated through the inward K(+) rectifier and 2H(+)/Cl(-) symporter. Lamprothamnium plants can survive in hypersaline media up to twice seawater strength and withstand large sudden changes in salinity. Salt sensitive C. australis succumbs to 50-100 mM NaCl in few days. Cells exhibit no pump stimulation upon turgor decrease and at best transient pump stimulation upon salinity increase. Turgor is not regulated. The membrane PD exhibits characteristic noise upon exposure to salinity. Depolarization of membrane PD to excitation threshold sets off trains of action potentials, leading to further loses of K(+) and Cl(-). In final stages of salt damage the H(+)/OH(-) channels are thought to become the dominant transporter, dissipating the proton gradient and bringing the cell PD close to 0. The differences in transporter electrophysiology and their synergy under osmotic and/or saline stress in salt sensitive and salt tolerant characean cells are discussed in detail.

Keywords: Characeae; H+/OH- channels; action potentials; current-voltage characteristics; electrophysiology; non-selective cation channels; proton pump; salt tolerance.


Figures
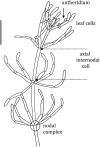
FIGURE 1
FIGURE 1
Chara australis male plant: each segment is a single cell. Both leaf cells and axial internodes can be excised from the plant for experiments. The excised cells survive and new plants regenerate from small cells (not shown) in each nodal complex. Only the axial internodes near the top of the plant grow. The male reproductive structures, antheridia, can be found at the base of the whorl and branch-let nodes. The bar represents 10 mm (drawn by Michelle Casanova – adapted from Figure 1.6 of Beilby and Casanova, 2013).
FIGURE 2
FIGURE 2
Different states of plasma membrane: central panel shows the membrane PD in different states as function of pHo and [K+]o (Ep reversal PD of the proton pump, EL reversal PD for the background/leak current, EK Nernst PD for K+, EH Nernst PD for H+ or OH-). The figure is based on Figure 1 (Beilby, 1990) with the I/V characteristics updated from later publications. Bottom panel: proton pump-dominated state at pHo of 4.5 ♦, 5.5 Δ, 6.5 □, and 7.5 • (Beilby, 1984). Ep is most negative at pHo 7–8 (shown as a dot on the “pump surface”) and tends toward EL at pH 4.5 (a point where the pump and background surfaces meet). Left panel: background state with 10 I/V runs summarized from nine cells exposed to DES (diethyl stilbestrol). These cells stabilized after 30 min DES exposure (shown by a point on the background surface). Four La3+-treated cells exposed to DES for 30 min, •, continued to change as shown by a single I/V run on La3+-treated cell, with DES exposure of I hr 15 min (Beilby, 1984). Top panel (Beilby, 1986): I/V characteristics of cells in K+ state, summary from seven cells in 5 mM K+ APW 10 mM K+ APW (the two points on K+ surface) and 0.1 mM K+ APW • (here the K+ channels closed revealing the background state, see the arrow in central part of figure). Right panel (Beilby and Bisson, 1992): high pH state: pH 11.5 (dotted line), pH 10.5 – two I/V runs in fast succession shown by black shading, pH 10.5 + 2.5 mM Na2SO4 (dashed line), back to pH 10.5 (dash, two dots, dash line), pH 10.5 + 10 mM Na2SO4 (dash dot dash line), and finally back to pH 10.5 (dash, three dots, dash line). The I/V characteristics in this state can be quite variable. As NaOH (5–30 mM) was used to bring the APW to high pH, the effect of Na+ concentration increase was explored. Beilby and Bisson (1992) did not find a consistent effect, but high concentrations might affect the H+/OH- channel activation via ROS response, see text.
FIGURE 3
FIGURE 3
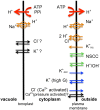
The transporter scheme for the characean cell: same types of transporters are found in both salt tolerant and salt sensitive genera. The energizing ATPases and PPases (red arrows) drive H+ out of the cytoplasm. The proton motive force is employed by Na+/H+ aniporters and 2H+/Cl- symporter, while negative PD opens K+ inward rectifier (orange arrows). In salt sensitive Characeae the pumps are not stimulated by low turgor and fail in saline media. In normal pond water NSCC channels bring in nutrients and H+/OH- channels aid photosynthesis by exporting OH- in alkaline bands (green arrows). In time of saline stress Na+ enters through NSCC channels in all Characeae, but salt tolerant Characeae keep the Na+/H+ antiporters going and prevent global opening of H+/OH- channels. The outward rectifier, the high conductance K+ channels or Ca2+ activated Cl- channels are not active in steady state (blue arrows). The inflow of Ca2+ into the cytoplasm (black arrows) at the time of AP or hypoosmotic regulation is well documented, but the sources (outside, internal stores in the cytoplasm or the vacuole) are still disputed and beyond the scope of this article. Similarly, there are K+ and Cl- transporters on the tonoplast (black arrows), but discussion of these is beyond the scope of this article. The Ca2+-activated Cl- channels provide the depolarizing phase of the AP with the outward rectifier contributing to the recovery of resting PD. In salt tolerant Characeae the Ca2+-activated Cl- channels and high conductance K+ channels mediate hypoosmotic regulation.
FIGURE 4
FIGURE 4
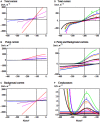
The response of the most conductive transporters in Lamprothamnium to medium salinity. (A) I/V characteristics of Lamprothamnium sp. in steady state, grown in media of increasing salinity: 0.2 seawater (SW), blue; 0.4 SW, purple; 0.5 SW, magenta; full SW, red. The currents have been fitted to data from 6 to 8 cells from each medium (adapted from Figure 6 of Beilby and Shepherd, 2001a). The fitted pump (B) and the background (C) current components are shown in same colors (for the fit parameters see Table 2 of Beilby and Shepherd, 2001a). The fitting of background current in media 0.4 – full SW was supported by comparison with cells in background state in each medium. (D) Characteristics from one Lamprothamnium cell acclimated to 0.2 SW and challenged by doubling salinity to 0.4 SW. Steady state I/V in 0.2 SW: black thick line; curve 1, magenta, 5 min of 0.4 SW; curve 2, red, 21 min of 0.4 SW; curve 3, orange, 41 min of 0.4 SW; curve 4, green, 2 h 34 min of 0.4 SW; curve 5, blue, 3 h 30 min of 0.4 SW (adapted from Figure 7 of Beilby and Shepherd, 2001a). The fitted pump and background current components (E) are shown in same colors. The conductances of the fitted current components, including the inward rectifier, are displayed in (F) also in same colors (for fit parameters see Table 3 of Beilby and Shepherd, 2001a).
FIGURE 5
FIGURE 5
Electrophysiology of the hypoosmotic regulation upon dilution step from 1/3 ASW to 1/6 ASW. (A) The I/V characteristics are compiled from currents fitted to cells with Cl- current blocked by exposure to LaCl3 or K+ current blocked by TEA at times: 3 min (dark blue); 10 min (red); 15 min (magenta); 20 min (green); 30 min (blue; Beilby and Shepherd, 1996, 2001b). (B) The fitted Cl- currents are shown with the same types of line as in (A). These currents appear with a slight delay after hypoosmotic exposure at 10 and 15 min, and start to decline at 20 min. (C) The fitted K+ currents are shown by the same types of line as in (A). They appear with a greater delay at 15 min, 20 min, and 30 min. (D) The fitted background currents at same times as in (A). Note the different scales in (A), (B), (C), and (D). While the K+ currents are smaller than the Cl- currents, they persist for a longer time, up to 60 min after hypoosmotic shock (the figure was adapted in color from Beilby and Casanova, 2013).
FIGURE 6
FIGURE 6
The extracellular mucilage produced by Lamprothamnium plants. Cells were stained with Alcian Blue at pH 1 (Beilby et al., 1999). (A) Apical cell growing in ¡ ASW with mucilage ∼7 μm thick. The staining is patchy, indicating that only fraction of the mucilage is sulphated. Bar = 50 μm. (B) Third internode from the apex from a plant growing in full ASW. Mucilage is ∼28 μm. Bar = 100 μm. (C) Seventh internode of the same plant as in (B), mucilage thickness is ∼43 μm. Bar = 100 μm (from Beilby and Casanova, 2013).
FIGURE 7
FIGURE 7
Salinity-induced noise in membrane PD. (A) Transition from Sorbitol APW (red) to 50 mM NaCl saline APW (blue) resulted in depolarization and noisy membrane PD. There was no AP, but the resting PD measurement was disrupted by medium change and exhibited spikes between 6800 and 6900 s. (B) Using the same trace on expanded time scale, the higher frequency noise was isolated by subtracting the running average (fitted with n = 100): noise in sorbitol APW (red) and saline-induced noise (blue) that started promptly after ∼50 s of the medium change (data from Beilby et al., 2014). (C) Spontaneous and repetitive APs after ∼80 min of Saline APW (Shepherd et al., 2008).
FIGURE 8
FIGURE 8
The response of Chara I/V characteristics to salinity challenge. (A) Pump-dominated profile (black) in Sorbitol APW evolved to background-dominated profile after 67 min in 50 mM NaCl Saline artificial pond water (APW; green) and to upwardly concave profile (red) after 117 min of Saline APW. The experimental data, shown as points in (A), were fitted by the pump or OH- channel models (B) and background current and inward rectifier models (C), using same line colors as in part (A). The parameters are given in caption of Figure 1 of Beilby and Al Khazaaly (2009). The dashed lines in (B) and (C) extrapolate the models beyond the range of the data. The inward rectifier channels also activate at more depolarized PDs, but the membrane PDs are more depolarized for K+ inflow to take place.
FIGURE 9
FIGURE 9
The effect of zinc ion on the high pH state and putative H+/OH- channels at the time of salinity stress. (A) Statistics of 12 I/V profiles from 5 cells in APW (black), APW with pH increased to 11 (blue), 1.0 mM ZnCl2 was then added to the high pH APW for average time of 36 min (red) and finally in three cells where 0.5 mM 2-mercaptoethanol (ME) replaced ZnCl2 for average 35 min after the high pH state was inhibited (green). The data were fitted with the pump current or the OH- current (B). The background current increased slightly after application of ZnCl2 (C). The fit parameters are given in Al Khazaaly and Beilby (2012). (D–F) The effect of zinc ion on salinity induced I/V profiles. (D) The profiles 1 and 2 (black) were obtained in APW and APW with 90 mM sorbitol. After 15–30 min of APW + 50 mM NaCl, the I/V profiles 3,4 just showed the background current (blue). The resting PD then dropped further and the I/V profiles 5 and 6 were modeled with OH- channels (blue). 1.0 mM ZnCl2 was added to the saline APW and the PD repolarized to the background current (I/Vs 7 and 8, red) and later the pump was re-activated (I/Vs 9 and 10, red). For details see Figures 2 and 4 of Al Khazaaly and Beilby (2012).

Similar articles

Cited by

References

    1. Al Khazaaly S., Beilby M. J. (2007). Modeling ion transporters at the time of hypertonic regulation Lamprothamnium succinctum (Characeae, Charophyceae). Charophytes 1 28–47.
    1. Al Khazaaly S., Beilby M. J. (2012). Zinc ion blocks H+/OH- channels in Chara australis Plant Cell Environ. 35 1380–1392 10.1111/j.1365-3040.2012.02496.x - DOI - PubMed
    1. Al Khazaaly S., Walker N. A., Beilby M. J., Shepherd V. A. (2009). Membrane potential fluctuations in Chara australis: a characteristic signature of high external sodium. Eur. Biophys. J. 39 167–174 10.1007/s00249-009-0485-2 - DOI - PubMed
    1. Allakhverdiev S. I., Murata N. (2008). Salt stress inhibits photosystems II and I in cyanobacteria. Photosynth. Res. 98 529–539 10.1007/s11120-008-9334-x - DOI - PubMed
    1. Allakhverdiev S. I., Sakamoto A., Nishiyama Y., Inaba M., Murata N. (2000). Ionic and osmotic effects of NaCl-induced inactivation of photosystems I and II in Synechococcus sp. Plant Physiol. 123 1047–1056 10.1104/pp.123.3.1047 - DOI - PMC - PubMed

LinkOut - more resources