. 2015 Jan 15;5(2):498-513.
eCollection 2015.

ART1 promotes starvation-induced autophagy: a possible protective role in the development of colon carcinoma

Affiliations

ART1 promotes starvation-induced autophagy: a possible protective role in the development of colon carcinoma

Yi Tang et al. Am J Cancer Res. .

Abstract

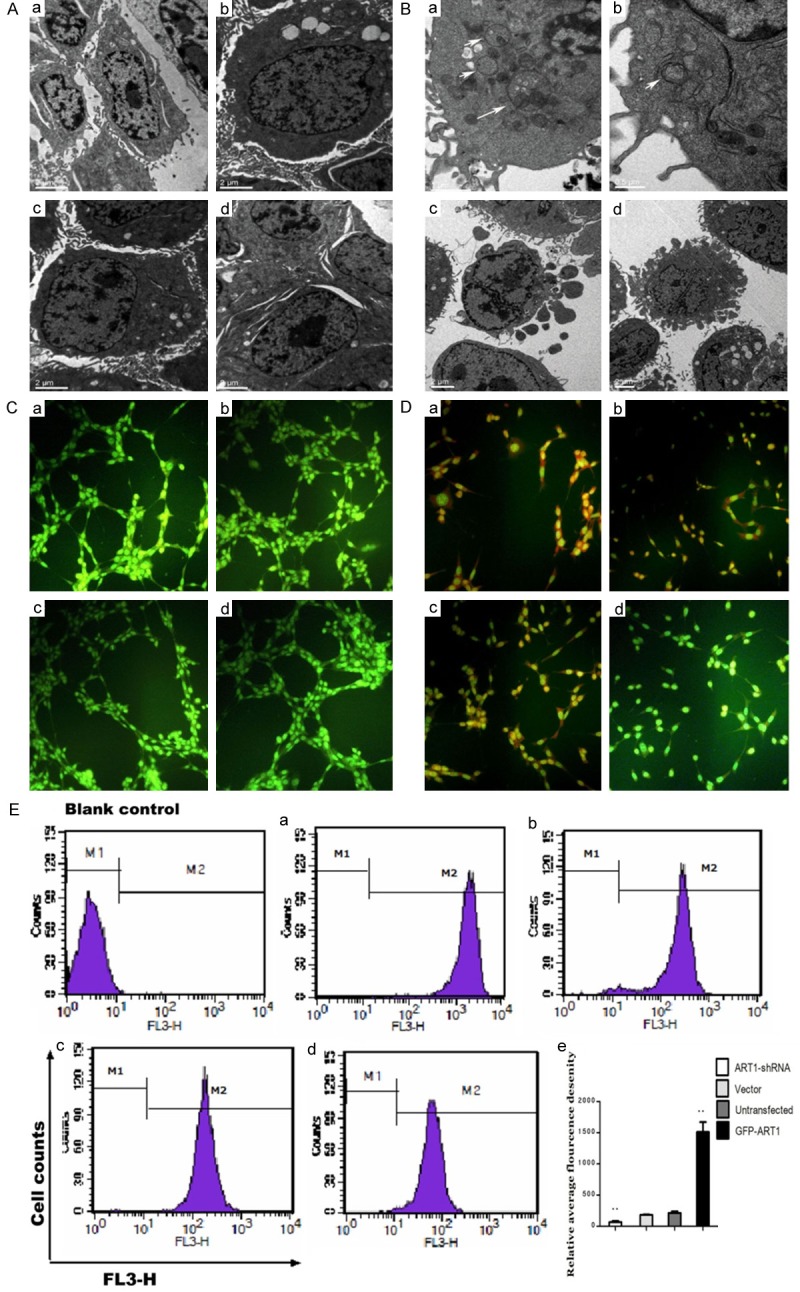
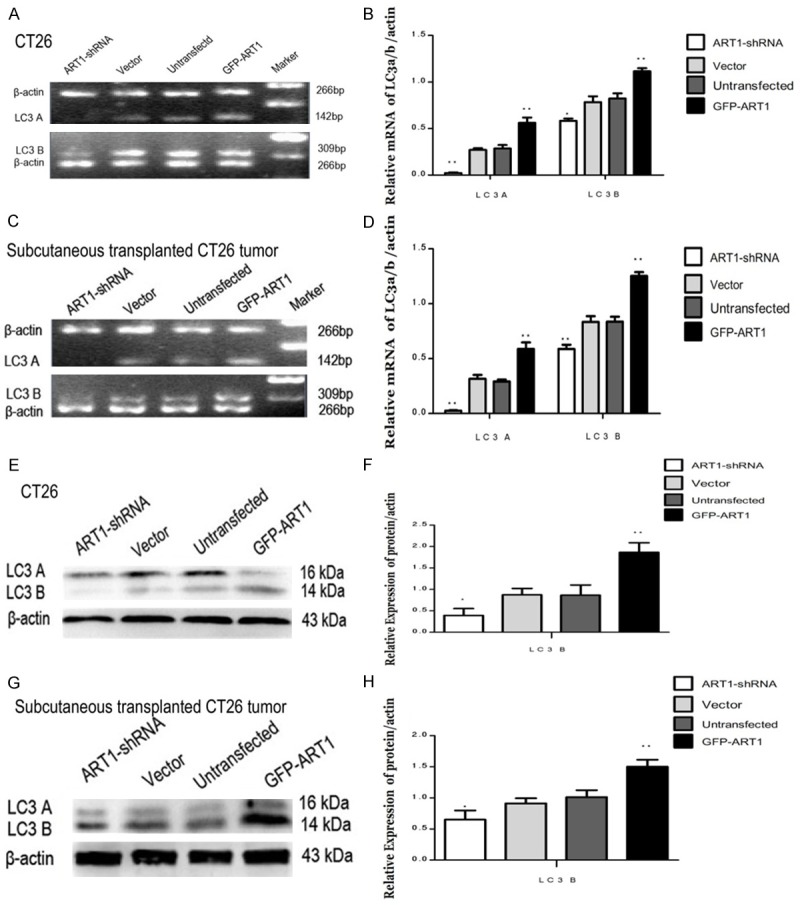
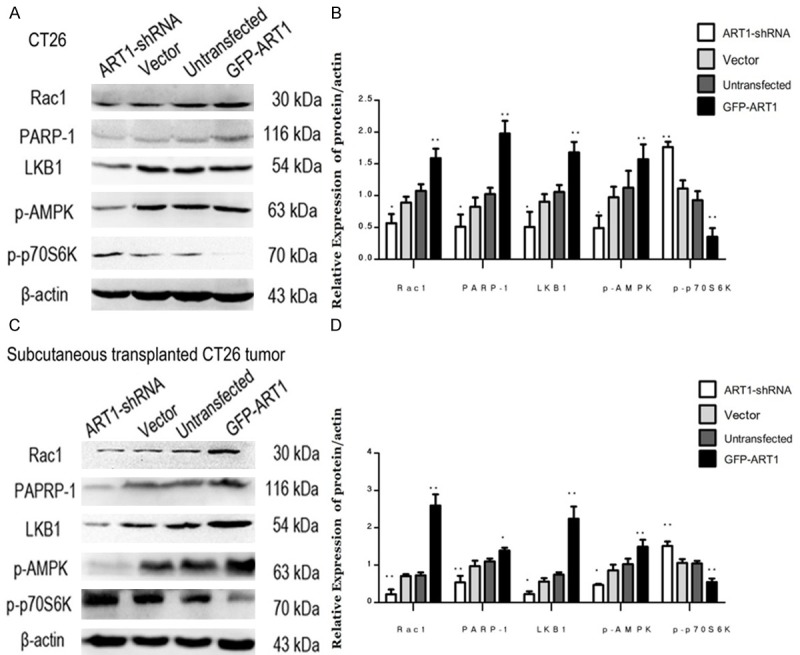
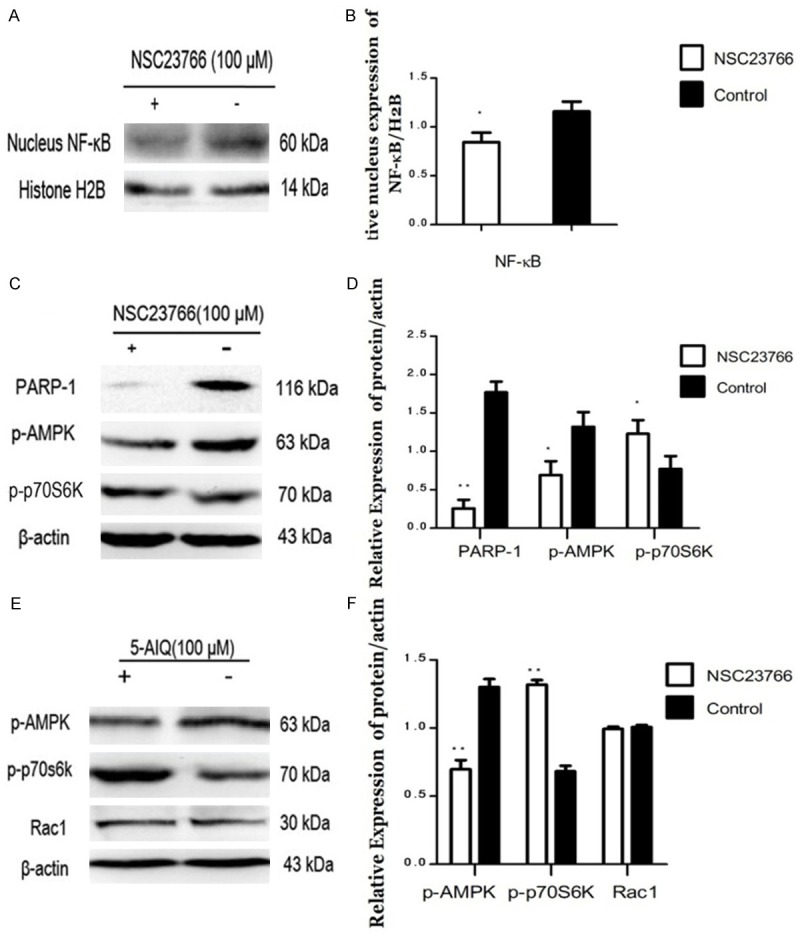
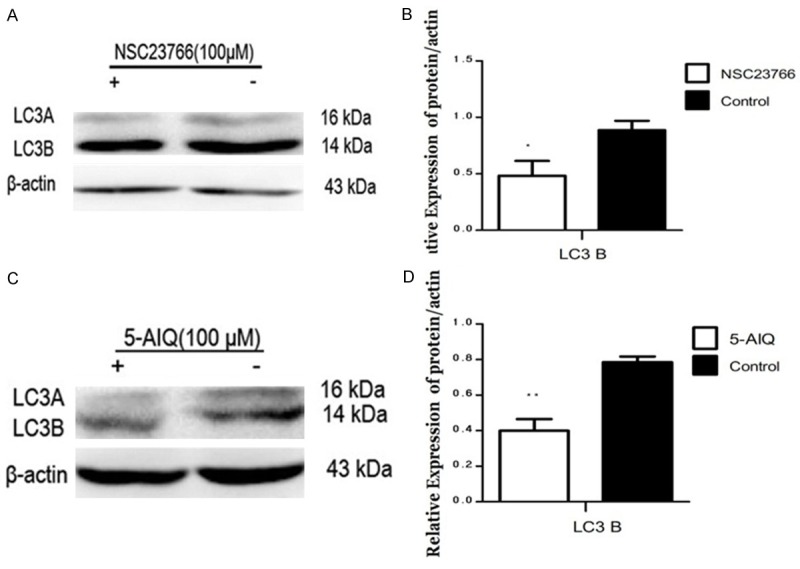
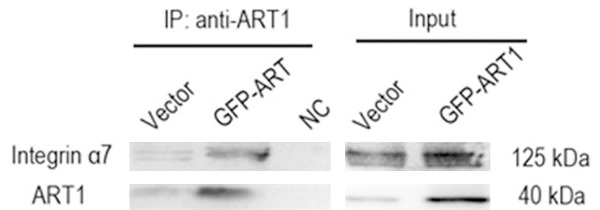
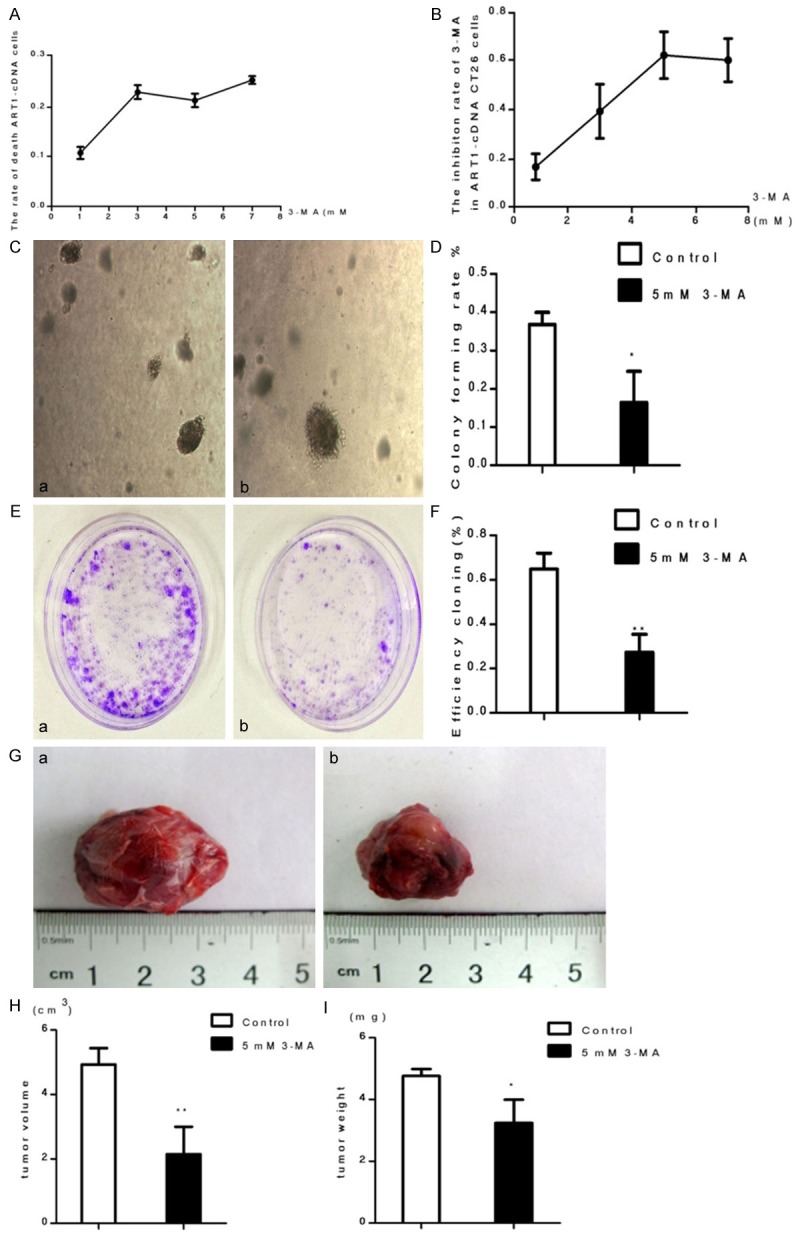
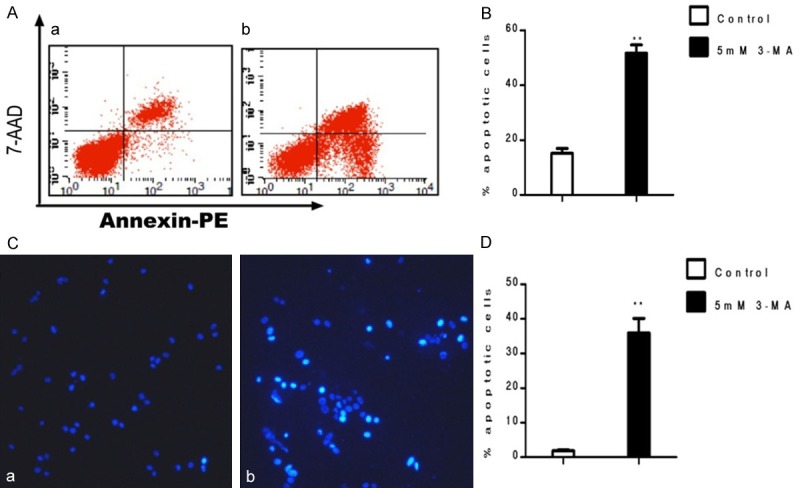
Autophagy plays a protective role in colorectal carcinoma. Arginine ADP-ribosyltransferase 1 (ART1) is an important mono-ADP-ribose transferase, which has been shown to play a role in biological processes such as proliferation and invasion of cancer cells. Interestingly, the role of ART1 in the regulation of autophagy is still not clear. We examined effects of overexpression or knockdown of ART1 by lentiviral transfection on starvation-induced autophagy of colon carcinoma CT26 cell lines in vivo and in vitro. The formation of autophagosome was detected by electron microscopy, acridine orange staining and expression of LC3 B. The molecular contributions of ART1 in regulation of autophagy were detected by western blotting or by co-immunoprecipitation. Additionally, inhibitors were used to study further the signaling pathway of ART1 in the regulation of autophagy. CCK8 assay, plate cloning assay, soft agar assay, examination of subcutaneous transplanted carcinoma in BALB/c mice, flow cytometry and Hoechst33342 staining were used to assess survival and apoptotic ability when starvation-induced autophagy modulated by ART1 was inhibited by 3-MA. Overexpression of ART1 promoted starvation-induced autophagy, which related to increases in the expression of Rac1, NF-κB, PARP-1, LKB1 and p-AMPK and a decrease in the expression of p-P70S6K. Correspondingly, knockdown of ART1 caused the opposite effects. ART1 also interacted with integrin α7. Additionally, changes of protein expressions were further validated following inhibition of Rac1 and PARP-1 in the starvation-induced ART1-GFP CT26 cells. Inhibition of ART1-stimulated starvation-induced autophagy restrained the growth and promoted apoptosis. ART1 is thus relevant in starvation-induced autophagy in colorectal carcinoma and may play essential roles in therapeutic anticancer strategies.

Keywords: ART1; Autophagy; apoptosis; colon carcinoma; proliferation.


Figures

Figure 1
Figure 1
The formation of autophgosome in starvation-induced CT26 cells. Autophagosome in CT26 cells which were untreated with starvation (A) or treated with starvation (B) observed with electron microscope. The white arrow denotes the autophagosome. In acridine orange staining, CT26 cells which were untreated with starvation only show green fluorescence (C); Starvation-induced CT26 cells show red fluorescence in GFP-ART1 group, Vector group, Untransfected group and ART1-shRNA group (D). The red fluorescence intensity was detected with flow cytometric analysis, and results show that red fluorescence intensity in GFP-ART1 group higher but in ART1-shRNA group lower than it in vector group and untransfected group (**P < 0.01) (E). a: GFP-ART1 group; b: Untransfected group; c: Vector group; d: ART1-shRNA group.
Figure 2
Figure 2
The changes of LC3A/B mediated by ART1 in vitro and vivo under starvation-induced conditions. In vitro and vivo, the mRNA level of LC3A/B was increased in GFP-ART1 group and was decreased in ART1-shRNA group, compare with control groups (A-D). The protein level of LC3A/B also was increased in GFP-ART1 group and was decreased in ART1-shRNA group, compared with control groups (E-H). (*P < 0.05; **P < 0.01).
Figure 3
Figure 3
Expressions of Rac1, PARP, LKB1, p-AMPK, and p-P70S6k change with ART1 in vivo and vitro under starvation-induced conditions. Expressions of Expressions of Rac1, PARP, LKB1 and p-AMPK in GFP-ART1 CT26 cells higher than control groups and these in ART1-shRNA CT26 cells lower than control groups; the expression of p-p70S6K show counter-roductive result (A & B). Expressions of Rac1, PARP, LKB1, p-AMPK and p-p70S6K in subcutaneoustransplanted CT26 tumor fall in line with CT26 cells finding (C & D) (*P < 0.05; **P < 0.01).
Figure 5
Figure 5
Effects of inhibitor of Rac1 or PARP-1 on regulating NF-κB, PARP-1, p-AMPK andp-p70S6K in GFP-ART1 CT26 cells under starvation-induced conditions. The expression of NF-κB in nucleus decreased in GFP-ART1 CT26 cells which treated with inhibitor of Rac1, NSC23766 (*P < 0.05) (A & B). The expressions of PARP-1 and p-AMPK reduce and the expression of p-p70S6K increase in the GFP-ART1 CT26 cells which treated with NSC23766 (*P < 0.05) (C & D). After being treated with inhibitor of PARP-1, 5-AIQ, the expression of p-AMPK also decreased and the expression of p-p70S6K increased, compared with GFP-ART1 without 5-AIQ (**P < 0.01) (E & F).
Figure 4
Figure 4
Effect of inhibitor of PAPR-1 or Rac1 on regulating LC3B in GFP-ART1 CT26 cells under starvation-induced conditions. After being disposed with NSC23766 (**P < 0.01) (A & B) and 5-AIQ (*P < 0.05) (C & D) respectively, the expression of LC3 B in GFP-ART1 CT26 cells both decreased compared with GFP-ART1 group without inhibitor.
Figure 6
Figure 6
Integrin α7 interacts with ART1 in CT26 cells. Western blot analysis of the co-IP complex following incubation of GFP-ART1 CT26 cells and Vector CT26 cells lysates with ART1 antibody. Integrin α7 was obviously detected in IP product of GFP-ART1 group. NC; negative control group used IgG instead of ART1 antibody to incubate the lysate of GFP-ART1 CT26 cells.
Figure 7
Figure 7
The ability of growth in GFP-ART1 CT26 cells was inhibited by 3-MA under starvatvation-induced conditions. The growth inhibite ratio of GFP-ART1 cells,which detected with CCK-8, increase along with the increasing concentration of 3-MA (*P < 0.05) (A). Cell counting with trypanblau dying show the rate of GFP-ART1 cells death with different concentrations 3-MA (3 mM, 5 mM and 7 mM) was not statistically significant (p > 0.05) (B). Compared to GFP-ART1 untreated 3-MA, the growth ability of GFP-ART1 CT26 cells decrease in 3-MA treated group, which detected with soft agar assay (*P < 0.05) (C & D) and plate cloning assay (**P < 0.01) (E & F) respectively. The weithgt (*P < 0.05) and volume of subcutaneous tumor (**P < 0.01) in BALB/c mice show smaller in 3-MA treated BALB/c mice than control BALB/c mice which untreated with 3-MA (G-I).
Figure 8
Figure 8
Apoptosis of GFP-ART1 CT26 cells was promoted by 3-MA under starvation-induced conditions. Compared to the contol group, the increase of apoptosis rate detecting by FCM show in 5 mM 3-MA teated GFP-ART1 CT26 celll (**P < 0.01) (A & B). The increase rate of apoptotic bodies and condensed chromatin detectig with Hochest 3342 show in 3-MA treated group which compared with control group (**P < 0.01) (C & D).

References

    1. Mizushima N. Autophagy: process and function. Genes Dev. 2007;21:2861–2873. - PubMed
    1. Levine B, Klionsky DJ. Development by self-digestion: molecular mechanisms and biological functions of autophagy. Developmental cell. 2004;6:463–477. - PubMed
    1. Kabeya Y, Mizushima N, Ueno T, Yamamoto A, Kirisako T, Noda T, Kominami E, Ohsumi Y, Yoshimori T. LC3, a mammalian homologue of yeast Apg8p, is localized in autophagosome membranes after processing. EMBO J. 2000;19:5720–5728. - PMC - PubMed
    1. Levine B, Kroemer G. Autophagy in the pathogenesis of disease. Cell. 2008;132:27–42. - PMC - PubMed
    1. Eskelinen EL. The dual role of autophagy in cancer. Curr Opin Pharmacol. 2011;11:294–300. - PubMed

LinkOut - more resources