. 2015 Jan 15;5(2):560-74.
eCollection 2015.

Prominin-1 (CD133, AC133) and dipeptidyl-peptidase IV (CD26) are indicators of infinitive growth in colon cancer cells

Affiliations

Prominin-1 (CD133, AC133) and dipeptidyl-peptidase IV (CD26) are indicators of infinitive growth in colon cancer cells

Thomas W Grunt et al. Am J Cancer Res. .

Abstract

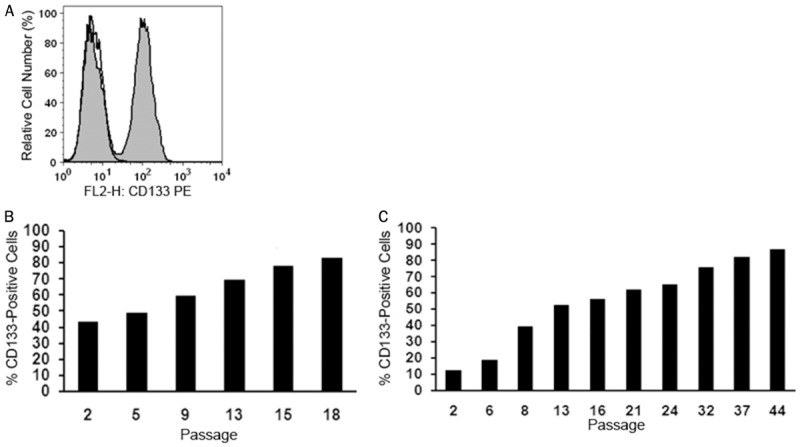
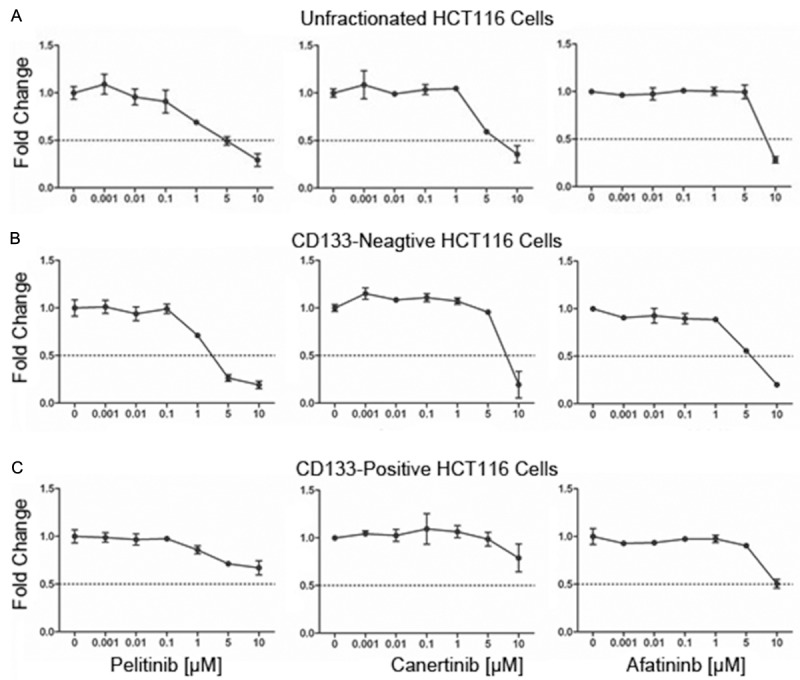
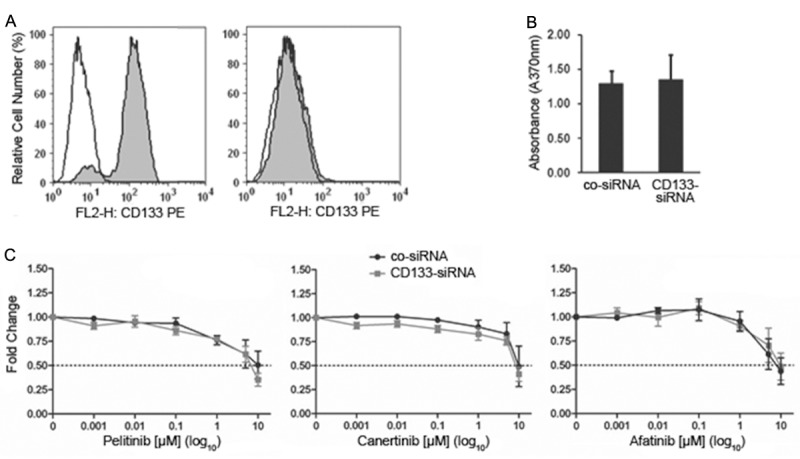
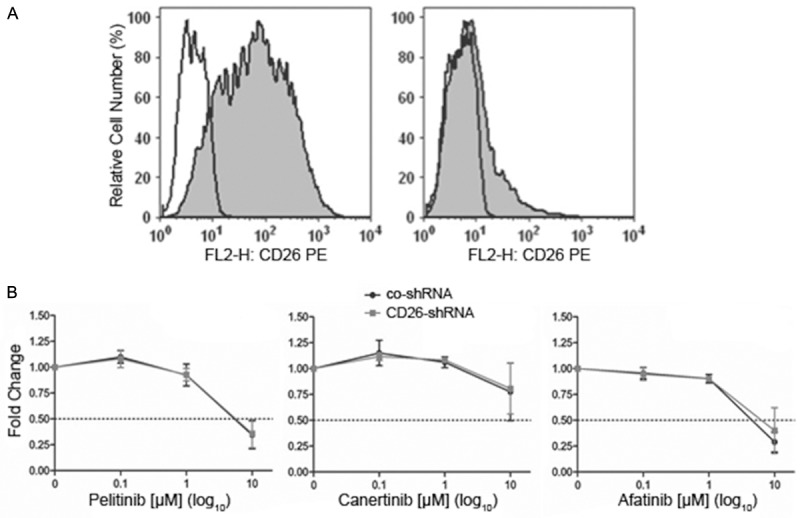
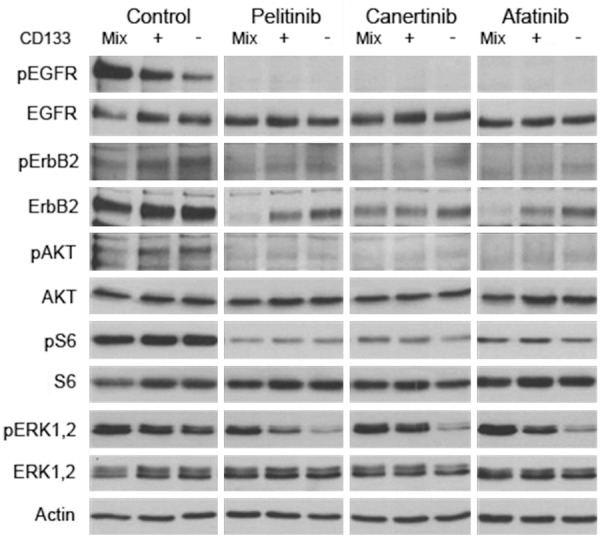
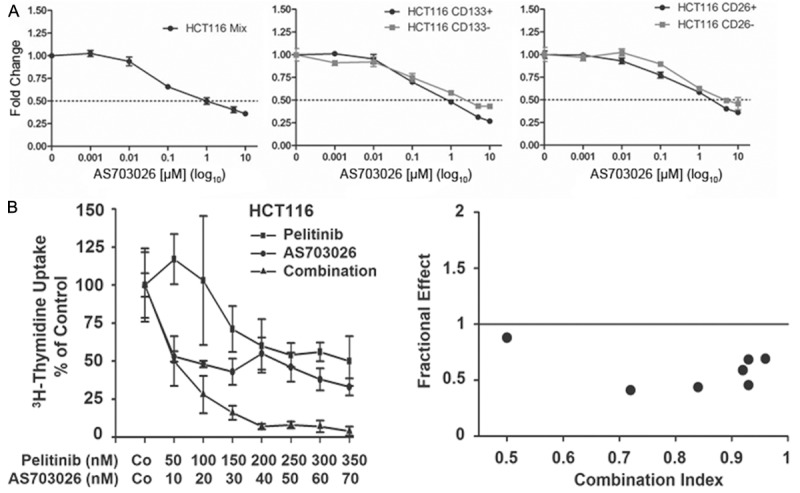
Advanced colorectal cancer is characterized by uncontrolled growth and resistance against anti-cancer agents, including ErbB inhibitors. Recent data suggest that cancer stem cells (CSC) are particularly resistant. These cells may reside within a CD133+ fraction of the malignant cells. Using HCT116 cells we explored the role of CD133 and other CSC markers in drug resistance in colon cancer cells. CD133+ cells outnumbered CD133- cells over time in long-term culture. Both populations displayed the KRAS mutation 38G > A and an almost identical target profile, including EGFR/ErbB1, ErbB2, and ErbB4. Microarray analyses and flow cytometry identified CD26 as additional CSC marker co-expressed on CD133+ cells. However, knock-down of CD133 or CD26 did not affect short-term growth of HCT116 cells, and both cell-populations were equally resistant to various targeted drugs except irreversible ErbB inhibitors, which blocked growth and ERK1/2 phosphorylation in CD133- cells more efficiently than in CD133+ cells. Moreover, the MEK inhibitor AS703026 was found to overcome resistance against ErbB blockers in CD133+ cells. Together, CD133 and CD26 are markers of long-term growth and resistance to ErbB blockers in HCT116 cells, which may be mediated by constitutive ERK activity.

Keywords: CD133; CD26; Cancer stem cell; DPPIV; EGFR/ErbB; HCT116; colon cancer; drug resistance.


Figures

Figure 1
Figure 1
Long-term growth advantage of CD133+ HCT116 colon cancer cells. (A) Immunofluorescent labeling for CD133 followed by flow cytometry clearly distinguished a CD133+ from a CD133- cell population (grey histogram). An isotype-matched non-immune antibody was used as negative control (open histogram). Unfractionated cells (B) and sorted CD133- cells (C) were subcultured for the indicated number of passages and the proportion of outgrowing CD133+ cells was determined over time by flow cytometry in each cell population.
Figure 2
Figure 2
CD133+ HCT116 colon cancer cells are less sensitive to growth inhibition by the irreversible ErbB inhibitors pelitinib, canertinib, and afatinib as determined by MTT assay. Unfractionated (A), sorted CD133- (B) or CD133+ cells (C) were incubated for 72 hours with indicated concentrations of pelitinib, canertinib or afatinib. In vehicle control (0.1% DMSO), optical density, which is proportional to cell number, has been arbitrarily set at 1 and values from treated cultures have been related to control and are given as ‘fold change’. Means ± SD, n = 3.
Figure 3
Figure 3
Knockdown of CD133 in CD133+ HCT116 colon cancer cells does not affect cell growth and ErbB drug resistance. (A) Flow cytometry analysis revealed that sorted CD133+ cells transfected with a non-targeting control siRNA retain high levels of CD133 (left panel), whereas a CD133-targeting siRNA causes complete knockdown of CD133 (right panel). (B) Growth of the sorted CD133+ cell population transfected either with non-targeting control siRNA (co-siRNA) or with CD133 siRNA was determined by BrdU colorimetric incorporation assay. (C) Sorted CD133+ cells transfected with non-targeting control siRNA (co-siRNA) or with CD133 siRNA were incubated for 72 hours with the indicated concentrations of the irreversible ErbB inhibitors pelitinib, canertinib or afatinib and then subjected to an MTT assay. In vehicle control (0.1% DMSO), optical density, which is proportional to cell number, has been arbitrarily set at 1 and values from treated cultures have been related to control and are given as ‘fold change’. Means ± SD, n = 3.
Figure 4
Figure 4
Knockdown of CD26 in CD133+ HCT116 colon cancer cells does not affect cell growth and ErbB drug resistance. (A) Flow cytometry analysis revealed that introduction of a non-targeting control shRNA into CD133+ cells does not lower the expression of CD26 (left panel), whereas a CD26-targeting shRNA causes strong downregulation of CD26 (right panel). (B) Sorted CD133+ cells transfected with non-targeting control shRNA (co-shRNA) or with CD26 shRNA were incubated for 72 hours with the indicated concentrations of the irreversible ErbB inhibitors pelitinib, canertinib or afatinib and then subjected to an MTT assay. In vehicle control (0.1% DMSO), optical density, which is proportional to cell number, has been arbitrarily set at 1 and values from treated cultures have been related to control and are given as ‘fold change’. Means ± SD, n = 3.
Figure 5
Figure 5
Effects of a 24-hours exposure of bulk HCT116 colon cancer cells (Mix) and of sorted CD133+ or CD133- cells to the irreversible ErbB inhibitors pelitinib, canertinib, or afatinib on the expression of phosphorylated (p) and total forms of EGFR, ErbB2, AKT, S6, and ERK1,2 as determined by Western blot analysis. Note that ErbB inhibitors lower pERK1/2 levels specifically in ErbB drug sensitive CD133- cells, but not in bulk or in CD133+ cells.
Figure 6
Figure 6
Effect of the MEK inhibitor AS703026 on the growth and the ErbB drug resistance of HCT116 colon cancer cells. (A) Unfractionated (left panel, Mix), sorted CD133+ and CD133- (middle panel), and sorted CD26+ and CD26- cells (right panel) were incubated for 72 hours with the indicated concentrations of AS703026 and then subjected to an MTT assay. In vehicle control (0.1% DMSO), optical density, which is proportional to cell number, has been arbitrarily set at 1 and values from treated cultures have been related to control and are given as ‘fold change’. Means ± SD, n = 3. (B) Bulk cells were incubated with the indicated concentrations of pelitinib, AS703026 or a combination of both drugs held at a fixed concentration-ratio of 5:1 for 48 hours and DNA synthesis was measured by 3H-thymidine uptake. Results are expressed as percent of control and represent the mean ± SD of triplicate determinations (left panel). Moreover, the combination index for exposure to pelitinib along with AS703026 is given (right panel). An index of <1 indicates synergistic drug interaction.

References

    1. Hegde SR, Sun W, Lynch JP. Systemic and targeted therapy for advanced colon cancer. Expert Rev Gastroenterol Hepatol. 2008;2:135–149. - PubMed
    1. Gralow J, Ozols RF, Bajorin DF, Cheson BD, Sandler HM, Winer EP, Bonner J, Demetri GD, Curran W Jr, Ganz PA, Kramer BS, Kris MG, Markman M, Mayer RJ, Raghavan D, Ramsey S, Reaman GH, Sawaya R, Schuchter LM, Sweetenham JW, Vahdat LT, Davidson NE, Schilsky RL, Lichter AS American Society of Clinical Oncology. Clinical cancer advances 2007: major research advances in cancer treatment, prevention, and screening-a report from the American Society of Clinical Oncology. J. Clin. Oncol. 2008;26:313–325. - PubMed
    1. Jemal A, Siegel R, Ward E, Murray T, Xu J, Thun MJ. Cancer statistics, 2007. CA Cancer J Clin. 2007;57:43–66. - PubMed
    1. Wils J. Adjuvant treatment of colon cancer: past, present and future. J Chemother. 2007;19:115–122. - PubMed
    1. Jass JR. Pathogenesis of colorectal cancer. Surg Clin North Am. 2002;82:891–904. - PubMed

LinkOut - more resources