

Differentiation of metastatic vs degenerative joint disease using semi-quantitative analysis with (18)F-NaF PET/CT in castrate resistant prostate cancer patients
- PMID: 25973337
- PMCID: PMC4396008
Differentiation of metastatic vs degenerative joint disease using semi-quantitative analysis with (18)F-NaF PET/CT in castrate resistant prostate cancer patients
Abstract
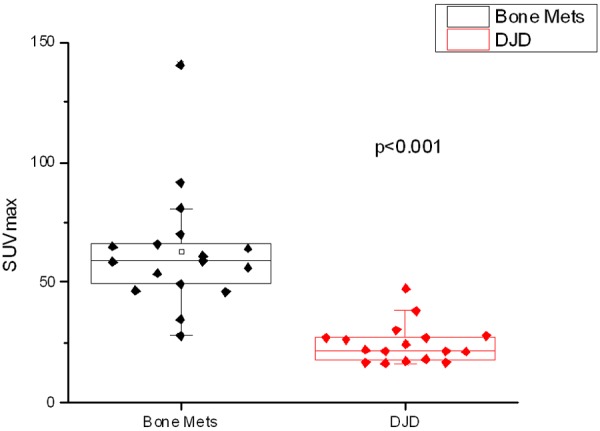
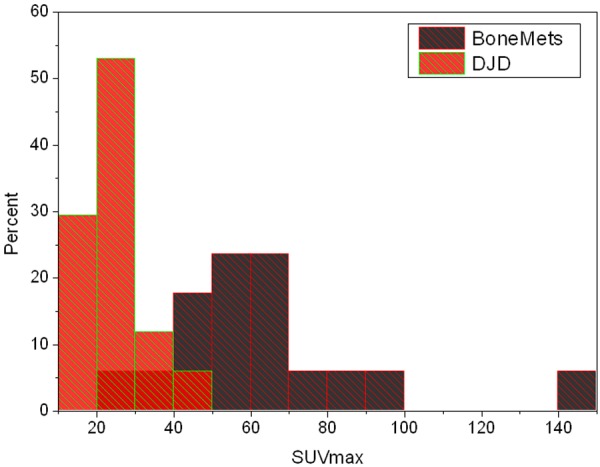
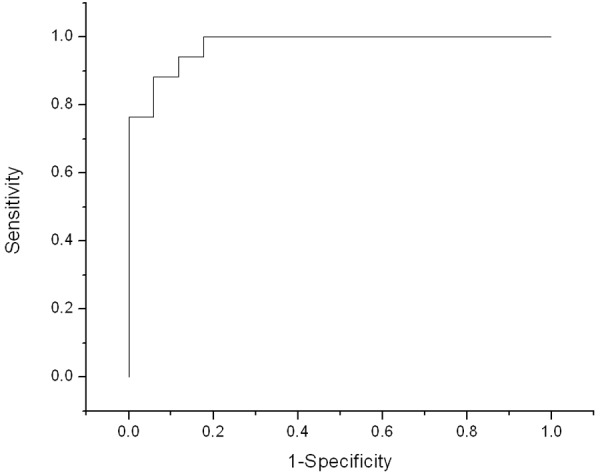
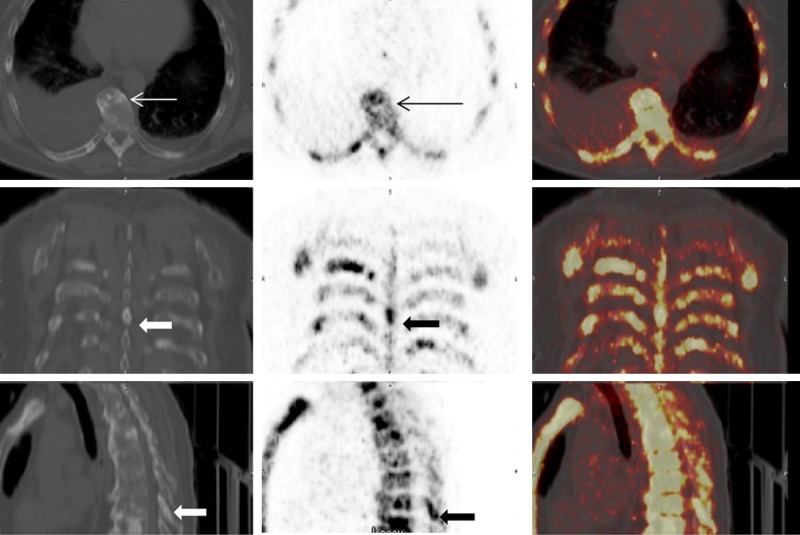
Fluorine 18 Sodium Fluoride ((18)F-NaF) (sodium fluoride) PET/CT is a highly sensitive but is a non-specific method for identifying bone metastases. Qualitative scan interpretation using low dose CT for lesion localization is often complicated by the presence of co-existing degenerative joint disease (DJD). A semi-quantitative analysis might help in accurately differentiating benign from metastatic osseous lesions. The aim of the study was to evaluate the clinical utility of (18)F-NaF PET/CT in differentiating DJD from metastatic disease in the skeleton using a qualitative analysis as well as a semi-quantitative approach using the SUVmax and to determine if there is an upper limit of SUVmax value that can reliably differentiate metastases from DJD. Baseline (18)F-NaF PET/CT scans were performed for 17 castrate resistant prostate cancer patients (CRPC). A qualitative as well as semi-quantitative analysis using maximum standardized uptake value (SUVmax) based on body weight was performed for 65 metastatic and 56 DJD sites identified on the low dose CT scan acquired as a part of whole body PET/CT scan. The SUVmax range in DJD was 2.6-49.9 (mean: 6.2). The SUVmax range for metastatic lesions was 11.2-188 (mean: 160). The SUVmax value for metastatic as well as areas of DJD showed significant variation during treatment. Bone metastases showed statistically significantly higher SUVmax than DJD using a mixed effect regression model. ROC/AUC analysis was performed based on averaging the SUVs over all lesions in each subject. The AUC was found to be fairly high at 0.964 (95% CI: 0.75-0.996). The SUVmax over 50 always represented a bone metastasis and below 12 always represented a site of DJD. The results of our preliminary data show that semi-quantitative analysis is complementary to the qualitative analysis in accurately identifying DJD from metastatic disease. The cut-off SUVmax of 50 can help in differentiating DJD from bone metastases.
Keywords: F-18 NaF; PET/CT; bone metastases; castrate resistant prostate cancer; degenerative joint disease.
Figures

References
-
- Padhani A, Husband J. Bone metastases. In: Husband JES, Reznek RH, editors. Imaging in Oncology. Oxford, U.K.: Isis Medical Media Ltd; 1998. pp. 765–787.
-
- Even-Sapir E, Metser U, Mishani E, Lievshitz G, Lerman H, Leibovitch I. The detection of bone metastases in patients with high-risk prostate cancer: 99mTc-MDP planar bone scintigraphy, single- and multi-field-of-view SPECT, 18FfluoridePET, and 18F-fluoride PET/CT. J Nucl Med. 2006;47:287–297. - PubMed
-
- Rybak LD, Rosenthal DI. Radiological imaging for the diagnosis of bone metastases. Q J Nucl Med. 2001;45:53–64. - PubMed
-
- Schirrmeister H, Guhlnamm A, Kotzerke J, Santjohanser C, Kühn T, Kreienberg R, Messer P, Nüssle K, Elsner K, Glatting G, Träger H, Neumaier B, Diederichs C, Reske SN. Early detection and accurate description of extent of metastatic bone disease in breast cancer with fluoride ion and positron emission tomography. J. Clin. Oncol. 1999;17:2381–2389. - PubMed
-
- Hamaoka T, Madewell JE, Podoloff DA, Hortobagyi GN, Ueno NT. Bone imaging in metastatic breast cancer. J. Clin. Oncol. 2004;22:2942–2953. - PubMed
Grants and funding
LinkOut - more resources
Full Text Sources