

Adipocyte SIRT1 knockout promotes PPARγ activity, adipogenesis and insulin sensitivity in chronic-HFD and obesity
- PMID: 25973386
- PMCID: PMC4421024
- DOI: 10.1016/j.molmet.2015.02.007
Adipocyte SIRT1 knockout promotes PPARγ activity, adipogenesis and insulin sensitivity in chronic-HFD and obesity
Abstract
Objective: Adipose tissue is the primary site for lipid deposition that protects the organisms in cases of nutrient excess during obesogenic diets. The histone deacetylase Sirtuin 1 (SIRT1) inhibits adipocyte differentiation by targeting the transcription factor peroxisome proliferator activated-receptor gamma (PPARγ).
Methods: To assess the specific role of SIRT1 in adipocytes, we generated Sirt1 adipocyte-specific knockout mice (ATKO) driven by aP2 promoter onto C57BL/6 background. Sirt1 (flx/flx) aP2Cre (+) (ATKO) and Sirt1 (flx/flx) aP2Cre (-) (WT) mice were fed high-fat diet for 5 weeks (short-term) or 15 weeks (chronic-term). Metabolic studies were combined with gene expression analysis and phosphorylation/acetylation patterns in adipose tissue.
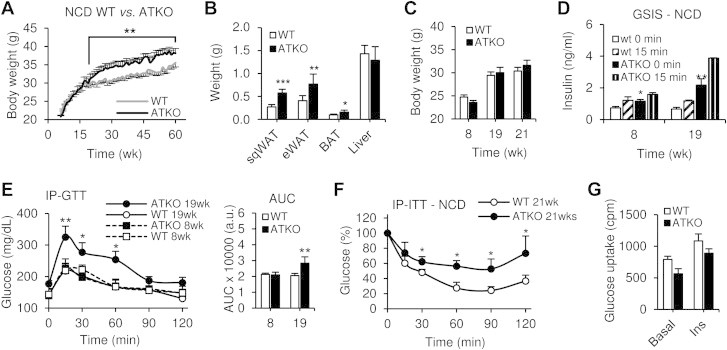
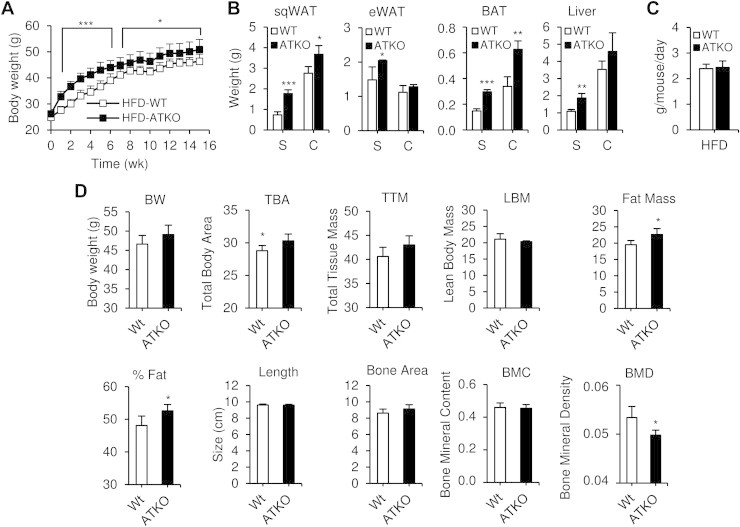
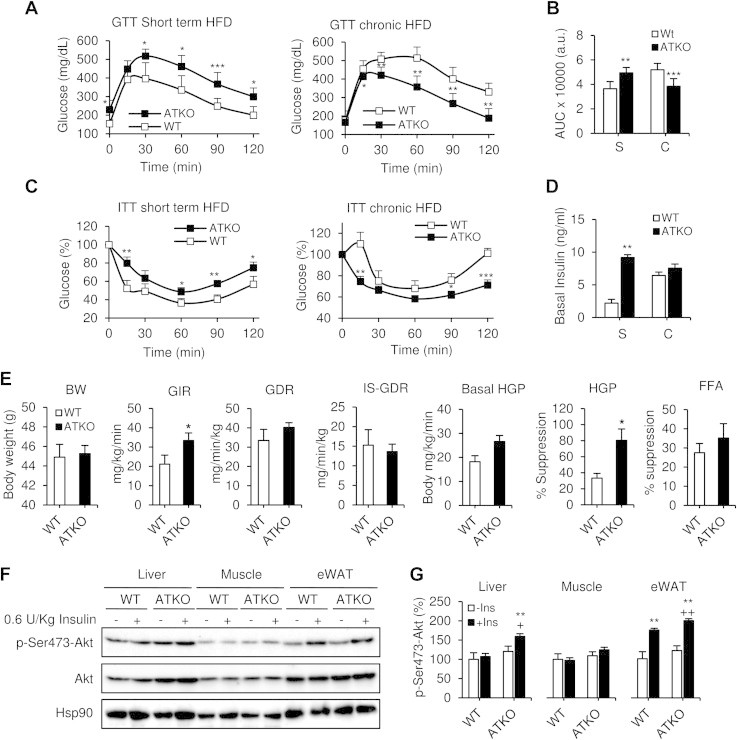
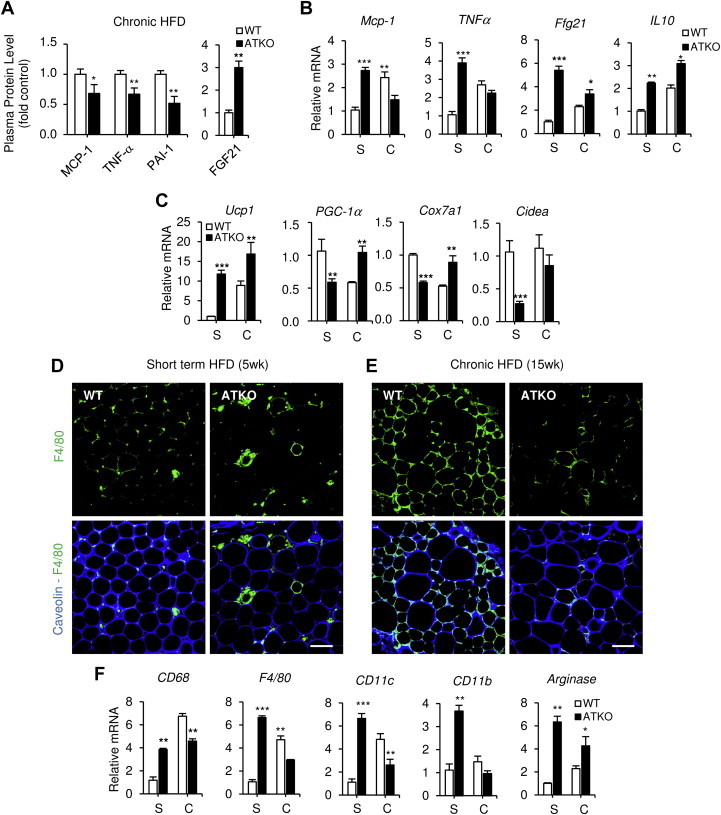
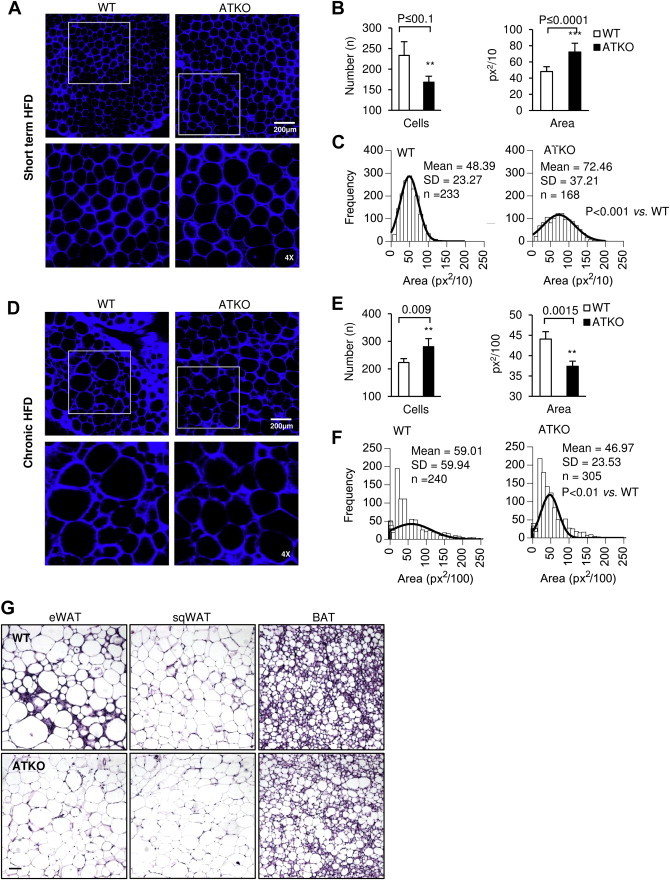
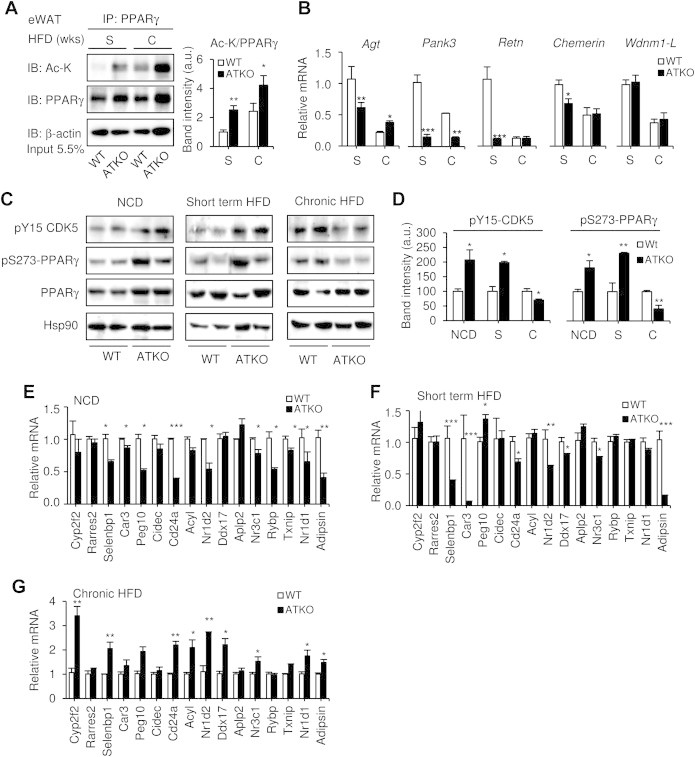
Results: On standard chow, ATKO mice exhibit low-grade chronic inflammation in adipose tissue, along with glucose intolerance and insulin resistance compared with control fed mice. On short-term HFD, ATKO mice become more glucose intolerant, hyperinsulinemic, insulin resistant and display increased inflammation. During chronic HFD, WT mice developed a metabolic dysfunction, higher than ATKO mice, and thereby, knockout mice are more glucose tolerant, insulin sensitive and less inflamed relative to control mice. SIRT1 attenuates adipogenesis through PPARγ repressive acetylation and, in the ATKO mice adipocyte PPARγ was hyperacetylated. This high acetylation was associated with a decrease in Ser273-PPARγ phosphorylation. Dephosphorylated PPARγ is constitutively active and results in higher expression of genes associated with increased insulin sensitivity.
Conclusion: Together, these data establish that SIRT1 downregulation in adipose tissue plays a previously unknown role in long-term inflammation resolution mediated by PPARγ activation. Therefore, in the context of obesity, the development of new therapeutics that activate PPARγ by targeting SIRT1 may provide novel approaches to the treatment of T2DM.
Keywords: Glucose homeostasis; Insulin resistance; Obesity; PPAR03B3; Phosphorylation; SIRT1.
Figures


Similar articles
-
CD38 deficiency suppresses adipogenesis and lipogenesis in adipose tissues through activating Sirt1/PPARγ signaling pathway.J Cell Mol Med. 2018 Jan;22(1):101-110. doi: 10.1111/jcmm.13297. Epub 2017 Aug 16. J Cell Mol Med. 2018. PMID: 28816006 Free PMC article.
-
Cystathionine γ lyase-hydrogen sulfide increases peroxisome proliferator-activated receptor γ activity by sulfhydration at C139 site thereby promoting glucose uptake and lipid storage in adipocytes.Biochim Biophys Acta. 2016 May;1861(5):419-29. doi: 10.1016/j.bbalip.2016.03.001. Epub 2016 Mar 2. Biochim Biophys Acta. 2016. PMID: 26946260
-
Impact of increased PPARgamma activity in adipocytes in vivo on adiposity, insulin sensitivity and the effects of rosiglitazone treatment.Endocr J. 2008 Aug;55(4):767-76. doi: 10.1507/endocrj.k08e-018. Epub 2008 May 28. Endocr J. 2008. PMID: 18506083
-
Adipogenesis and lipotoxicity: role of peroxisome proliferator-activated receptor gamma (PPARgamma) and PPARgammacoactivator-1 (PGC1).Public Health Nutr. 2007 Oct;10(10A):1132-7. doi: 10.1017/S1368980007000614. Public Health Nutr. 2007. PMID: 17903321 Review.
-
Lipid Storage, Lipolysis, and Lipotoxicity in Obesity.Adv Exp Med Biol. 2024;1460:97-129. doi: 10.1007/978-3-031-63657-8_4. Adv Exp Med Biol. 2024. PMID: 39287850 Review.
Cited by
-
In Search of New Therapeutic Targets in Obesity Treatment: Sirtuins.Int J Mol Sci. 2016 Apr 19;17(4):572. doi: 10.3390/ijms17040572. Int J Mol Sci. 2016. PMID: 27104517 Free PMC article. Review.
-
Obesity under the moonlight of c-MYC.Front Cell Dev Biol. 2023 Dec 5;11:1293218. doi: 10.3389/fcell.2023.1293218. eCollection 2023. Front Cell Dev Biol. 2023. PMID: 38116204 Free PMC article. Review.
-
Management of Obesity and Obesity-Related Disorders: From Stem Cells and Epigenetics to Its Treatment.Int J Mol Sci. 2023 Jan 24;24(3):2310. doi: 10.3390/ijms24032310. Int J Mol Sci. 2023. PMID: 36768633 Free PMC article. Review.
-
Epigenetic Regulation of Adipogenesis in Development of Metabolic Syndrome.Front Cell Dev Biol. 2021 Jan 12;8:619888. doi: 10.3389/fcell.2020.619888. eCollection 2020. Front Cell Dev Biol. 2021. PMID: 33511131 Free PMC article. Review.
-
Protein posttranslational modifications in metabolic diseases: basic concepts and targeted therapies.MedComm (2020). 2024 Sep 30;5(10):e752. doi: 10.1002/mco2.752. eCollection 2024 Oct. MedComm (2020). 2024. PMID: 39355507 Free PMC article. Review.
References
-
- Johnson A.M., Olefsky J.M. The origins and drivers of insulin resistance. Cell. 2013;152(4):673–684. - PubMed
-
- Olefsky J.M., Glass C.K. Macrophages, inflammation, and insulin resistance. Annual Review of Physiology. 2010;72:219–246. - PubMed
-
- Rodgers J.T., Lerin C., Haas W., Gygi S.P., Spiegelman B.M., Puigserver P. Nutrient control of glucose homeostasis through a complex of PGC-1alpha and SIRT1. Nature. 2005;434(7029):113–118. - PubMed
Grants and funding
LinkOut - more resources
Full Text Sources
Other Literature Sources
Molecular Biology Databases
Research Materials
