. 2015 May 14:5:10194.
doi: 10.1038/srep10194.

Inhibition of STAT3, FAK and Src mediated signaling reduces cancer stem cell load, tumorigenic potential and metastasis in breast cancer

Affiliations

Inhibition of STAT3, FAK and Src mediated signaling reduces cancer stem cell load, tumorigenic potential and metastasis in breast cancer

Ravi Thakur et al. Sci Rep. .

Abstract

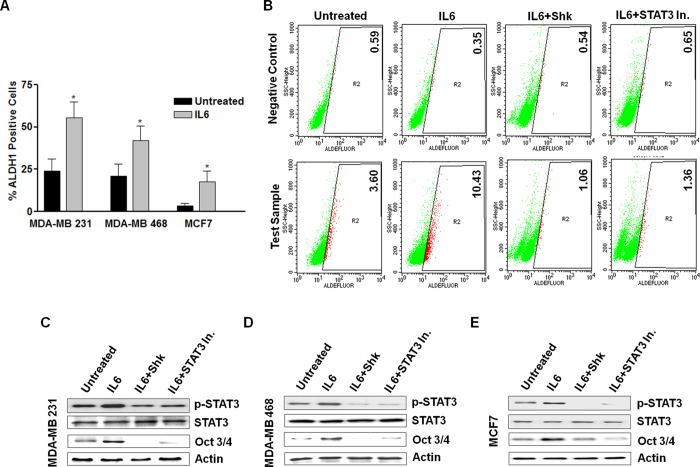
Cancer stem cells (CSCs) are responsible for aggressive tumor growth, metastasis and therapy resistance. In this study, we evaluated the effects of Shikonin (Shk) on breast cancer and found its anti-CSC potential. Shk treatment decreased the expression of various epithelial to mesenchymal transition (EMT) and CSC associated markers. Kinase profiling array and western blot analysis indicated that Shk inhibits STAT3, FAK and Src activation. Inhibition of these signaling proteins using standard inhibitors revealed that STAT3 inhibition affected CSCs properties more significantly than FAK or Src inhibition. We observed a significant decrease in cell migration upon FAK and Src inhibition and decrease in invasion upon inhibition of STAT3, FAK and Src. Combined inhibition of STAT3 with Src or FAK reduced the mammosphere formation, migration and invasion more significantly than the individual inhibitions. These observations indicated that the anti-breast cancer properties of Shk are due to its potential to inhibit multiple signaling proteins. Shk also reduced the activation and expression of STAT3, FAK and Src in vivo and reduced tumorigenicity, growth and metastasis of 4T1 cells. Collectively, this study underscores the translational relevance of using a single inhibitor (Shk) for compromising multiple tumor-associated signaling pathways to check cancer metastasis and stem cell load.


Figures

Figure 1
Figure 1. Shk inhibits multiple cancer hallmarks
(A) The IC50 of Shk for indicated breast cancer cells after 24 h of treatment. (B) Effect of Shk on clonogenic potential of indicated breast cancer cells. (C) Effect of Shk on cell viability of patient derived primary breast cancer cells. (N = 21). (D) Effect of Shk on clonogenic potential of patient derived primary breast cancer cells. (E) Effect of 2.5 μM Shk on migratory potential of indicated human breast cancer cells. The wound healing in presence and absence of Shk photographed at 0, 12 and 24 h (F) Effect of indicated doses of Shk on invasive potential of different breast cancer cells. Cells are allowed to invade for 24 h across matrigel coated trans-well inserts. Invaded cells were fixed, stained and photographed (20X magnification). (G) Representative pictures of mammospheres derived from breast cancer cells in presence and absence of the different doses of Shk (20X magnification). (H) Effect of indicated doses of Shk on mammosphere forming potential of breast cancer cells. Data are expressed as a fold change relative to the DMSO-treated (Untreated) cells. Data are shown as the mean ±SD. (**) p < 0.01.
Figure 2
Figure 2. Shk decreases stem cell load in breast cancer cells and enriched CD44+,CD24−/low breast cancer stem cells.
(A) MDA-MB 231 cells were treated with indicated doses of Shk for 24 h and ALDH1 expression was measured through flow-cytometry using Aldefluor assay. Values mentioned along with the dot plots indicate percentage of ALDH1+ population; (B) bar graph represents the average of three independent experiments. (C) Gene expression of indicated CSC markers in the MDA-MB 231 cells treated either with DMSO or 2.5 μM Shk for 24 h. Data are expressed as a fold change relative to the untreated (DMSO treated) control. (D,E) MDA-MB-231 cells were treated with increasing concentrations of Shk for 24 h and western blot was done for various cancer stem cell marker proteins as indicated. The full size blots corresponding to the cropped blot images are given in Fig. S10. Bar graph represents the normalized densitometric quantitation of western blot band intensities to β-actin band intensities. (F–H) Bar graphs represents effect of indicated doses of Shk on cancer stem cell load (ALDH1 positivity), clonogenicity and mammosphere forming potential of CD44+ CD24−/low MCF7 breast cancer cells. (I) Gene expression of the indicated CSC markers in CD44+ CD24−/low MCF7 cells treated with either DMSO (untreated control) or 2.5 μM Shk (treated) for 24 h. (J) Gene expression of indicated CSC markers in patient derived breast cancer cells treated either with DMSO or 2.5 μM Shk for 24 h. Data are expressed as a fold change relative to the untreated (DMSO treated) control. Data are shown as the mean ±SD. (*) p < 0.05, (**) p < 0.01 and (***) p < 0.001.
Figure 3
Figure 3. Shk inhibits STAT3, FAK and Src signaling pathways.
(A) MDA-MB 231 cells were cultured in presence of DMSO (untreated) or 2.5 μM Shk (treated) for 6 h and cell lysates were subjected to the kinase profiling array. The array membranes were scanned and densitometry for all spots was performed. (B) Bar graphs represent the normalized pixel densities of some of the selected proteins differentially activated in control (DMSO treated) and Shk treated samples. (C) MDA-MB 231 cells were treated with DMSO or 2.5 μM Shk for indicated time intervals and western blot for various signaling molecules was performed. The full size blots corresponding to the cropped blot images are given in Fig. S10.
Figure 4
Figure 4. STAT3, FAK and Src are differentially activated and expressed in breast cancer cells.
(A) Representative picture indicating mammosphere and single suspended cells. (B) Schematic outline of mammosphere enrichment. (C) Protein expression and activation of STAT3, FAK and Src was determined in single suspended cells (non-mammosphere forming cells) and mammospheres by western blot. The full size blots corresponding to the cropped blot images are given in Fig. S10. (D) Gene expression of STAT3, FAK and Src was determined in MCF7 parent population and CD44+ CD24−/low MCF7 cells using PCR. The full agarose gel images corresponding to the cropped images are given in Fig. S10. (E) Protein expression and activation of STAT3, FAK and Src was in CD44+ 24− cells and parent population.
Figure 5
Figure 5. STAT3, FAK and Src activation status correlates with mammosphere forming potential in breast cancer.
(A) Bar graph represents number of mammospheres formed from 2500 cells in presence and absence of indicated treatments. MDA-MB 231, MDA-MB 468 and MCF7 24 h mammosphere cultures were treated with Shk (2.5 μM), FAK inhibitor (FAK inhibitor 14; 2.5 μM), Src inhibitor (AZM 475271; 10 μM) and STAT3 inhibitor (WP1066; 10 μM). After 24 h, treatments were removed and cells were allowed to grow in fresh mammosphere culture media for 8 days. (B) Expression of various stem cell and EMT related transcription factors and markers were detected using western blotting in MDA-MB 231 cells with or without indicated treatments. The full size blots corresponding to the cropped blot images are given in Fig. S10. (C) MDA-MB 231, MDA-MB 468 and MCF7 cells were pre-treated with either IL6 (100 ng ml−1), Fibronectin (1 μg ml−1) or EGF (25 ng ml−1) for two population doublings and subjected to mammosphere formation. Bar graph represents average of three independent experiments. (D) MCF7 cells were pre-treated with either IL6 (100 ng ml−1), Fibronectin (1 μg ml−1) or EGF (25 ng ml−1) for two population doublings and subjected to mammosphere formation. After 24 h, cells were treated with DMSO (untreated) or Shk (treated) as indicated in the bar graph. Data are shown as the mean ±SD. (*) p < 0.05 and (**) p < 0.01.
Figure 6
Figure 6. STAT3 activation status and its effect on cancer stem cell load
(A) MDA-MB 231, MDA-MB 468 and MCF7 cells were grown with or without IL6 (100 ng ml−1) for two population doublings and analyzed for ALDH1 positivity using Aldefluor assay. (B) MCF7 cells were grown with or without IL6 (100 ng ml−1) for two population doublings and treated with DMSO (untreated) or indicated treatments (Shk 2.5 μM or STAT3 Inhibitor (WP1066) 10μM) for 24 h and ALDH1 expression was measured through flow-cytometry using Aldefluor assay. Values mentioned along with the dot plots indicate percentage of ALDH1+ population; bar graph represents the average of three independent experiments. (C–E) MDA-MB 231, MDA-MB 468 and MCF7 cells were cultured with IL6 (100 ng ml−1) and treated with DMSO or indicated treatments. STAT3 expression and STAT3 activation (Y705) was assessed using western blotting after 1 h of treatment. Oct3/4 expression was assessed after 24 h treatment. The full size blots corresponding to the cropped blot images are given in Fig. S10. Data are shown as the mean ±SD. (*) p < 0.05.
Figure 7
Figure 7. Combination of FAK, Src and STAT3 inhibitors is more potent than individual inhibition against various cancer hallmarks.
(A) Cell migration and (B) cell invasion potential of MDA-MB 231 cells was assessed in the presence of Shk (2.5 μM), FAK inhibitor (FAK inhibitor 14; 2.5 μM), Src inhibitor (AZM 475271; 10 μM) and STAT3 inhibitor (WP1066; 10 μM). Various combinations of these inhibitors were also used STAT3+FAK inhibitor (WP1066; 10 μM + FAK inhibitor 14; 2.5 μM), STAT3 + Src Inhibitor (WP1066; 10 μM + AZM 475271; 10 μM) and FAK+Src Inhibitor (FAK inhibitor 14; 2.5 μM + AZM 475271; 10 μM). Cell migration and cell invasion was assessed through scratch cell migration assay and transwell invasion after 24 h of treatments. (C,D) Mammosphere forming potential of MDA-MB 231 cells and CD44+ CD24−/low enriched MCF7 cells was assessed in presence of similar combination of STAT3+FAK inhibitor (WP1066; 10 μM + FAK inhibitor 14; 2.5 μM), STAT3 + Src Inhibitor (WP1066; 10 μM+ AZM 475271; 10 μM) and FAK + Src Inhibitor (FAK inhibitor 14; 2.5 μM + AZM 475271; 10 μM). Cells were subjected to mammosphere cultures for 24 h and treated with the indicated inhibitors for next 24 h, followed by media change and growth of mammospheres were monitored for next 8 days. Data are shown as the mean ±SD. (**) p < 0.01.
Figure 8
Figure 8. Shk inhibits breast cancer growth, tumorigenicity and metastasis in vivo.
(A) Shk inhibited 4T1 tumor growth. Bar graph represents the average tumor volumes in vehicle control and Shk treated tumor bearing mice (n = 6). (*) p < 0.05 and (**) p < 0.01. Inset picture of upper panel represents tumor sizes and lower pane represents lung morphology in vehicle control and Shk treatment groups. (B) Western blot examination of indicated proteins for their expression and activation in vehicle control and treated tumor groups. The full size blots corresponding to the cropped blot images are given in Fig. S10. (C) Gene expression of stem cell and EMT markers in tumor tissues excised from the vehicle control and Shk treated groups (n = 3). (D) Number of secondary tumors formed after injecting indicated cell dilutions from Vehicle treated and Shk treated 4T1 tumors. (E) Number of lung nodules formed in mice injected with 4T1 mouse mammary tumor cells in the mammary fat pad and administered with 2.5 mg Kg−1 Shk or vehicle control on every alternate day for 3 weeks (n = 6). (F) Number of lung nodules in mice injected with 4T1 mouse mammary tumor cells through tail vein and administered with 2.5 mg Kg−1 Shk or vehicle control on every alternate day for 3 weeks. (n = 8) (G) Representative panel of the histological H&E staining, immunofluorescence staining for the STAT3, Oct3/4, cell proliferation marker PCNA and DNA damage indicator-TUNEL staining of tumor sections from vehicle and treatment groups.

Similar articles

Cited by

References

    1. Al-Ejeh F. et al. Breast cancer stem cells: treatment resistance and therapeutic opportunities. Carcinogenesis 32, 650–8 (2011). - PubMed
    1. Pinto C. A., Widodo E., Waltham M. & Thompson E. W. Breast cancer stem cells and epithelial mesenchymal plasticity - Implications for chemoresistance. Cancer Lett 341, 56–62 (2013). - PubMed
    1. Karamboulas C. & Ailles L. Developmental signaling pathways in cancer stem cells of solid tumors. Biochim. Biophys. Acta 1830, 2481–95 (2013). - PubMed
    1. Fouse S. D. & Costello J. F. Cancer Stem Cells Activate STAT3 the EZ Way. Cancer Cell 23, 711–3 (2013). - PMC - PubMed
    1. Guan J. L. Integrin signaling through FAK in the regulation of mammary stem cells and breast cancer. IUBMB Life 62, 268–76 (2010). - PMC - PubMed

Publication types

MeSH terms