. 2015 May 14;11(5):e1005233.
doi: 10.1371/journal.pgen.1005233. eCollection 2015 May.

The 4E-BP Caf20p Mediates Both eIF4E-Dependent and Independent Repression of Translation

Affiliations

The 4E-BP Caf20p Mediates Both eIF4E-Dependent and Independent Repression of Translation

Lydia M Castelli et al. PLoS Genet. .

Abstract

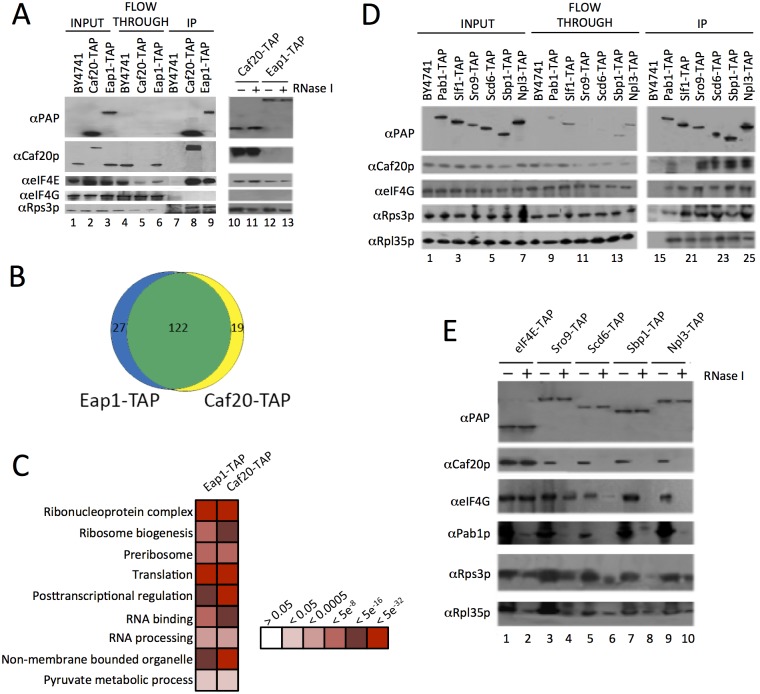
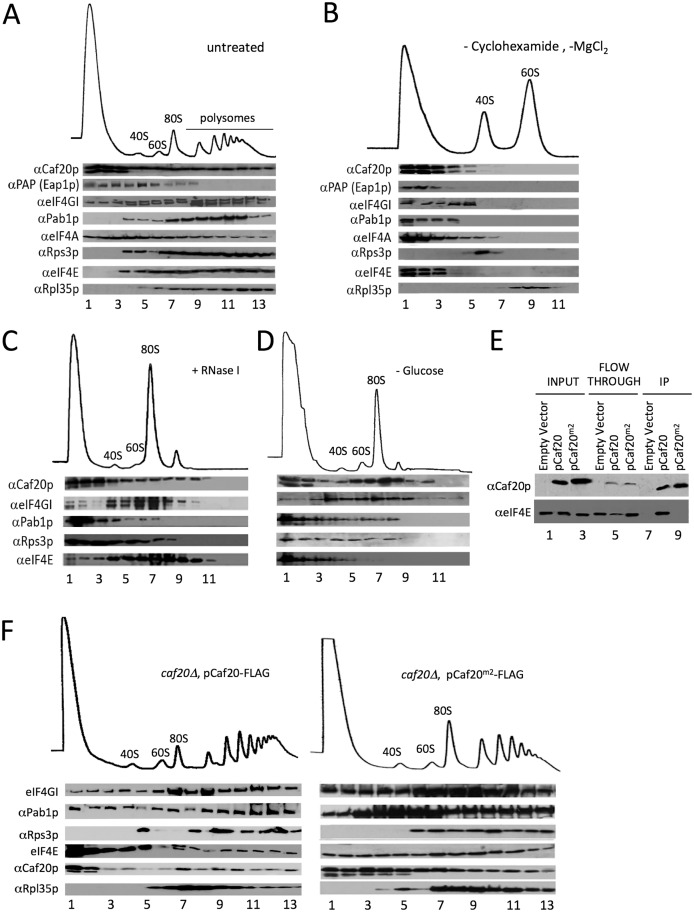
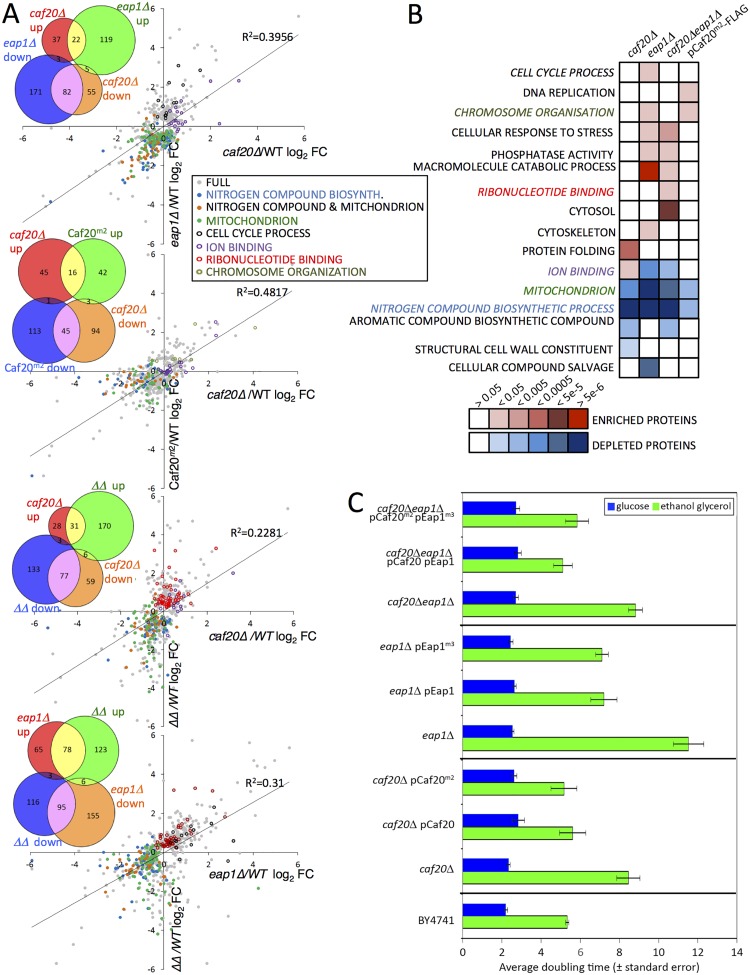
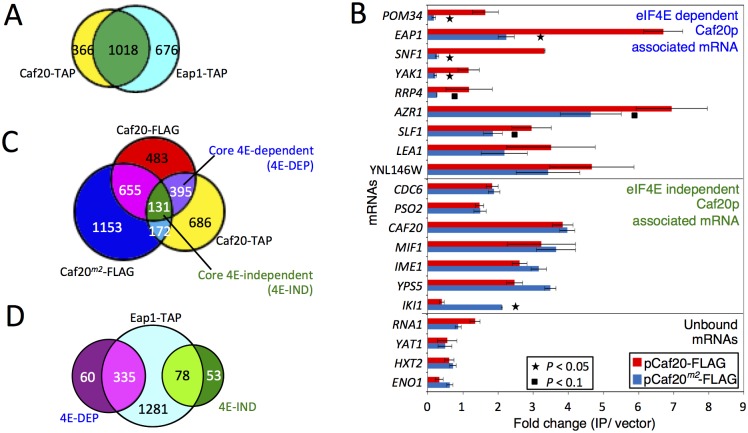
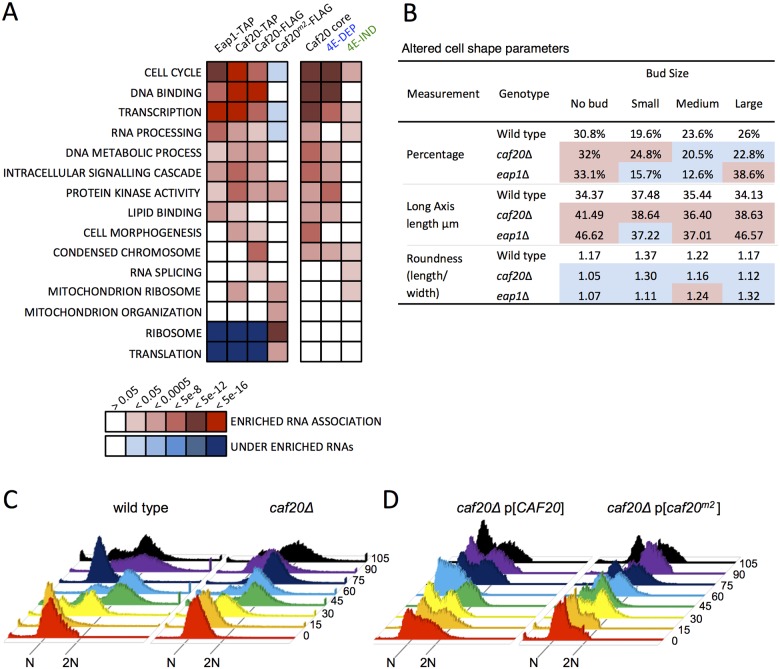
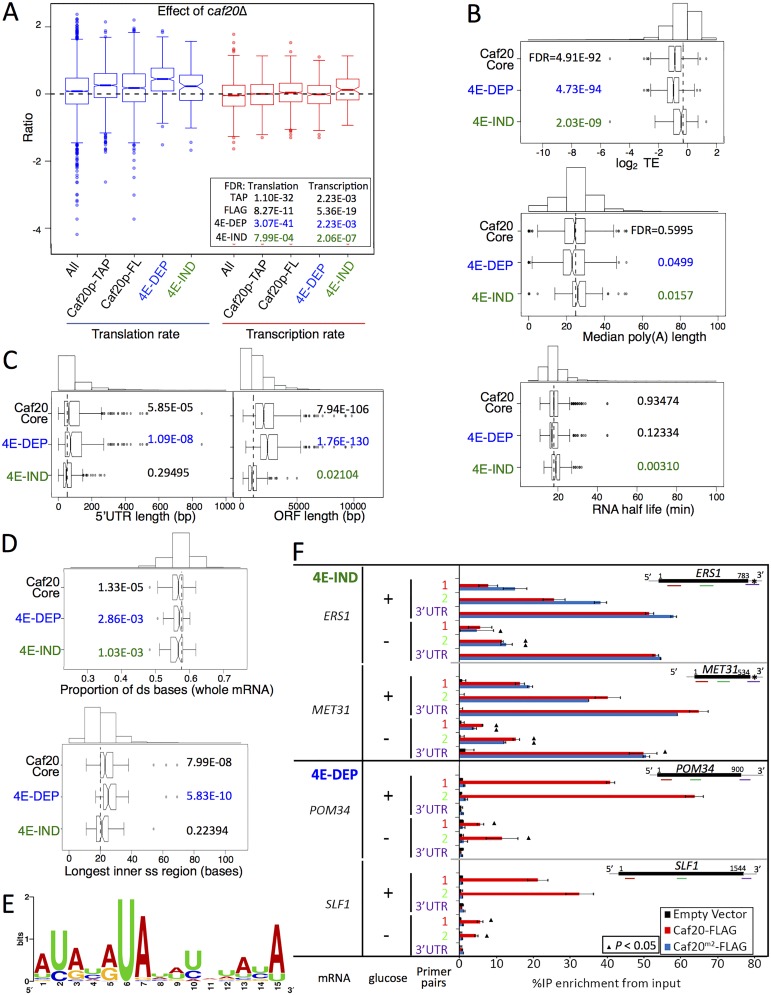
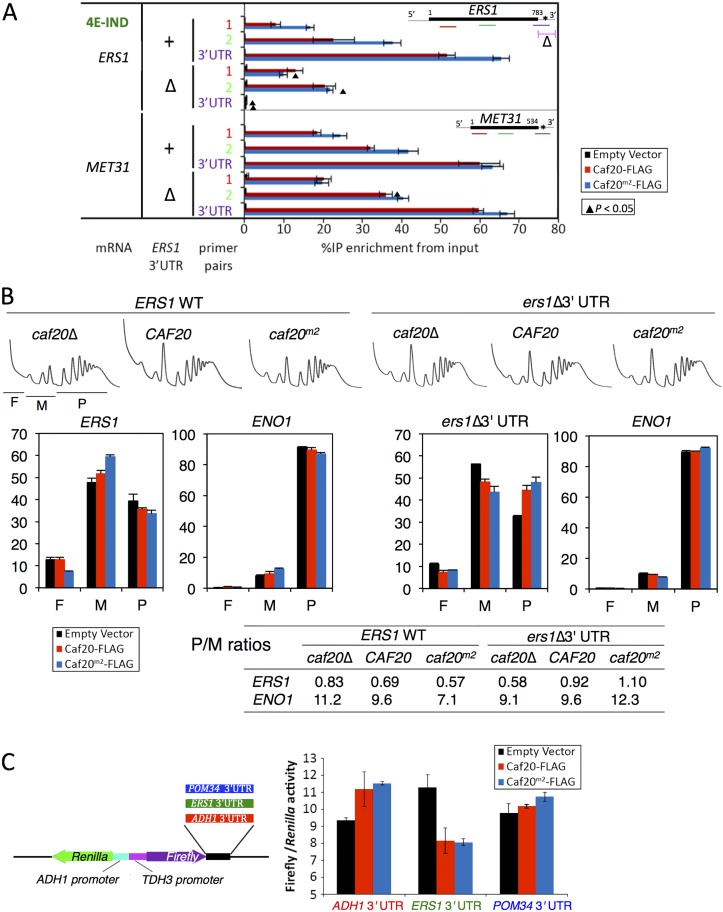
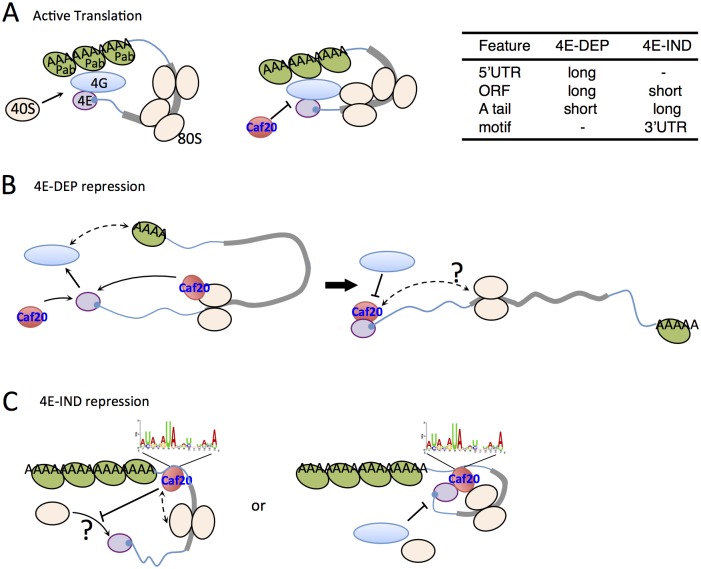
Translation initiation factor eIF4E mediates mRNA selection for protein synthesis via the mRNA 5'cap. A family of binding proteins, termed the 4E-BPs, interact with eIF4E to hinder ribosome recruitment. Mechanisms underlying mRNA specificity for 4E-BP control remain poorly understood. Saccharomyces cerevisiae 4E-BPs, Caf20p and Eap1p, each regulate an overlapping set of mRNAs. We undertook global approaches to identify protein and RNA partners of both 4E-BPs by immunoprecipitation of tagged proteins combined with mass spectrometry or next-generation sequencing. Unexpectedly, mass spectrometry indicated that the 4E-BPs associate with many ribosomal proteins. 80S ribosome and polysome association was independently confirmed and was not dependent upon interaction with eIF4E, as mutated forms of both Caf20p and Eap1p with disrupted eIF4E-binding motifs retain ribosome interaction. Whole-cell proteomics revealed Caf20p mutations cause both up and down-regulation of proteins and that many changes were independent of the 4E-binding motif. Investigations into Caf20p mRNA targets by immunoprecipitation followed by RNA sequencing revealed a strong association between Caf20p and mRNAs involved in transcription and cell cycle processes, consistent with observed cell cycle phenotypes of mutant strains. A core set of over 500 Caf20p-interacting mRNAs comprised of both eIF4E-dependent (75%) and eIF4E-independent targets (25%), which differ in sequence attributes. eIF4E-independent mRNAs share a 3' UTR motif. Caf20p binds all tested motif-containing 3' UTRs. Caf20p and the 3'UTR combine to influence ERS1 mRNA polysome association consistent with Caf20p contributing to translational control. Finally ERS1 3'UTR confers Caf20-dependent repression of expression to a heterologous reporter gene. Taken together, these data reveal conserved features of eIF4E-dependent Caf20p mRNA targets and uncover a novel eIF4E-independent mode of Caf20p binding to mRNAs that extends the regulatory role of Caf20p in the mRNA-specific repression of protein synthesis beyond its interaction with eIF4E.


Conflict of interest statement

The authors have declared that no competing interests exist.

Figures

Fig 1
Fig 1. Identification of 4E-BP associating proteins using TAP-tag IPs.
A. Western blots of the TAP IPs, lanes 1–9 show input, flowthrough and eluates for the IP strains and lanes 10–13 show the eluates of the 4E-BPs with and without RNase I digestion. Blots were probed with the α Protein A peroxidase (PAP) antibody (detects the TAP-tag), αCaf20p, αeIF4E, αeIF4G and αRps3p to highlight IP efficiency and maintenance of previously published associations. B. Proportional Venn-style diagram depicting the overlaps between proteins associating with the 4E-BPs. C. Gene Ontology classes statistically overrepresented within 4E-BP associated proteins at indicated FDR significance. Only a representative selection of the significant functional categories is shown D. Western blots from reciprocal TAP IPs of a selection of RNA-binding proteins identified as interacting with the 4E-BPs probed with the indicated antibodies. E. Effect of RNase I digestion on protein interactions identified in D.
Fig 2
Fig 2. 4E-BPs associate with translating ribosomes in an eIF4E-independent manner.
A. Sucrose density gradient analysis of extracts from the Eap1-TAP strain. Fractions were collected and protein distribution across the gradients visualised with western blots. Blots were probed for the 4E-BPs, closed loop components and 40S/60S ribosomal subunits. B. Western blot analyses of fractions collected from sucrose density gradients of extracts from the Eap1-TAP strain. The 80S ribosomal complex was dissociated by removal of cycloheximide and MgCl2 from the lysis buffer. Blots were probed for the 4E-BPs, closed loop components and 40S/60S ribosomal subunits. C. Western blot analysis of fractions collected from a sucrose density gradient of extract from the BY4741 HIS3 strain GP6001. The lysate was pre-treated with RNase I. D. Western blot analysis of fractions collected from a sucrose density gradient of extracts from the BY4741 HIS3 strain which had been grown in SCD-HIS and resuspended in SC-HIS for 10 min prior to cycloheximide treatment. E. Western blot analysis of FLAG immune-purification of whole cell extracts from caf20Δ strains harbouring an empty vector [pRS426], p[CAF20-FLAG] or p[CAF20 m2-FLAG]. F. Western blot analysis of fractions collected from sucrose density gradients of extracts from the p[CAF20-FLAG] and p[CAF20 m2-FLAG] strains.
Fig 3
Fig 3. The altered proteome of single, double 4E-BPΔ and Caf20m2-FLAG strains.
A. Pairwise comparisons of changes to proteome profiles for the 4E-BPΔ strains plotting log2 fold changes (log2FC) of each mutant strain to wild type (WT), showing only significantly changing proteins (FDR<0.05, 2 or more peptides used for quantification). Highlighted are key Gene Ontology (GO) classes that are over/under-represented. Colours are indicated in the inserted key. Lines of best fit and R2 correlation coefficients are shown. Four inset Venn-style diagrams in each upper left quadrant indicate numbers of proteins shared between datasets. ΔΔ indicates the double caf20Δ eap1Δ strain. B. Functional GO class analysis of the 4E-BPΔ and Caf20m2-FLAG altered proteomes using the DAVID Bioinformatics database. Over/underrepresentation colours depict FDR significance as per the key. Coloured text GO terms are highlighted in A. Only a representative selection of the significant functional categories is shown. C. Mean doubling times of the BY4741 (Wild type) and 4E-BPΔ strains bearing empty vector or plasmid copies of the indicated genes in fermentative (SCD) and respiratory (SCGE) media. Doubling times shown are an average of 3 biological replicates ± standard error.
Fig 4
Fig 4. Identifying eIF4E-dependent and independent mRNAs associating with Caf20p.
A. Proportional Venn style diagram showing the overlap between the mRNAs associating with Caf20p and Eap1p TAP IPs. B. Quantitative RT-PCR of selected mRNAs showing their association with Caf20p and Caf20m2p represented as fold-change over control. Statistically significant changes are indicated with a key (T-test). C. and D. Venn style diagrams showing C. mRNAs associating with Caf20-TAP, Caf20-FLAG and Caf20m2-FLAG, highlighting the core mRNAs identified in both studies and their dependence on the eIF4E interaction motif for binding, and D. Overlap between the core 4E-DEP and 4E-IND Caf20p interacting mRNAs and the Eap1-TAP associated proteins.
Fig 5
Fig 5. 4E-BP-bound mRNAs enrich cell cycle and transcription factors.
A. Functional GO class analysis of mRNAs associated with the 4E-BPs by RNA-seq. Over/underrepresentation colours depict FDR significance as per the key. Only a representative selection of the significant functional categories is shown. B. Summary of morphology changes noted within the Saccharomyces cerevisiae Morphological database (SCMD; http://yeast.gi.k.u-tokyo.ac.jp/datamine/) for 4E-BP deletion strains. Red/blue shading indicate over/under enrichment compared to wild type cells. C. D. Cell cycle progression defects in caf20 mutants. Flow cytometry analysis of DNA content using Sytox Green staining is shown at the indicated times (min) following release from alpha factor arrest for C. wild type and mutated cells, and D. plasmid complemented mutant cells.
Fig 6
Fig 6. Features of Caf20p 4E-DEP and 4E-IND core bound mRNAs.
A. Box and whisker plot showing impact of caf20Δ on polysome association (blue) and transcript abundance (red) across sets of Caf20p-associated mRNAs [19]. A 95% confidence interval around the median is represented by a notch. Where notches do not overlap the medians are different. Inset: P values represent FDR (Mann-Whitney U tests) versus non-target RNAs. B-D: Box and whisker plots comparing mRNA features of Caf20 core mRNA targets and the 4E-DEP and 4E-IND subgroups. Histograms above each plot show binned total data with the vertical dashed line indicating the median of the total. P values represent FDR (Mann-Whitney U tests corrected for multiple hypothesis testing). Gene sets were statistically tested versus the set of mRNAs not bound to TAP or FLAG tagged Caf20p. B. Translation efficiency (TE) data was taken from ribosome footprinting experiments, median poly A tail length [37] and mRNA half-life [38]. C. 5’ UTR and ORF lengths and D. secondary structure information [40] are similarly shown. E. Sequence motif identified in 3’UTRs of 4E-IND mRNAs using the MEME Suite [43]. See S1 Dataset, sheet 11 for individual motifs identified. F. Caf20p interactions with 4E-IND mRNA 3’UTRs and with ORFs differ in sensitivity to glucose starvation. Fraction of each indicated RNA (left) isolated in complex with Caf20-FLAG (red) or Caf20m2-FLAG (blue bars) or an empty vector control (black bars) from caf20Δ cells following formaldehyde cross-linking and RNase III digestion. qRT-PCR detection with primer pairs hybridizing along each RNA as indicated by colour coding in each cartoon (right). Samples were prepared from cells grown in SCD (+ glucose) or following 10 min of glucose starvation (- glucose). Statistically significant changes ± glucose indicated by ▲ (T-test).
Fig 7
Fig 7. Caf20p and ERS1 3’UTR contribute to the translational repression of ERS1.
A. Interactions between Caf20m2-FLAG and ERS1 is diminished by loss of ERS1 3’UTR. Fraction of ERS1 or MET31 RNA (left) isolated in complex with Caf20-FLAG (red) or Caf20m2-FLAG (blue bars) or an empty vector control (black bars) from caf20Δ cells following formaldehyde cross-linking and RNase III digestion. qRT-PCR detection with primer pairs hybridizing along each RNA as indicated by colour coding in each cartoon (right). Statistically significant changes ± ERS1 3’UTR indicated by ▲ (T-test). B. Polysome engagement of ERS1 is affected by Caf20p and the ERS1 3’UTR. Polysome profiles from sucrose gradient analyses of strains are shown (top) with free (F), monosomes (M) and polysome (P) regions indicated beneath the caf20Δ profile. RNA collected from sucrose gradient fractions was analysed by qRT-PCR and quantified relative to a luciferase RNA ‘spike-in’ control. Proportions of RNA in ribosome free (F), monosomes (M) or polysome (P) are shown for ERS1 and ENO1. Bar chart colors are as in A. P/M ratios for both mRNAs calculated from the data are indicated in the table below. C. ERS1 3’UTR confers Caf20p-dependent repression to firefly luciferase. Cartoon of plasmid dual luciferase construct and cloned 3’UTR fragments (left). Ratio of firefly to Renilla luciferase activities for transformants of caf20Δ cells bearing indicated Caf20 plasmid. Mean ±SE for triplicate assays (right).
Fig 8
Fig 8. Models for 4E-DEP and 4E-IND Caf20p-mediated translational repression.
A. Active translation. Short mRNA (blue line with grey ORF) shown with eIF4E (purple) bound to 5’cap (blue), eIF4G (blue oval) and Pab1p (green oval) facilitating mRNA circularisation and ribosome recruitment (cream ovals) that excludes Caf20p binding eIF4E. B. Caf20p mediated eIF4E-dependent translational repression. eIF4E/4G/Pab1p closed loop unstable on long mRNAs facilitating Caf20p binding (red). Caf20p binding to 80S ribosomes may contribute to its local recruitment. C. 4E-IND repression mechanisms. Caf20p 3’ UTR motif binding (may not be direct), either alone or in addition to 80S binding facilitates translational repression. eIF4E-Caf20p binding may contribute to repression on some of these mRNAs.

Similar articles

Cited by

References

    1. Jackson RJ, Hellen CU, Pestova TV (2010) The mechanism of eukaryotic translation initiation and principles of its regulation. Nat Rev Mol Cell Biol 11: 113–127. 10.1038/nrm2838 - DOI - PMC - PubMed
    1. Hinnebusch AG (2014) The scanning mechanism of eukaryotic translation initiation. Annu Rev Biochem 83: 779–812. 10.1146/annurev-biochem-060713-035802 - DOI - PubMed
    1. Sonenberg N, Hinnebusch AG (2009) Regulation of translation initiation in eukaryotes: mechanisms and biological targets. Cell 136: 731–745. 10.1016/j.cell.2009.01.042 - DOI - PMC - PubMed
    1. Wek RC, Jiang HY, Anthony TG (2006) Coping with stress: eIF2 kinases and translational control. Biochem Soc Trans 34: 7–11. - PubMed
    1. Kapp LD, Lorsch JR (2004) The molecular mechanics of eukaryotic translation. Annu Rev Biochem 73: 657–704. - PubMed

Publication types

MeSH terms