. 2015 May 14;11(5):e1004842.
doi: 10.1371/journal.ppat.1004842. eCollection 2015 May.

Fob1 and Fob2 Proteins Are Virulence Determinants of Rhizopus oryzae via Facilitating Iron Uptake from Ferrioxamine

Affiliations

Fob1 and Fob2 Proteins Are Virulence Determinants of Rhizopus oryzae via Facilitating Iron Uptake from Ferrioxamine

Mingfu Liu et al. PLoS Pathog. .

Abstract

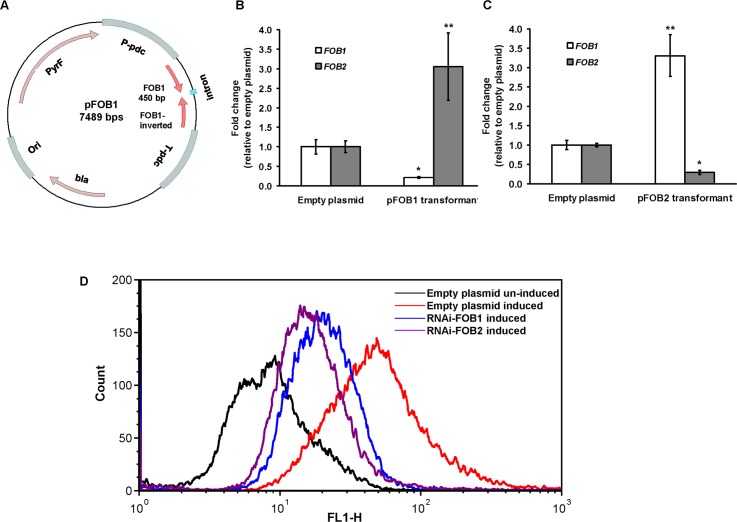
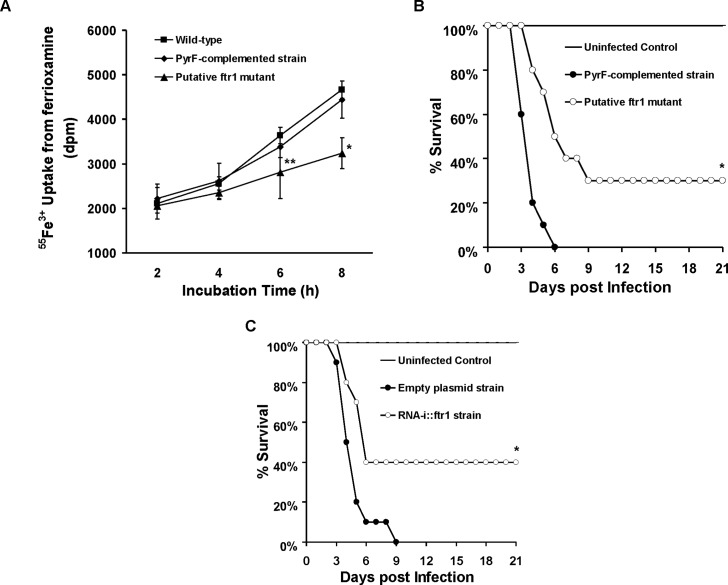
Dialysis patients with chronic renal failure receiving deferoxamine for treating iron overload are uniquely predisposed for mucormycosis, which is most often caused by Rhizopus oryzae. Although the deferoxamine siderophore is not secreted by Mucorales, previous studies established that Rhizopus species utilize iron from ferrioxamine (iron-rich form of deferoxamine). Here we determined that the CBS domain proteins of Fob1 and Fob2 act as receptors on the cell surface of R. oryzae during iron uptake from ferrioxamine. Fob1 and Fob2 cell surface expression was induced in the presence of ferrioxamine and bound radiolabeled ferrioxamine. A R. oryzae strain with targeted reduced Fob1/Fob2 expression was impaired for iron uptake, germinating, and growing on medium with ferrioxamine as the sole source of iron. This strain also exhibited reduced virulence in a deferoxamine-treated, but not the diabetic ketoacidotic (DKA), mouse model of mucormycosis. The mechanism by which R. oryzae obtains iron from ferrioxamine involves the reductase/permease uptake system since the growth on ferrioxamine supplemented medium is associated with elevated reductase activity and the use of the ferrous chelator bathophenanthroline disulfonate abrogates iron uptake and growth on medium supplemented with ferrioxamine as a sole source of iron. Finally, R. oryzae mutants with reduced copies of the high affinity iron permease (FTR1) or with decreased FTR1 expression had an impaired iron uptake from ferrioxamine in vitro and reduced virulence in the deferoxamine-treated mouse model of mucormycosis. These two receptors appear to be conserved in Mucorales, and can be the subject of future novel therapy to maintain the use of deferoxamine for treating iron-overload.


Conflict of interest statement

The authors have declared that no competing interests exist.

Figures

Fig 1
Fig 1. Detection of the ferrioxamine putative receptor in the cell surface material of R. oryzae.
Cell surface material was collected from regenerating R. oryzae protoplasts grown in iron-limited medium with (+Ferri) or without (-Ferri) deferoxamine. Samples were separated on SDS-PAGE and visualized by Coomassie blue (A). Additionally, samples were mixed with [55Fe]ferrioxamine[69] then analyzed by non-denaturing PAGE followed by autoradiography (B). Two putative and closely related ORFs were identified and named FOB1 and FOB2. Highlighted area denotes the four CBS domains while underlined amino acids indicate potential N- and O-glycosylation sites (C).
Fig 2
Fig 2. FOB1 and FOB2 expression is induced by ferrioxamine and to a lesser extent by ferric iron but not by deferoxamine.
The expression of FOB1 and FOB2 was studied in response to iron sources in vitro. (A) qRT-PCR was used to study the expression of FOB1 and FOB2 in media without added iron, 10 μM of ferrioxamine, deferoxamine, rhizoferrin without Fe3+, rhizoferrin with Fe3+ or 100 μM FeCl3. (B) Cold ferrioxamine but not deferoxamine inhibits 55Fe3+ uptake from ferrioxamine (introduced at a concentration of 10 μM). (C) Compared to ferrioxamine, FeCl3 demonstrated modest and non-linear increase in FOB1 and FOB2 expression as determined by qRT-PCR. (D) Flow cytometry using antiFob2p polyclonal antibodies demonstrated the cell surface expression of Fob1 and Fob2 proteins in medium containing ferrioxamine but not in medium without iron supplement. Error bars represent the standard deviation of the mean from at least two independent assays (n> 6 per group). *P<0.05 vs. no iron, while **P<0.001 vs. no iron or FeCl3.
Fig 3
Fig 3. Western blot analysis demonstrating that Fob proteins are cell-associated, not secreted, and bind to radiolabeled ferrioxamine.
Antibodies were raised against E. coli-produced Fob2 protein and used to study the expression pattern of Fob proteins. (A) Western blot analysis of whole cell proteins extracted from R. oryzae wild-type or R. oryzae mutant with dual inhibition of FOB1/ FOB2 by RNA-i (see Fig 6 for generation of this mutant). (B) Western blot analysis of supernatant (cell-free) collected from R. oryzae wild-type hyphae or R. oryzae mutant with dual inhibition of FOB1/ FOB2 growing for overnight in media with or without ferrioxamine. (C) Whole cell proteins from R. oryzae wild-type grown in medium with or without ferrioxamine were loaded on membrane under non-denaturing conditions prior to mixing with [55Fe]ferrioxamine[69] then analyzed with autoradiography. Also, Fob proteins from the same crude cell wall extracts were separated by immunoprecipitation using anti-IgG Fob2 antibodies coupled to protein G beads column prior to incubating with [55Fe]ferrioxamine under non-denaturing conditions. The beads were washed extensively with washing buffer prior to spotting them on membrane followed by autoradiography. (D) Western blot analysis of whole cell proteins extracted from R. oryzae wild-type or R. oryzae mutant with dual inhibition of FOB1/ FOB2 following immunoprecipitation using anti-IgG Fob2 antibodies as in C. rFob2p was included in A, B, and D as a control showing the expected band size of ~40 kDa (bands in A, B and D below 35 kDa from rFob2p lane represent degradation of rFob2p. Note, that the marker is overlaid on each of the western blots to determine band sizes.
Fig 4
Fig 4. RNA-i targeting a single putative ferrioxamine receptor leads to compensatory effect with the other receptor.
Plasmid pFOB1 (or pFOB2) targeting inhibition of a single putative ferrioxamine receptor (A). Plasmid pFOB1 (B) or pFOB2 (C) successfully inhibited the expression of FOB1 and FOB2, respectively as determined by qRT-PCR. However, a compensatory gene expression was observed in these transformants from the untargeted gene. Results (n = 6 per group) were expressed as fold change in gene expression relative to gene expression in empty plasmid transformant. Error bars represent the standard deviation of the mean from two independent assays. * and **P<0.05 compared to FOB1 and FOB2 expression in empty plasmid transformant, respectively. Flow cytometry using antiFob2 polyclonal antibodies confirmed cell surface expression and the compensatory effect of the untargeted gene. Induction and un-induction conditions were carried out using YNB with or without 10 μM ferrioxamine (D).
Fig 5
Fig 5. Single gene inhibition of FOB1 or FOB2 slightly reduced germination, growth and iron uptake of R. oryzae when ferrioxamine is used as a sole source of iron.
(A) To determine effect of gene inhibition on R. oryzae germination, cells were pregerminated in YNB+CSM-URA medium supplemented with 10 μM ferrioxamine as a sole source of iron. At selected time intervals samples were taken from the medium and examined by light microscopy. (B) To determine effect of gene inhibition on growth of R. oryzae, 105 spores of each strain were plated in the middle of the YNB+CSM-URA agar plates supplemented with 10 μM ferrioxamine as a sole source of iron and the colony diameter (mm) was measured. Two independent transformants from each construct were tested in triplicate (n = 9). *P <0.05 vs. wild-type and empty plasmid strains. (C) Single gene inhibition attenuated 55Fe3+ from ferrioxamine. Two independent transformants from each construct were tested in triplicate (n = 9). *P <0.05 vs. Wild-type and empty plasmid strains. In B and C, error bars represent the standard deviation of the mean from three independent assays.
Fig 6
Fig 6. Dual gene inhibition strategy completely abrogates FOB1 and FOB2 expression.
Plasmid pFOB1/FOB2 targeting inhibition of the dual putative ferrioxamine receptors (A). Plasmid pFOB1/FOB2 almost completely blocked FOB1 and FOB2, respectively as determined by qRT-PCR (B). Results were expressed as fold change in gene expression relative to empty plasmid transformant. Error bars represent the standard deviation of the mean from two independent assays. *P<0.005 compared to empty plasmid transformant. Flow cytometry using antiFob2 polyclonal antibodies confirmed the lack of expression of either Fob1 or Fob2 proteins on the cell surface of R. oryzae transformed with pFOB1/FOB2 relative to cells transformed with empty plasmid (C). Induction and un-induction conditions were carried out using YNB with or without 10 μM ferrioxamine.
Fig 7
Fig 7. Dual gene inhibition significantly attenuated the ability of R. oryzae to germinate, grow and take up iron from ferrioxamine.
(A) To determine effect of dual gene inhibition on R. oryzae germination, cells were pregerminated in YNB+CSM-URA medium supplemented with 10 μM ferrioxamine as a sole source of iron. At selected time intervals samples were taken from the medium and examined by light microscopy. (B) To determine effect of dual gene inhibition on growth of R. oryzae, 105 spores of each strain were plated in the middle of the YNB+CSM-URA agar plates supplemented with 10 μM ferrioxamine as a sole source of iron and the colony diameter (mm) was measured. Four independent transformants were tested in triplicate (n = 9). *P <0.01 vs. wild-type and empty plasmid strains. (C) Dual gene inhibition attenuated 55Fe3+ from ferrioxamine. Four independent transformants were tested in triplicate (n = 9). *P <0.05 vs. wild-type or empty plasmid strains. In B and C, error bars represent the standard deviation of the mean from three independent assays.
Fig 8
Fig 8. FOB1 and FOB2 are required for the full virulence of R. oryzae in the deferoxamine-treated and not the DKA mouse models.
(A) Survival of mice (n = 10 per arm) treated with three doses of deferoxamine (100 mg/kg/dose) via i.p. injection on day -1, 0, and +1 relative to intravenous infection with R. oryzae strains. For the targeted inoculum of 1 x 10⁵, mice were infected with wild-type (6.5 x 10⁴ spores), R. oryzae transformed with empty plasmid (8.6 x 10⁴ spores) or R. oryzae with dual attenuated expression of FOB1 and FOB2 (Dual 1 at 4.6 x 10⁴ spores or Dual 2 at 3.6 x 10⁴ spores). For the targeted inoculum of 1 x 10³, mice were infected with R. oryzae transformed with the empty plasmid (9.5 x 10² spores) or R. oryzae with dual attenuated expression of FOB1 and FOB2 (Dual 1 at 7.9 x 10² spores or Dual 2 at 4.9 x 10² spores). *P<0.001 compared to mice infected with wild-type or R. oryzae transformed with empty plasmid. (B) Tissue fungal burden (determined by qPCR) of target organs (brains and kidneys) harvested from mice (n = 10 per arm) infected with wild-type (7 x 10⁴ spores), R. oryzae transformed with empty plasmid (5.7 x 10⁴ spores) or R. oryzae with dual attenuated expression of FOB1 and FOB2 (4.8 x 10⁴ spores). Data are expressed as median ± interquartile range. y axis value represents the lower limit of detection in the assay. *P<0.05 compared to tissues harvested from mice infected with wild-type or empty plasmid transformant. (C) Histopathological examination (H&E stain) of target organs revealed minimal inflammation and fungal elements in brains and kidneys of mice infected with RNA-i transformant, while organs collected from the empty plasmid transformant infected mice had abscesses with abundant hyphae (arrows) and neutrophil infiltration. Magnification of 400 x. (D) In vivo expression of FOB1 and FOB2 genes in brain and kidneys harvested from mice infected with wild-type, empty plasmid or RNA-i dual transformant as determined by qRT-PCR using specific primers to each of the FOB genes. Data are expressed as mean ± SD. * P<0.001 vs. wild-type or empty plasmid. Error bars represent the standard deviation of the mean from 10 mice per arm. (E) DKA mice (n = 10 per arm) were infected with R. oryzae transformed with empty plasmid (2.8 x 10³ spores) or R. oryzae with dual attenuated expression of FOB1 and FOB2 (2.4 x 10³ spores).
Fig 9
Fig 9. R. oryzae iron uptake from ferrioxamine is mediated by reductase activity.
(A) Iron uptake from ferrioxamine is associated with increased reductase activity as compared to iron uptake from FeCl3 (n = 4 per each time point). *P<0.03 vs. reductase activity of FeCl3 at the corresponding time point. (B) The ferrous chelator BPS inhibits growth of R. oryzae on medium supplemented with ferrioxamine as a sole source of iron (n = 6 per group and per time point). *P <0.006 vs. without BPS, while **P <0.006 vs. without BPS or 0.2 mM BPS. (C) FeCl3 reverses growth inhibition mediated by BPS (n = 4 per group and per time point). (D) BPS inhibits 55Fe3+ uptake from ferrioxamine (n = 8 per group and per time point). * P<0.04 vs. without BPS and **P <0.003 vs. without BPS or with 0.2 mM BPS. Error bars represent the standard deviation of the mean from two independent assays.
Fig 10
Fig 10. Reduction of FTR1 expression decreases the ability of R. oryzae to take up iron from ferrioxamine in vitro and attenuates R. oryzae virulence in the deferoxamine-treated mice.
(A) 55Fe3+ uptake from ferrioxamine by wild-type, PyrF-complemented, or putative ftr1 strains (a strain with reduced copies of FTR1 [24], n = 6 per arm from two independent experiments). *P<0.006 vs. wild-type or PyrF-complemented strains. **P<0.01 vs. wild-type strain. (B) Survival of deferoxamine-treated mice (n = 10 per arm) infected with R. oryzae PyrF-complemented strain (9.4 x 10² spores), or R. oryzae putative ftr1 null (6.5 x 10²). *P = 0.001 compared to mice infected with R. oryzae PyrF-complemented strain. (C) Survival of deferoxamine-treated mice (n = 10 per arm) infected with R. oryzae transformed with the empty plasmid (9.1 x 10² spores), or R. oryzae transformed with RNA-i construct targeting FTR1 (RNAi::ftr1) (9.5 x 10²) [24]. *P = 0.013 compared to mice infected R. oryzae transformed with empty plasmid.
Fig 11
Fig 11. FOB genes are induced in ferrioxamine containing medium, while iron transporter genes such as FTR1 and SIT-like genes are transiently expressed and tightly regulated.
qRT-PCR was used to study the expression of FOB1, FOB2, FTR1, or SIT-like genes in media supplemented with 10 μM ferrioxamine (A, B) or deferoxamine (C, D). Only ferrioxamine strongly induced the expression of FOB genes (A). Iron starvation genes (FTR1 and SIT-like genes) were transiently expressed in ferrioxamine-containing medium over time (B) and expressed with minimal variation in deferoxamine-containing medium (D). Error bars represent the standard deviation of the mean from two independent assays (n = 6 per group).
Fig 12
Fig 12. Proposed mechanism of iron uptake by R. oryzae from ferrioxamine.
Deferoxamine (D) directly chelates iron from transferrin (T), resulting in ferrioxamine which binds to Fob1 and/or Fob2 proteins on the cell surface. R. oryzae then liberates Fe2+ iron by the actions of cell surface reductases then transported into the cell by oxidase/Ftr1 complex (A). In the absence of Fob1/Fob2 or Ftr1 proteins, the ability of R. oryzae to obtain iron from ferrioxamine is compromised and the virulence is abrogated in deferoxamine-treated mouse model (B). Sit-mediated shuttle mechanism of ferrioxamine transportation probably acts as a secondary mechanism of iron uptake from ferrioxamine.

Similar articles

Cited by

References

    1. Ibrahim AS, Edwards JE Jr., Filler SG, Spellberg B (2011) Mucormycosis and Entomophtoramycosis (Zygomycosis) In: Kauffman CA PP, Sobel JD, Dismukes WE, 2nd Ed., editor. Essentials of Clinical Mycology. New York: Springer; pp. 265–280.
    1. Kontoyiannis DP, Lewis RE (2006) Invasive zygomycosis: update on pathogenesis, clinical manifestations, and management. Infect Dis Clin North Am 20: 581–607, vi. - PubMed
    1. Bitar D, Van Cauteren D, Lanternier F, Dannaoui E, Che D, et al. (2009) Increasing incidence of zygomycosis (mucormycosis), France, 1997–2006. Emerg Infect Dis 15: 1395–1401. 10.3201/eid1509.090334 - DOI - PMC - PubMed
    1. Chakrabarti A, Chatterjee SS, Das A, Panda N, Shivaprakash MR, et al. (2009) Invasive zygomycosis in India: experience in a tertiary care hospital. Postgrad Med J 85: 573–581. 10.1136/pgmj.2008.076463 - DOI - PubMed
    1. Gleissner B, Schilling A, Anagnostopolous I, Siehl I, Thiel E (2004) Improved outcome of zygomycosis in patients with hematological diseases? Leuk Lymphoma 45: 1351–1360. - PubMed

Publication types

MeSH terms