. 2015 May 14;10(5):e0127234.
doi: 10.1371/journal.pone.0127234. eCollection 2015.

Effort versus Reward: Preparing Samples for Fungal Community Characterization in High-Throughput Sequencing Surveys of Soils

Affiliations

Effort versus Reward: Preparing Samples for Fungal Community Characterization in High-Throughput Sequencing Surveys of Soils

Zewei Song et al. PLoS One. .

Abstract

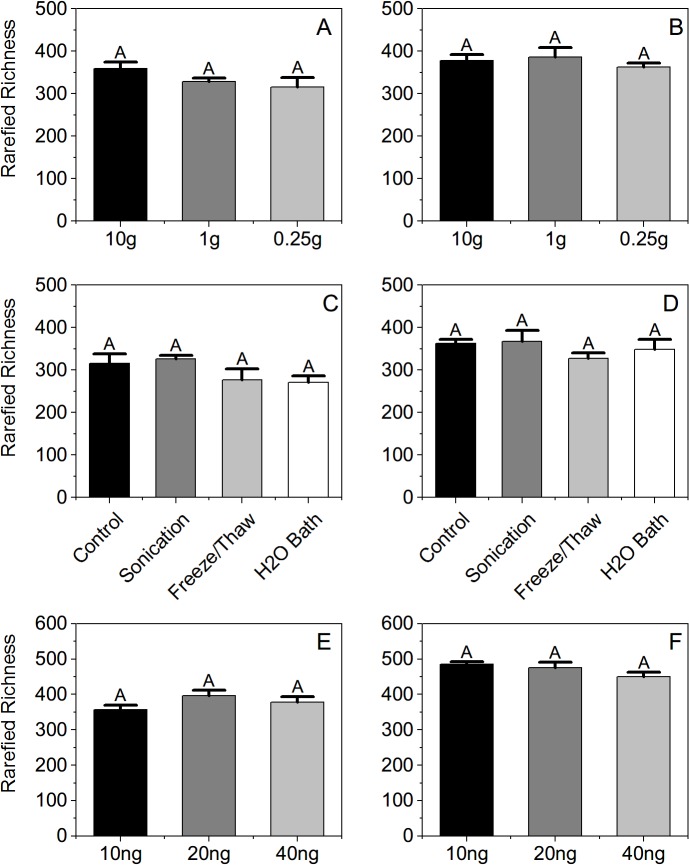
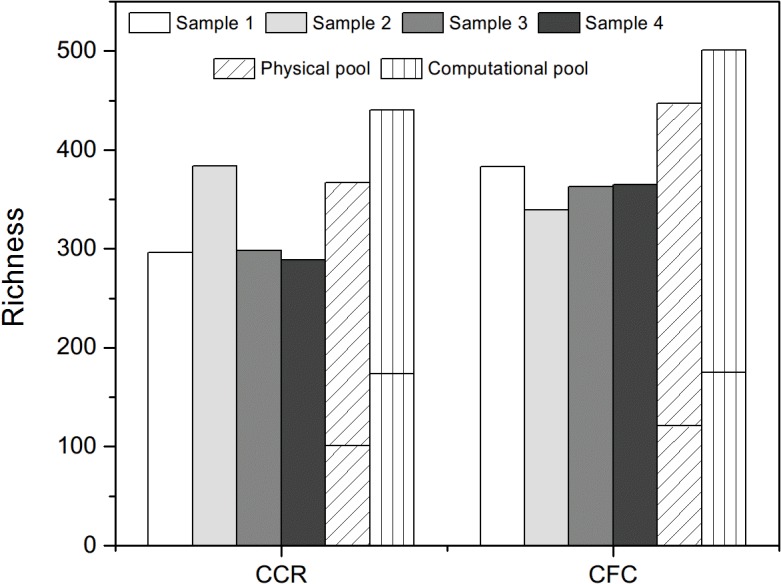
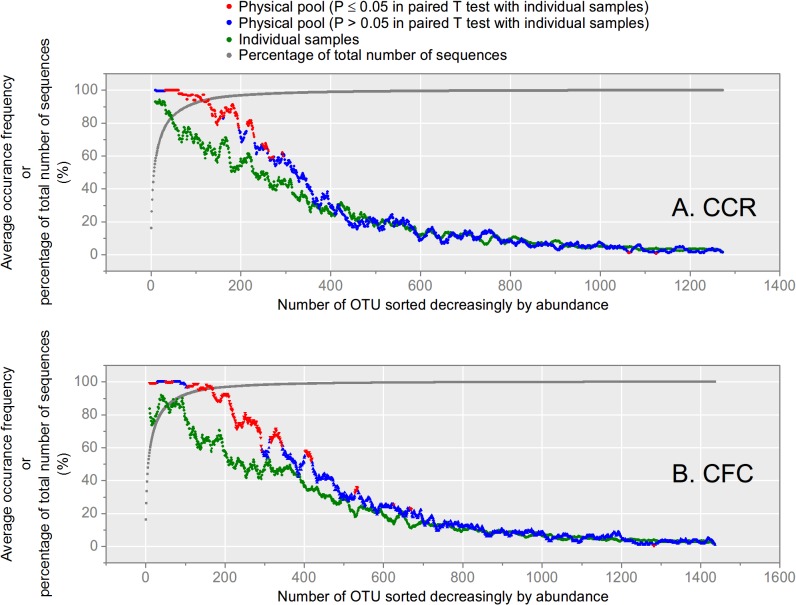
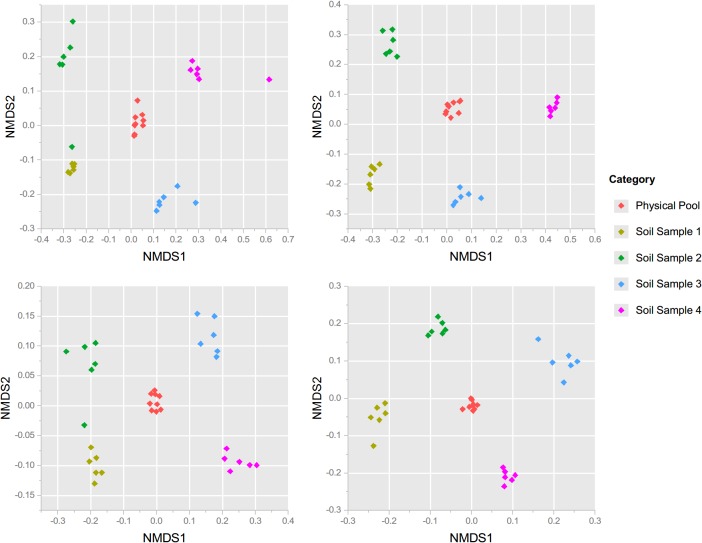
Next generation fungal amplicon sequencing is being used with increasing frequency to study fungal diversity in various ecosystems; however, the influence of sample preparation on the characterization of fungal community is poorly understood. We investigated the effects of four procedural modifications to library preparation for high-throughput sequencing (HTS). The following treatments were considered: 1) the amount of soil used in DNA extraction, 2) the inclusion of additional steps (freeze/thaw cycles, sonication, or hot water bath incubation) in the extraction procedure, 3) the amount of DNA template used in PCR, and 4) the effect of sample pooling, either physically or computationally. Soils from two different ecosystems in Minnesota, USA, one prairie and one forest site, were used to assess the generality of our results. The first three treatments did not significantly influence observed fungal OTU richness or community structure at either site. Physical pooling captured more OTU richness compared to individual samples, but total OTU richness at each site was highest when individual samples were computationally combined. We conclude that standard extraction kit protocols are well optimized for fungal HTS surveys, but because sample pooling can significantly influence OTU richness estimates, it is important to carefully consider the study aims when planning sampling procedures.


Conflict of interest statement

Competing Interests: The authors have declared that no competing interests exist.

Figures

Fig 1
Fig 1. Rarefied OTU richness estimates of soil fungi by treatment.
A-B. Amount of soil extracted for CCR and CFC, respectively (n = 5 for each treatment). C-D. Extraction modification for CCR and CFC, respectively (n = 4 for each treatment). E-F. Amount of DNA template in each PCR reactions for CCR and CFC, respectively (n = 3 for each treatment). The same letter above each bar indicates no significant difference (P ≤ 0.01) in ANOVA using Tukey’s multiple comparison tests (α = 0.05).
Fig 2
Fig 2. Soil fungal OTU richness of individual samples, physical pool, and computational pool.
The shorter bars inside of physical and computational pools indicated the number of unique OTUs that were not shared between the two pools in each site. All samples used 0.25 g soil with standard DNA extraction and PCR procedures.
Fig 3
Fig 3. Average occurrence frequency of OTUs in physical pools versus individual samples, and percent of total number of sequence, moving from abundant (left) to rare (right) taxa.
Physical pools are in red and blue points, individual samples are in green points, total number of sequence is in gray points. The occurrence frequency of each OTU is defined as the occurrence (sequence number ≥ 1) in either 9 physical pools or 24 individual pools in the form of percentage in both site. The average occurrence frequency shown in the plot was calculated as the average of 20 OTUs around each individual OTU. In the physical pool, red points indicate significant difference (P ≤ 0.05) in paired T-test between physical and individual pools (α = 0.05), while blue points were not significantly different. All T-tests were adjusted with Bonferroni correction with hypotheses n = 20. The percent of total number of sequence was defined as the sum of abundance percentage from 1st to current OTU in descending order of abundance.
Fig 4
Fig 4. Nonmetric Multidimensional Scaling Plot of physical pools and individual plot samples from each site.
Plots based on either Bray-Curtis distance matrices generated from rarefied taxon abundances of A. CCR and B. CFC or from presence/absence matrix of C. CCR and D. CFC.
Fig 5
Fig 5. Nonmetric Multidimensional Scaling Plot of samples from CCR and CFC.
Plot is based on a Bray-Curtis distance matrix generated from rarefied taxon abundances.

Similar articles

Cited by

References

    1. Fierer N, Bradford MA, Jackson RB. Toward an ecological classification of soil bacteria. Ecology. 2007;88: 1354–64. - PubMed
    1. Falkowski PG, Fenchel T, Delong EF. The microbial engines that drive Earth’s biogeochemical cycles. Science. 2008;320: 1034–1039. 10.1126/science.1153213 - DOI - PubMed
    1. Wagg C, Bender SF, Widmer F, van der Heijden MGA. Soil biodiversity and soil community composition determine ecosystem multifunctionality. Proc Natl Acad Sci. 2014;111: 5266–70. 10.1073/pnas.1320054111 - DOI - PMC - PubMed
    1. Curtis TP, Head IM, Lunn M, Woodcock S, Schloss PD, Sloan WT. What is the extent of prokaryotic diversity? Phil Trans R Soc Lond A. 2006;361: 2023–37. 10.1098/rstb.2006.1921 - DOI - PMC - PubMed
    1. Caporaso JG, Lauber CL, Walters WA, Berg-Lyons D, Huntley J, Fierer N, et al. Ultra-high-throughput microbial community analysis on the Illumina HiSeq and MiSeq platforms. ISME J. 2012;6: 1621–4. 10.1038/ismej.2012.8 - DOI - PMC - PubMed

Publication types