

Development and Integration of Genome-Wide Polymorphic Microsatellite Markers onto a Reference Linkage Map for Constructing a High-Density Genetic Map of Chickpea
- PMID: 25974327
- PMCID: PMC4431833
- DOI: 10.1371/journal.pone.0125583
Development and Integration of Genome-Wide Polymorphic Microsatellite Markers onto a Reference Linkage Map for Constructing a High-Density Genetic Map of Chickpea
Abstract
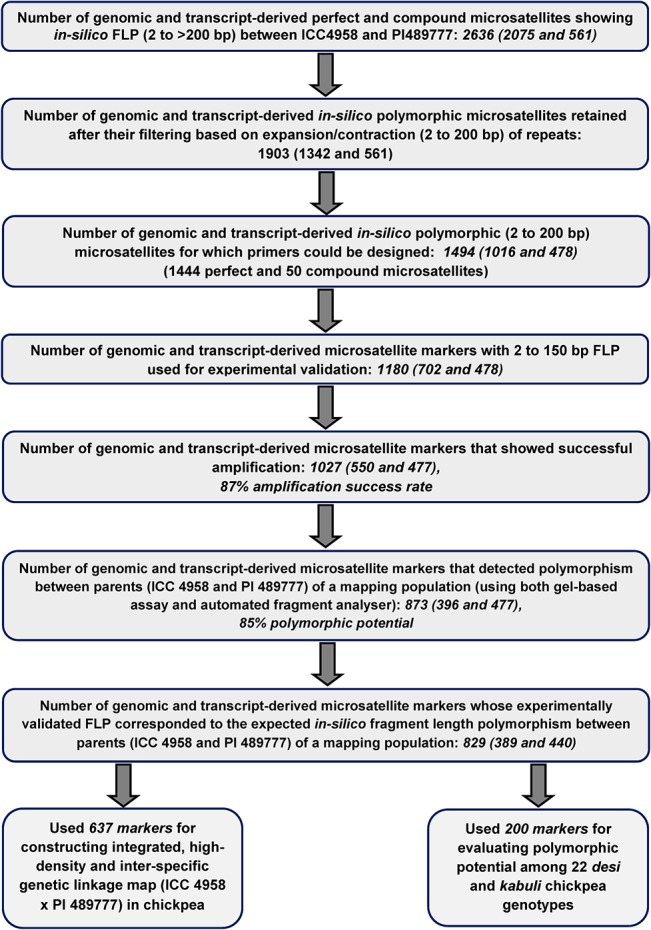
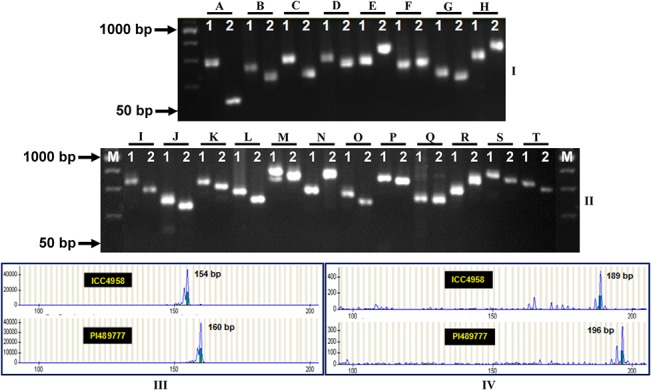
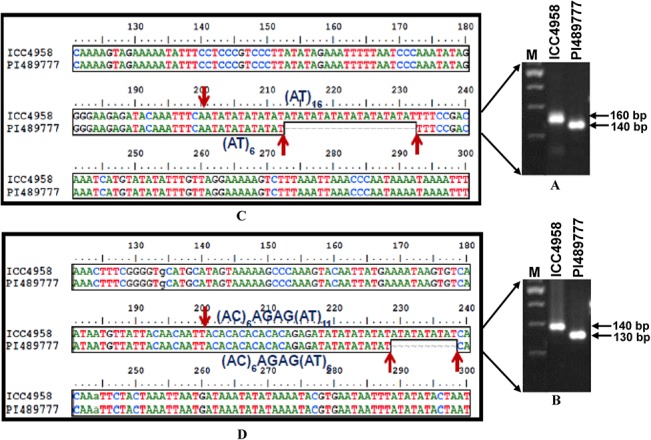
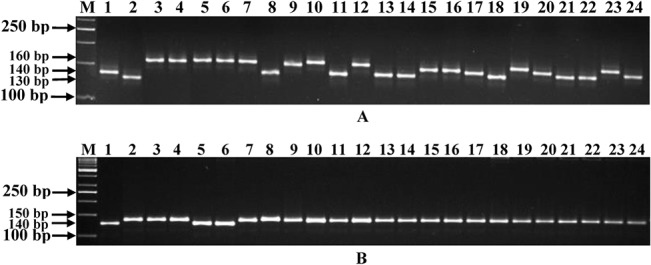
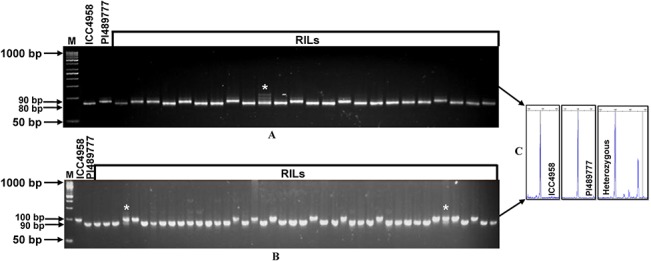
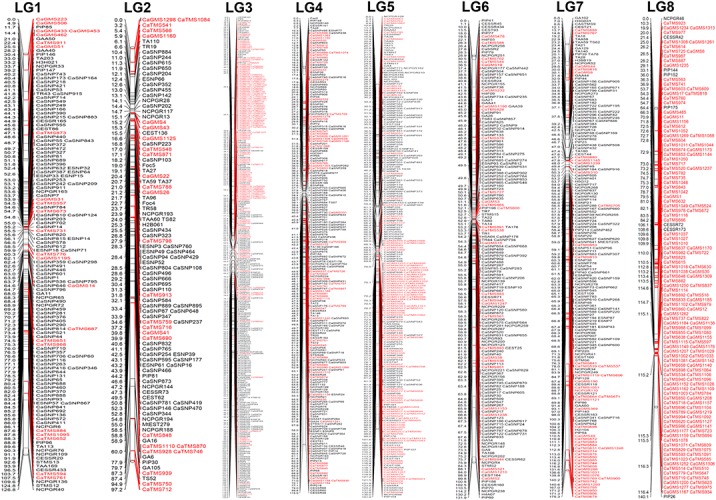
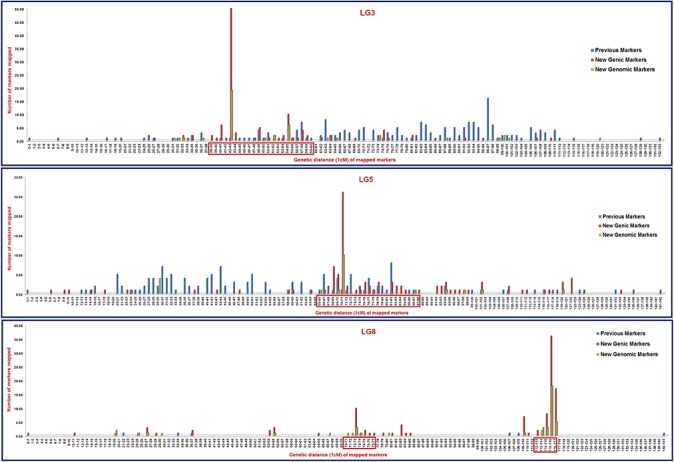
The identification of informative in silico polymorphic genomic and genic microsatellite markers by comparing the genome and transcriptome sequences of crop genotypes is a rapid, cost-effective and non-laborious approach for large-scale marker validation and genotyping applications, including construction of high-density genetic maps. We designed 1494 markers, including 1016 genomic and 478 transcript-derived microsatellite markers showing in-silico fragment length polymorphism between two parental genotypes (Cicer arietinum ICC4958 and C. reticulatum PI489777) of an inter-specific reference mapping population. High amplification efficiency (87%), experimental validation success rate (81%) and polymorphic potential (55%) of these microsatellite markers suggest their effective use in various applications of chickpea genetics and breeding. Intra-specific polymorphic potential (48%) detected by microsatellite markers in 22 desi and kabuli chickpea genotypes was lower than inter-specific polymorphic potential (59%). An advanced, high-density, integrated and inter-specific chickpea genetic map (ICC4958 x PI489777) having 1697 map positions spanning 1061.16 cM with an average inter-marker distance of 0.625 cM was constructed by assigning 634 novel informative transcript-derived and genomic microsatellite markers on eight linkage groups (LGs) of our prior documented, 1063 marker-based genetic map. The constructed genome map identified 88, including four major (7-23 cM) longest high-resolution genomic regions on LGs 3, 5 and 8, where the maximum number of novel genomic and genic microsatellite markers were specifically clustered within 1 cM genetic distance. It was for the first time in chickpea that in silico FLP analysis at genome-wide level was carried out and such a large number of microsatellite markers were identified, experimentally validated and further used in genetic mapping. To best of our knowledge, in the presently constructed genetic map, we mapped highest number of new sequence-based robust microsatellite markers (634) which is an advancement over the previously documented (~300 markers) inter-specific genetic maps. This advanced high-density map will serve as a foundation for large-scale marker validation and genotyping applications, including identification and targeted mapping of trait-specific genes/QTLs (quantitative trait loci) with sub-optimal use of resources and labour in chickpea.
Conflict of interest statement
Figures
Similar articles
-
Advancing the STMS genomic resources for defining new locations on the intraspecific genetic linkage map of chickpea (Cicer arietinum L.).BMC Genomics. 2011 Feb 17;12:117. doi: 10.1186/1471-2164-12-117. BMC Genomics. 2011. PMID: 21329497 Free PMC article.
-
Genome-wide development and deployment of informative intron-spanning and intron-length polymorphism markers for genomics-assisted breeding applications in chickpea.Plant Sci. 2016 Nov;252:374-387. doi: 10.1016/j.plantsci.2016.08.013. Epub 2016 Aug 25. Plant Sci. 2016. PMID: 27717474
-
Genome-wide insertion-deletion (InDel) marker discovery and genotyping for genomics-assisted breeding applications in chickpea.DNA Res. 2015 Oct;22(5):377-86. doi: 10.1093/dnares/dsv020. Epub 2015 Sep 17. DNA Res. 2015. PMID: 26385353 Free PMC article.
-
Advances in genetics and molecular breeding of three legume crops of semi-arid tropics using next-generation sequencing and high-throughput genotyping technologies.J Biosci. 2012 Nov;37(5):811-20. doi: 10.1007/s12038-012-9228-0. J Biosci. 2012. PMID: 23107917 Review.
-
Current advances in chickpea genomics: applications and future perspectives.Plant Cell Rep. 2018 Jul;37(7):947-965. doi: 10.1007/s00299-018-2305-6. Epub 2018 Jun 2. Plant Cell Rep. 2018. PMID: 29860584 Review.
Cited by
-
Identification of candidate genes and natural allelic variants for QTLs governing plant height in chickpea.Sci Rep. 2016 Jun 20;6:27968. doi: 10.1038/srep27968. Sci Rep. 2016. PMID: 27319304 Free PMC article.
-
An Efficient Strategy Combining SSR Markers- and Advanced QTL-seq-driven QTL Mapping Unravels Candidate Genes Regulating Grain Weight in Rice.Front Plant Sci. 2016 Oct 26;7:1535. doi: 10.3389/fpls.2016.01535. eCollection 2016. Front Plant Sci. 2016. PMID: 27833617 Free PMC article.
-
Draft genome sequence of Cicer reticulatum L., the wild progenitor of chickpea provides a resource for agronomic trait improvement.DNA Res. 2017 Feb 1;24(1):1-10. doi: 10.1093/dnares/dsw042. DNA Res. 2017. PMID: 27567261 Free PMC article.
-
Simple Sequence Repeats (SSRs) and Telomeric Analysis in Somatic Organs of Reproductive and Non-Reproductive Castes of Termite Reticulitermes chinensis.Biology (Basel). 2025 Feb 6;14(2):166. doi: 10.3390/biology14020166. Biology (Basel). 2025. PMID: 40001934 Free PMC article.
-
Transcriptome landscape of perennial wild Cicer microphyllum uncovers functionally relevant molecular tags regulating agronomic traits in chickpea.Sci Rep. 2016 Sep 29;6:33616. doi: 10.1038/srep33616. Sci Rep. 2016. PMID: 27680662 Free PMC article.
References
-
- Li YC, Korol AB, Fahima T, Nevo E (2004) Microsatellites within genes: structure, function, and evolution. Mol Biol Evol 21: 991–1007. - PubMed
-
- Varshney RK, Graner A, Sorrells ME (2005) Genic microsatellite markers in plants: features and applications. Trends Biotechnol 23, 48–55. - PubMed
-
- Beckmann JS, Soller M (1990) Towards a unified approach to genetic mapping of eukaryotes based on sequence tagged microsatellite sites. Nat Biotechnol 8: 930–932. - PubMed
-
- Winter P, Benko-Iseppon AM, Huttel B, Ratnaparkhe A, Tullu A, Sonnante G, et al. (2000) A linkage map of chickpea (Cicer arietinum L.) genome based on recombinant inbred lines from a C. arietinum x C. reticulatum cross: localization of resistance genes for fusarium wilt races 4 and 5. Theor Appl Genet 101: 1155–1163.
Publication types
MeSH terms
LinkOut - more resources
Full Text Sources
Other Literature Sources
