

Plasma metabolomic profiling of patients with diabetes-associated cognitive decline
- PMID: 25974350
- PMCID: PMC4431856
- DOI: 10.1371/journal.pone.0126952
Plasma metabolomic profiling of patients with diabetes-associated cognitive decline
Abstract
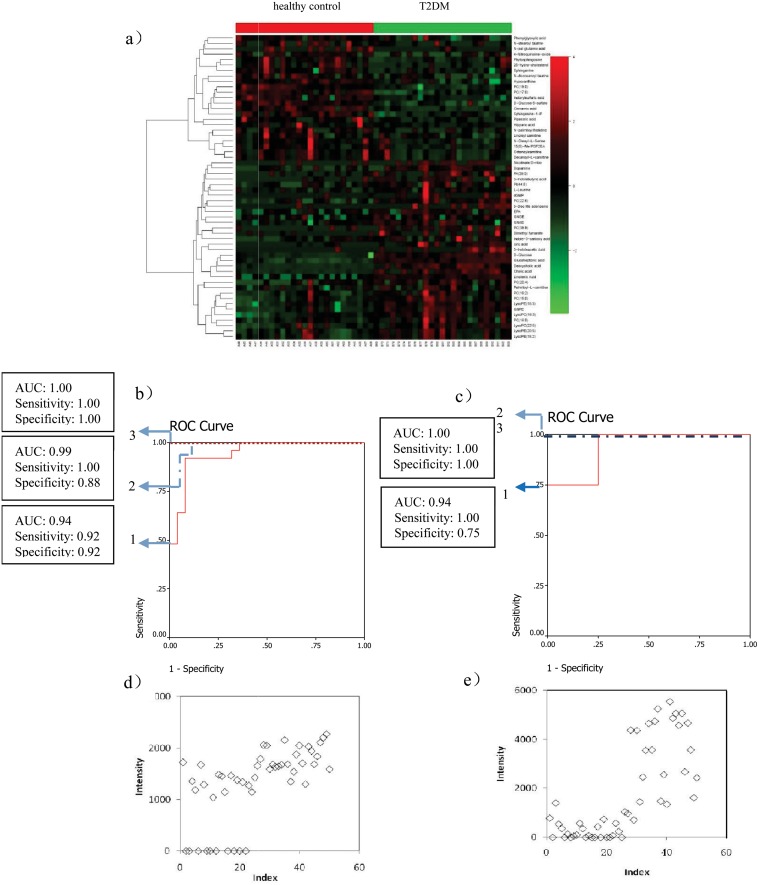
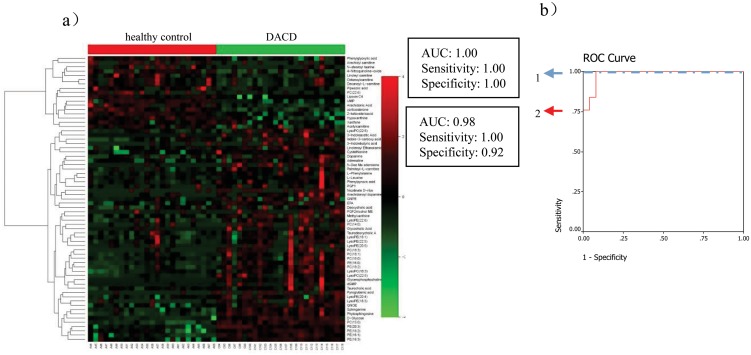
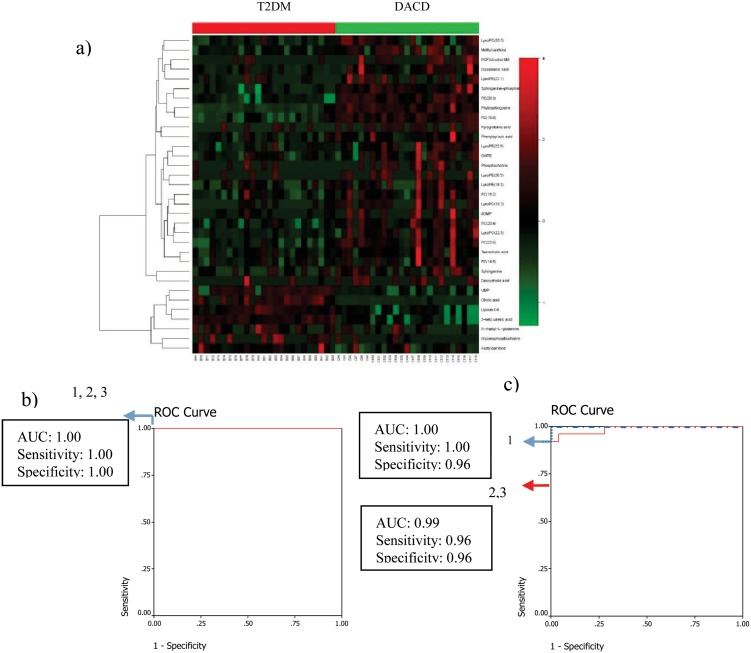
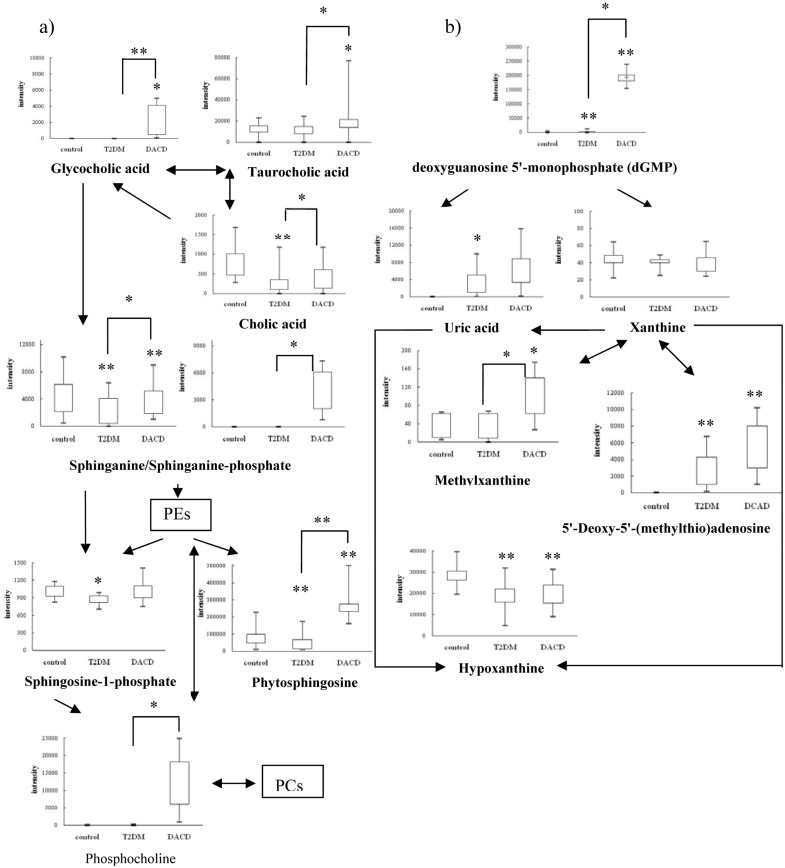
Diabetes related cognitive dysfunction (DACD), one of the chronic complications of diabetes, seriously affect the quality of life in patients and increase family burden. Although the initial stage of DACD can lead to metabolic alterations or potential pathological changes, DACD is difficult to diagnose accurately. Moreover, the details of the molecular mechanism of DACD remain somewhat elusive. To understand the pathophysiological changes that underpin the development and progression of DACD, we carried out a global analysis of metabolic alterations in response to DACD. The metabolic alterations associated with DACD were first investigated in humans, using plasma metabonomics based on high-performance liquid chromatography coupled with quadrupole time-of-flight tandem mass spectrometry and multivariate statistical analysis. The related pathway of each metabolite of interest was searched in database online. The network diagrams were established KEGGSOAP software package. Receiver operating characteristic (ROC) analysis was used to evaluate diagnostic accuracy of metabolites. This is the first report of reliable biomarkers of DACD, which were identified using an integrated strategy. The identified biomarkers give new insights into the pathophysiological changes and molecular mechanisms of DACD. The disorders of sphingolipids metabolism, bile acids metabolism, and uric acid metabolism pathway were found in T2DM and DACD. On the other hand, differentially expressed plasma metabolites offer unique metabolic signatures for T2DM and DACD patients. These are potential biomarkers for disease monitoring and personalized medication complementary to the existing clinical modalities.
Conflict of interest statement
Figures

Similar articles
-
Untargeted Metabolomic Profiling Reveals Differentially Expressed Serum Metabolites and Pathways in Type 2 Diabetes Patients with and without Cognitive Decline: A Cross-Sectional Study.Int J Mol Sci. 2024 Feb 13;25(4):2247. doi: 10.3390/ijms25042247. Int J Mol Sci. 2024. PMID: 38396924 Free PMC article.
-
Calcium-deficiency assessment and biomarker identification by an integrated urinary metabonomics analysis.BMC Med. 2013 Mar 28;11:86. doi: 10.1186/1741-7015-11-86. BMC Med. 2013. PMID: 23537001 Free PMC article.
-
Metabolomic profiling suggests systemic signatures of premature aging induced by Hutchinson-Gilford progeria syndrome.Metabolomics. 2019 Jun 28;15(7):100. doi: 10.1007/s11306-019-1558-6. Metabolomics. 2019. PMID: 31254107
-
Metabolomic Profiling of Mice Serum during Toxoplasmosis Progression Using Liquid Chromatography-Mass Spectrometry.Sci Rep. 2016 Jan 20;6:19557. doi: 10.1038/srep19557. Sci Rep. 2016. PMID: 26785939 Free PMC article.
-
Risk Factors, Pathological Changes, and Potential Treatment of Diabetes-Associated Cognitive Dysfunction.J Diabetes. 2025 Apr;17(4):e70089. doi: 10.1111/1753-0407.70089. J Diabetes. 2025. PMID: 40296350 Free PMC article. Review.
Cited by
-
A Review of Bile Acid Metabolism and Signaling in Cognitive Dysfunction-Related Diseases.Oxid Med Cell Longev. 2022 Mar 11;2022:4289383. doi: 10.1155/2022/4289383. eCollection 2022. Oxid Med Cell Longev. 2022. Retraction in: Oxid Med Cell Longev. 2024 Jan 9;2024:9764647. doi: 10.1155/2024/9764647. PMID: 35308170 Free PMC article. Retracted. Review.
-
Bile acid modulation by gut microbiota: a bridge to understanding cognitive health.Ann Med Surg (Lond). 2024 Aug 7;86(9):5410-5415. doi: 10.1097/MS9.0000000000002433. eCollection 2024 Sep. Ann Med Surg (Lond). 2024. PMID: 39239005 Free PMC article. Review.
-
Untargeted metabolomic analysis uncovers metabolic variability of four Bifidobacterial strains for probiotic development.Front Microbiol. 2025 Jan 31;16:1522036. doi: 10.3389/fmicb.2025.1522036. eCollection 2025. Front Microbiol. 2025. PMID: 39959161 Free PMC article.
-
Metabolomics and pathway analyses to characterize metabolic alterations in pregnant dairy cows on D 17 and D 45 after AI.Sci Rep. 2018 Apr 13;8(1):5973. doi: 10.1038/s41598-018-23983-2. Sci Rep. 2018. PMID: 29654235 Free PMC article.
-
Differences of serum glucose and lipid metabolism and immune parameters and blood metabolomics regarding the transition cows in the antepartum and postpartum period.Front Vet Sci. 2024 Feb 2;11:1347585. doi: 10.3389/fvets.2024.1347585. eCollection 2024. Front Vet Sci. 2024. PMID: 38371596 Free PMC article.
References
-
- Biessels GJ, Staekenborg S, Brunne E, Brayne C, Scheltens P. Risk of dementia in diabetes mellitus: a systematic review. Lancet Neurol. 2006; 5: 64–74. - PubMed
-
- Wild S, Roglic G, Green A, Sicree R, King H. Global prevalence of diabetes: estimates for the year 2000 and projections for 2030. Diabetes Care. 2004; 27: 1047–1053. - PubMed
Publication types
MeSH terms
Substances
LinkOut - more resources
Full Text Sources
Other Literature Sources
Medical
